www.rsc.org/
advances
RSC Advances
This is an Accepted Manuscript, which has been through the Royal Society of Chemistry peer review process and has been accepted for publication.Accepted Manuscripts are published online shortly after
acceptance, before technical editing, formatting and proof reading. Using this free service, authors can make their results available to the community, in citable form, before we publish the edited article. This Accepted Manuscript will be replaced by the edited, formatted and paginated article as soon as this is available.
You can find more information about Accepted Manuscripts in the
Information for Authors.
Please note that technical editing may introduce minor changes to the text and/or graphics, which may alter content. The journal’s standard Terms & Conditions and the Ethical guidelines still apply. In no event shall the Royal Society of Chemistry be held responsible for any errors or omissions in this Accepted Manuscript or any consequences arising from the use of any information it contains.
This article can be cited before page numbers have been issued, to do this please use: S. Magdouli, S. K. Brar and J. Blais, RSC Adv., 2016, DOI: 10.1039/C6RA16382C.
1 1
Lipid production by Yarrowia lipolytica grown on biodiesel-derived crude glycerol: 2
Optimization of growth parameters and their effects on the fermentation efficiency 3
4
Magdouli Saraa, Satinder Kaur Brarb, Jean François Blaisc,* 5
6
a
Ph.D. student, Institut national de la recherche scientifique (Centre Eau, Terre et 7
Environnement), Université du Québec, 490 rue de la Couronne, Québec, Qc, Canada, 8
G1K 9A9, Phone: (418) 654-4677, Fax: (418) 654-2600, email: magdouli.sara@ete.inrs.ca 9
b
Professor, Institut national de la recherche scientifique (Centre Eau, Terre et Environnement), 10
Université du Québec, 490 rue de la Couronne, Québec, Qc, Canada, G1K 9A9, Phone: (418) 11
654-3116, Fax: (418) 654-2600, email: satinder.brar@ete.inrs.ca 12
c
Professor, Institut national de la recherche scientifique (Centre Eau, Terre et Environnement), 13
Université du Québec, 490 rue de la Couronne, Québec, Qc, Canada, G1K 9A9, Phone: (418) 14
654-2575, Fax: (418) 654-2600, email: blaisjf@ete.inrs.ca 15 16 17 * Corresponding author 18 Email: blaisjf@ete.inrs.ca 19 20
RSC
Advances
Accepted
Manuscript
2 Abstract
21
Yarrowia lipolytica, a well-known oleaginous strain for single cells oil (SCO) production was 22
grown in nitrogen-limited flask cultures. The effect of increasing the initial crude glycerol and 23
nitrogen concentration was studied along fermentation process. Significant biomass and SCO 24
production was reported with high initial glycerol concentration of 89 g/L and 0.54 g NH4OH/L
25
during 66 h. Optimized culture conditions were tested using 5-L fermenter during two-stage 26
cultivation with a dissolved oxygen shift from 60% to 30% of dissolved oxygen corresponding to 27
50-80 h-1. Lipid concentration of 13.6 ± 0.8 g/L and lipid content 52.7 ± 1.2% (w/w of dry 28
biomass) was obtained which is higher compared with literature values for Yarrowia species 29
grown on crude glycerol based media. The yeast lipids contained mainly oleic, palmitic, linoleic 30
and stearic acids which could serve as perfect precursors for the synthesis of biodiesel. 31
32
Keywords: biodiesel-derived glycerol, Y. lipolytica, single cell oil, citric acid. 33 34
RSC
Advances
Accepted
Manuscript
3 1 Introduction
35
Biodiesel has gained interest in recent years due to its contribution to minimize dependence on 36
fossils fuels, especially in transportation sector. Moreover, biodiesel is known to be 37
biodegradable, sustainable, renewable and no toxic fuel. It is reported to reduce sulfur and 38
carbon dioxide emissions compared to fossil engines. 1-2 Recently, it was estimated that the 39
biodiesel market will reach 37 billion gallons by 2016 with an annual growth of 42% which is 40
indirectly producing 4 billion gallons of crude glycerol as a by-product. Crude glycerol of 10 kg 41
will be produced from 100 kg of biodiesel. 3-4 Plants oils, e.g, jatropha, corn and canola were 42
reported to produce biodiesel. However, these vegetable oils cannot meet the huge demand of 43
utilization and does not contribute to global energy security. Therefore, oleaginous 44
microorganisms that are reported to produce single cells oils in the presence of high carbon 45
source and a low nitrogenous source represented potential candidates. 5-6 These 46
microorganisms offer advantages to grow faster than higher plants and do not require land. 47
Likewise, a significant number of reports, appearing in most cases in the past few years, 48
indicates the potential of heterotrophic microorganisms to convert crude glycerol into added-49
value products, such as microbial lipids (also called single cell oils, SCOs) citric acid, microbial 50
mass, enzymes and polyols 7-11. Moreover, oleaginous microorganisms are efficient lipid 51
producers in the presence of a waste (zero energy). 12-13 Among natively oleaginous 52
microorganisms, Yarrowia lipolytica, is one of the most extensively studied "non-conventional" 53
yeasts due to its biotechnological potential and the availability of genetic tools aiming for the 54
production and the storage of large amounts of lipid. Accordingly, wild Yarrowia lipolytica has 55
been reported to accumulate up to 36% of dry weight from glucose and more than 50% in the 56
RSC
Advances
Accepted
Manuscript
4
presence of hydrophobic substrates. 14-15 In contrast, metabolically engineered strains can 57
achieve more than 90% of dry weight 16. In addition to SCO production, Yarrowia species are 58
reported to secrete various secondary metabolites, such as citric acid (CA) 10-11, 17-18, 59
extracellular enzymes 19-20 and other functional fatty acids of commercial interest such as lipid-60
derived neutraceuticals and pharmaceuticals using genetically engineered strains. 9 61
Several applied studies have focused on increasing SCO production through increasing the 62
overflow of carbon sources. Among common substrates, glucose was widely investigated 21, 63
however, this latter competes directly with food and feed production, which is not the case for 64
other sources. 22 Accordingly, glycerol is known to have a greater degree of reduction than 65
other carbohydrates and is less costly and more readily available. Due to carbon rich 66
composition. 23-24 In yeast, the glycolytic pathway produces intermediate compounds from 67
glycerol either via the phosphorylation pathway 25-26 or the oxidative pathway 68
(dehydrogenation of glycerol and the subsequent phosphorylation of the reaction product) 27 69
and almost exclusive synthesis of reduced products during glycerol fermentation reflects the 70
highly reducible state of glycerol. Additionally, glycerol may be readily incorporated in the core 71
of triglycerides, which are stored in lipid bodies along with steryl esters. 28 Besides, others 72
studies focused on refining the production process by identifying optimal culture conditions 73
and defining optimal medium composition. 29-31 In this regard, physiological conditions, such as 74
pH, temperature and oxygen concentrations, have also been shown to influence the lipid 75
composition. 32-33 Taken together, the aim of the current study was to investigate the potential 76
of biodiesel-derived waste glycerol conversion into metabolic compounds of added-value 77
(SCOs) by yeast strain. After an initial selection, the yeast strains were cultivated on biodiesel-78
RSC
Advances
Accepted
Manuscript
5
derived waste glycerol utilized as a carbon source under nitrogen-limited conditions (conditions 79
that favour the accumulation of storage lipid by microorganisms). The effect of glycerol and 80
NH4OH concentration and fermentation time and identification of the most appropriate
81
production conditions, and characterization of the produced lipids was carried out. 82
2 Materials and methods 83
2.1 Strain and culture conditions
84
Y. lipolytica SM7, isolated from woody forest (Alma, Canada) in a glycerol enriched medium 85
(GEM) composed of 1 g of woody forest soil and 100 g pure glycerol/L, 0.3 g yeast extract/L, 1 g 86
KH2PO4/L, 0.5 g MgSO4 7H2O/L). Enrichment was performed at 28oC at 180 rpm in 48 h. After
87
that, a serial of decimal dilutions was performed to select strains having the capacity to grow on 88
high rich carbon media. The quantitative selection was based on Nile Red staining. Strains 89
having maximum of lipids droplets were of wide interest in the current study. The newly-90
isolated strain was identified by means of genetic tools. The genomic identification was based 91
on ribosomal 5.8s sequencing. PCR amplification yielded a 332-bp sequence and rDNA 92
sequence data was subjected to a BLAST search tool of NCBI. Homology results showed that Y. 93
lipolytica SM7 has around 99% sequence similarity with Yarrowia lipolytica. In this regard, Y. 94
lipolytica SM7 (gene bank accession KF908251) was selected and its capacity to produce lipids 95
in crude glycerol based media was optimised in the present study. The strain was grown on 96
YEPD agar (yeast extract peptone dextrose agar) at 28oC for 2 days, maintained at 4oC and sub-97
cultured every three months. 98
RSC
Advances
Accepted
Manuscript
6
The pre-culture was obtained by inoculating a separate colony of Y. lipolytica SM7 in yeast 99
extract peptone dextrose (YPD) medium containing (g/L): Glucose 20, peptone 20 and yeast 100
extract 10 and incubating it at 28°C for 24 h prior to cultivation. Lipid production was 101
performed in duplicates, aerobically, in 2-L Erlenmeyer flasks containing 500 mL of the designed 102
media (crude glycerol, 1 g yeast extract/L, 3 g K2HPO4/L, 3 g NaH2PO4.H2O/L, 0.5 g
103
MgSO4.7H2O/L, 0.040 g ZnSO4.7H2O/L, 0.016 g FeSO4.7H2O/L, 0.25 µg/L biotin) and inoculated
104
with the pre-culture (initial OD 600 = 0.01), 5% (v/v) and incubated at 28°C in a rotary shaker 105
incubator, under agitation of 180 rpm. Ammonium hydroxide (NH4OH, 29%, v/v) was used as
106
nitrogenous source and pH was re-adjusted in all solutions by using NaOH and H2SO4 4 N. Crude
107
glycerol was provided by Rothsay (Ontario, Canada), this latter was used as carbon source 108
resulted from the transesterification of animal fats, its characterization was presented in 109
Table 1. Its high composition of glycerol and low quantities of impurities such soap and salts 110
makes this waste a very potential carbon source for lipid accumulation. 111
2.2 Glycerol and metabolites analysis
112
For the measurement of glycerol and others organics acids in the broth, LC/MS/MS technique 113
was employed. The technical details of the LC/ MS/MS instrument used for the analysis were: 114
(a) for sugar estimation: Thermo TSQ Quantum model, equipped with an Electrospray 115
Ionization (ESI) in negative ion mode; Zorbax Carbohydrate (4.6 mm, 150 mm, 5 mm, Agilent) 116
analytical column; 75% acetonitrile; 0.1% NH4OH; 25% water and 0.1% NH4OH mobile phase
117
and 10 mL injection volume. Glycerol, citric acid, malic acid, (all from Sigma) was used as the 118
internal standards; and (b) for phenolic compound estimation: Thermo TSQ Quantum model, 119
equipped with an Electrospray Ionization (ESI) in negative ion mode, Thermo Scientific Beta 120
RSC
Advances
Accepted
Manuscript
7
Basic C18 LC column (100 mm, 2.1 mm, 3 mm); mobile phase of methanol and acidified water 121
(0.1% acetic acid) at a ratio of 17.5: 82.5; Flow rate of 0.3 mL/min and 20 mL injection volume. 122
2.3 Biomass determination and lipid extraction
123
Samples were collected by centrifugation at 5 000 x g for 15 min. The resulting pellet was 124
washed once, frozen and lyophilized to a constant mass. The extraction of total cellular lipids 125
was performed according to Folch method. 34 Five hundred milligrams of lyophilized cells were 126
suspended in methanol/chloroform (2:1, v/v). After the first extraction, the remaining cell lipids 127
were further extracted twice with methanol/chloroform (1:1, v/v); and then with 128
methanol/chloroform (1:2, v/v). Resulted organic phases were mixed and washed twice with 129
0.88% (w/v) KCl solution for 10 min and centrifuged for 5 min at 10 000 x g. Solvent phase was 130
withdrawn and transferred into a pre-weighed glass vial (W1). Lipids were recovered as dry 131
material after the evaporation of the solvent at 60 ± 1°C, until a constant weight was obtained 132
(W2). The lipid quantity was calculated by the difference between two vials (W2 and W1). The 133
lipid content in the dry biomass was reported to be the difference between two vials 134
extracted/500 mg × 100%. Finally, the obtained lipid was stored in dark at 4°C for further 135
transesterification study. 136
2.4 Lipid analysis and fatty acid composition
137
Fatty acid profile of the lipid was determined by methylation for conversion of fatty acids to 138
fatty acid methyl esters (FAMES). The lipids (0.01 – 0.1 g) obtained were first dissolved in 139
hexane (50 mL hexane/g lipid), then mixed with methanol. Lipid to methanol molar ratio was 140
1:6 (0.3 mL methanol per gram lipid). Sodium hydroxide was used as catalyst with 141
RSC
Advances
Accepted
Manuscript
8
concentration of 1% w/w (NaOH/oil). The mixture was then heated at 55 ± 1°C for 2 h. After 142
reaction, 5% NaCl solution was added to 100 mL per gram lipid, and then FAMEs was extracted 143
by two times washing with hexane (100 mL per gram lipid). After washing, the mixture was 144
allowed to stand for phase separation, and later hexane phase (upper layer) was collected. The 145
FAMEs in hexane was washed with 2% (w/v) sodium bicarbonate solution (20 mL per gram 146
lipid), and the top layer was then dried at 60 ± 1oC in an oven. 35 The FAMEs in hexane were 147
analyzed using Gas Chromatography- Mass Spectroscopy (GC–MS) (Perkin Elmer, Clarus 500). 148
The dimensions of the column used were 30 m × 0.25 mm, with a phase thickness of 0.25 µm. 149
The calibration curve was prepared with a mixture comprising 37 FAMEs (47885-U, 37 150
Component FAME Mix; Supelco, Bellefonte, PA, USA). 1.3-Dichlorobenzene was also used as an 151
internal standard. All experiments were performed in triplicates, and average results were 152
reported with standard deviation less than 5%. 153
2.5 Optimization study
154
Box–Behnken model was used for experimental design to optimize key process parameters for 155
enhanced lipid production. Box–Behnken design offers advantages in requiring fewer 156
experimental runs and is rotatable if the variance of the predicted response at any point x 157
depends only on the distance of x from the design center point. The 3K factorial design also 158
allows efficient estimation of second degree quadratic polynomials and obtains the 159
combination of values that optimizes the response within the region of the three dimensional 160
observation space. 36 In developing the regression equation, the relation between the coded 161
values and actual values can be described by the following equation: where xi is the coded 162
value of the independent variable, Xi is the uncoded value of the its independent variable, X is 163
RSC
Advances
Accepted
Manuscript
9
the uncoded value of the independent variable at the center point, and DXi is the step change
164
value. The levels of the variables and the experimental design are shown in Table 1. Lipid 165
concentration was associated with simultaneous changes in glycerol concentration (75, 87.5 166
and 100 g/L), ammonium hydroxide concentration (0.5, 1.0 and 1.5 g/L) and incubation time 167
(36, 52 and 72 h). A total of seventeen experimental runs decided by the 3K factorial Box– 168
Behnken design were carried out, and the center point was replicated three times to estimate 169
experimental errors. For predicting the optimal conditions, the quadratic polynomial equation 170
was fitted to correlate the relationship between variables and response (i.e. lipid 171
concentration), and estimated with the following equation (1): 172
173
Y=β0 ± ∑βiXi ± βijXiXi ± ∑βiiXi2 (1)
174
175
Where; Y is the predicted response; β0 the intercept, β i is the linear coefficient, βij the
176
quadratic coefficient, βii is the linear-by-linear interaction between Xi and Xj regression 177
coefficients and Xi, Xj are input variables that influence the response variable Y. The levels of 178
the variables and the experimental design are shown in Table 2. 179
The goodness of fit of the regression model was evaluated using the coefficient of 180
determination (R2) and the analysis of variance (ANOVA). For tested variable, the quadratic 181
model was represented as contour plots (3D) and response surface curves were generated 182
using Design-Expert Software. 183
RSC
Advances
Accepted
Manuscript
10
To evaluate the RSM optimized culture parameters, fermentation was conducted in 5-L 184
fermenter (Biostat B plus, Sartorius Stedim Biotech, Allemagne) to assess lipid production in 185
crude glycerol based media. Polarographic pH-electrode (Mettler Toledo, USA) was calibrated 186
using buffers of pH 4 and 7 (VWR, Canada). Before sterilization cycle. The oxygen probe was 187
calibrated to zero (using sodium thiosulfate water) and 100% (air saturated water). Propylene 188
glycol (Sigma-Canada) as an anti-foam agent. The fermenter with the medium was then 189
sterilized in situ at 121oC for 20 min. After the fermenter cooled down to 28oC, DO probe was 190
recalibrated to zero and 100% saturation by sparging N2 gas and air, respectively, at agitation
191
rate of 250 rpm. The pH of the fermenter solution was adjusted to 6.5 with 4 N H2SO4.
192
Thereafter, sterilized crude glycerol (83% w/v) and mineral solution was transferred to the 193
fermenter as carbon source under aseptic condition. Agitation was provided to mix the 194
solution, after mixing, pre-culture of Y. lipolytica was added to the fermenter. 195
2.6 Morphological study
196
Cells were analyzed by scanning electron microscopy (SEM, Carl Zeiss EVO® 50) to have a highly 197
magnified view of the surface morphology and the behavior of cells during lipogenesis. To 198
prepare samples for SEM, cells were dried using lyophilizer (VirTis Virtual 50-L pilot lyophilizer). 199
Dried samples were directly mounted on a SEM grid and sputter coated (SPI Module Sputter 200
Coater) with gold before SEM analysis. 201 202 203
RSC
Advances
Accepted
Manuscript
11 3 Results and discussion
204
3.1 Evaluation of growth parameters
205
Despite the higher concentrations reported in the presence of hydrophobic substrates 14-15, 206
scarce information was available for hydrophilic carbon sources. The recent data is related to 207
Polburee (2015, 2016) who described the growth of Rhodosporidium toruloides on biodiesel-208
derived crude glycerol with the aim to obtain high lipid content up to 63.8% of dry biomass with 209
a lipid concentration of 8.99 g/L and a lipid yield of 0.16 g/g. 23, 37 210
For Y. lipolytica, most of the relevant literature emphasized the importance of fatty materials as 211
low cost substrates to produce SCO and other "tailor-made" lipids, such as cocoa-butter 212
substitutes (CBS), illipé substitutes, shea butter, sal fat. 38-40 Studies have revealed that 213
Y. lipolytica is primordially a citric acid producer. 10-11, 41 Moreover, Cescut has reported that the 214
lipid accumulation in this yeast is a metabolic balance between citric acid production and 215
triglyceride (TAG) synthesis 42 and the shift from growth phase and CA production phase (i.e. 216
lipogogenisis phase) is not well understood and more research should be performed to study 217
their concomitance. Taken together, the present study investigated whether low-cost raw 218
materials, such as crude glycerol and nitrogenous source, such as NH4OH could enhance the
219
lipid accumulation and CA production. Experiments showed that varying glycerol concentration 220
from 75 to 100 g/L with the variation of NH4OH yielded highest biomass and lipid production
221
(Table 3). 222
Herein, both of organic and inorganic nitrogen sources were employed; inorganic one favored 223
mostly product formation (lipid in the present case) rather than the biomass, whereas the 224
RSC
Advances
Accepted
Manuscript
12
organic nitrogen favored biomass and product (lipid) accumulation. 17, 28, 43-44 Due to this 225
reason, both organic (yeast extract) and inorganic nitrogen source (NH4OH) were used.
226
Moreover, the lipid production was defined to be the product of lipid content and biomass. 227
Based on the above information presented in Table 3, the optimization of the whole process via 228
RSM method was required to maximize the biomass and the lipid concentration and to lower 229
the CA production. Thus, when ammonium nitrogen was depleted, some quantities of stored 230
lipids and CA were synthesized (Table 3). Following lipogenic phase, glycerol was predominantly 231
converted into cellular lipid, while smaller quantity of CA was secreted in the growth 232
environment (0.5 - 4.0 g/L), especially in the culture of initial glycerol concentration of 75 and 233
87.5 g/L. A higher concentration of CA was observed in the presence of higher glycerol 234
concentration 100 g/L and reached around 12.0 ± 2.5 g/L). 235
Surface curves plots between binary reactions are presented in Figure 1. The variation of 236
glycerol concentration, ammonium hydroxide concentration and fermentation time have been 237
reported to have higher impact on lipid production and growth kinetics parameters. The 238
variance analysis and the estimation of parameters by the Design-Expert software, is illustrated 239
in Table 4. The p-value was used to evaluate the significance of the variable. When the p-value 240
of the variable was less than 5%, it represented that the variable had significant effects on the 241
response value. To further assess the effect of the variable, coefficient estimate was applied. 242
Lipid production could increase with increasing concentrations of glycerol, if the coefficient 243
estimate were positive. Conversely, the value of coefficient estimate was negative, indicating 244
that lipid production was negatively correlated with the variable levels. As shown in Table 4, 245
ammonium hydroxide concentration had significant effect on the lipid production (p value < 246
RSC
Advances
Accepted
Manuscript
13
0.0001). With increasing glycerol concentration and lowering nitrogenous source concentration 247
from 0.5 to 1.5 g/L, the cellular lipid content in Y. lipolytica increased evidently where the p-248
value was less than 0.0001. Therefore, lipid production was observed to be more with the lower 249
nitrogen and higher glycerol concentration. So far, various studies have been carried out to 250
demonstrate that the effect of glycerol concentration on lipid accumulation in many oleaginous 251
strains which is determined by concentration of carbon and nitrogen (C/N molar ratio). Thus, 252
oleaginous potential is critically affected by the C/N ratio of the culture and other factors like 253
aeration, inorganic salt presence, etc. 33, 45-46 Similar results have been presented by Karanth 254
and Sattur (1991), who found that lipid production in batch fermentation was similar for initial 255
sugar concentrations of 60 and 80 g/L. 47 Regarding the influence of the initial nitrogen content, 256
at high C/N ratios, the lipid production was shifted to the end of cultivation. Normally an 257
opposite pattern could be anticipated, since lower nitrogen levels would suggest an early shift 258
to lipid synthesis. Most authors recommend a C/N close to 100 as ideal for lipid accumulation. 259
48-50
In the present study, a C/N ratio of 75 is observed to enhance the biomass production and 260
the lipid around, 25 ± 1.2 g/L and 52% (w/w) of dry biomass, respectively, which is reported 261
also to be closer to the C/N ratio 70 for oleaginous and non- oleaginous. 51 The C/N ratio was 262
calculated based on the carbon present in the glycerol (39% w/w) and the nitrogen present in 263
the yeast extract approximately (12% w/w). 264
When glycerol concentration was 87.5 g/L with C/N ratio 112.5, lipid content varied between 265
40.5 to 45.3% (w/w) of dry biomass. Therefore, increasing glycerol concentration and lowering 266
nitrogen amount would increase remarkably the lipid content inside the cells. 267
RSC
Advances
Accepted
Manuscript
14
Moreover, for Cryptococcus sp., the highest content of lipids was measured at a C/N ratio of 60-268
90 and a nitrogen concentration of 0.2% with 60-57% lipids of the dry biomass. 52 Furthermore, 269
fermentation time had a positive effect, inducing higher lipid accumulation in cells. Additionally, 270
fermentation time was also identified as a significant factor for lipid production. It was obvious 271
that increasing the fermentation time could dramatically promote the growth rate of 272
Y. lipolytica (p-value lower than 0.0001). The lipid production was improved with fermentation 273
time which accounted for 10.3% (coefficient estimation) of the total contribution. This was in 274
agreement with previous reports that confirmed that higher the fermentation time, more the 275
lipid synthesis is enhanced, however, the time should not exceed the recommended value of 276
66 h as degradation of lipid occurred after 66 h. 53 When nutrients are no longer provided by 277
the medium, lipids stored will be mobilized by TAG lipases and hydrolases to serve as carbon 278
source to maintain the growth of Y. lipolytica. In general, microorganisms consume their 279
accumulated lipids mainly through the glyoxylate bypass pathway, and, more specifically, 280
different microbes might preferentially consume different kinds of fatty acids to maintain their 281
growth. 39 282
In order to check the fit of the model, R2 and F-value were calculated. Here, R2 was 0.9907, 283
indicating that 99.07% of the data in Box-Behnken design could be explained by the model; that 284
is, the proposed model was reasonable. Moreover, the model F-value of 83.32 demonstrated 285
that the model was significant, as revealed by a p-value lower than 0.0001, which further 286
supported that the model fitted in to these data. From the analysis of R adj 2 and R pred 2, the R 287
pred2 of 0.861 was in good agreement with the R adj 2 of 0.978. 288
RSC
Advances
Accepted
Manuscript
15
Based on the previous results, Box–Behnken design was used to further confirm the optimum 289
growth factors of glycerol concentration, nitrogen concentration and fermentation time to 290
maximize lipid production. In order to investigate the adequacy of the model, multiple 291
regression analyses on the data were applied. The results are listed in Table 4, which were 292
mainly the individual and the binary effects of all variables and their interactions on lipid 293
production. The multiple correlation coefficient R2 of 0.990 suggested that the quadratic 294
polynomial model was suitable for revealing the mutual relationship of factors and predicting 295
the response values in the study. 296
According to the attained results and the equation, the model predicted the maximum lipid 297
production by equation (2). 298
299
Lipid content = -81.046 ± 0.0527 × Glycerol + 26.350 × NH4OH + 3.6293 × Time -0.1856 × 300
Glycerol × NH4OH + 0.0008 × Glycerol × Time + 0.0347 ×NH4OH × Time + 0.0012 × Glycerol2 -301
12.061 × NH4OH2 - 0.0286 × Time2 (2)
302
303
The sign of the coefficient of each term indicates the influence of this term on the response, For 304
instance, from equation (2) it can be observed that NH4OH has a positive effect on lipid
305
production (coefficient: + 26.34). Besides, lipid production is very influenced by the 306
fermentation time (+ 3.62), while glycerol concentration has a very low impact (0.05). 307
RSC
Advances
Accepted
Manuscript
16
3.2 Identifying the best culture conditions for higher lipid production
308
Under the optimum conditions, glycerol concentration was fixed to 89 g/L and ammonium 309
hydroxide to 0.54 g/L during 66 h, the biomass and lipid content were 25.0 ± 1.5 g/L and 310
52.7 ± 1.2% (w/w of dry biomass), which was increased by 64% and 20% compared to shake 311
flask under no controlled conditions (9.3 ± 1.1 g/L and 43.5 ± 0.8 (% w/w of dry biomass). The 312
observed lipid production was 52.7 ± 1.2 (% w/w of dry biomass), agreeing well with the 313
predicted values 53.1% (w/w of dry biomass), indicating that the model was valid. Table 5 314
presented the reported yields of lipid production in many Yarrowia species. Herein, the 315
selected strain presented as a potential candidate for lipid production in the presence of crude 316
glycerol in terms of tolerating higher glycerol concentration up to 100 g/L compared to other 317
oleaginous strains where higher concentration is the threshold. For instance, Meesters et al. 318
(1996) observed that, in Cryptococcus curvatus, cell growth was restricted during lipid 319
accumulation when glycerol concentrations were higher than 64 g/L and the optimum of 320
glycerol was fixed to be 16 g/L with a maximum specific growth rate of 0.43 h-1. 54 321
Accordingly, higher glycerol above 60 g/L is responsible to induce higher osmotic pressure 322
which could inhibit the oxygen uptake or create high osmotic pressure sufficient to inhibit 323
culture growth in other strains. 13, 28, 54 324
However, recent study of Papanikolaou et al. (2008) has demonstrated that Y. lipolytica ACA-DC 325
50109 was tolerating higher concentration of glycerol up to 164 g/L with a maximum biomass 326
concentration of 7.4 g/L, with slight inhibition of the microbial growth was observed and the 327
maximum specific growth rate of around 0.16 h-1. 18 More often, Rymowicz et al. (2006) have
328
RSC
Advances
Accepted
Manuscript
17
found that Y. lipolytica mutants can be cultivated in the presence of raw glycerol at extremely 329
high concentrations (i.e. 200 g/L) and can achieve efficient cell growth ranging from 16.5– 330
26.5 g/L. 55 These observations confirmed that glycerol tolerance using oleaginous 331
microorganisms feature is strain dependant, andthe concentration of carbon source should be 332
adjusted accordingly to produce higher yields of CA and SCO. Moreover, Karamerou et al. 333
(2016) have proved that higher concentrations of glycerol had neither a positive nor a negative 334
effect on growth of Rhodotorula glutinis and the microorganism could sustain higher glycerol 335
concentrations up to 150 g/L, meanwhile, around 60 g/L of crude glycerol was easily assimilated 336
by the cells and was required to obtain around 29.8 % (w/w) of dry biomass, however, lower 337
glycerol concentration of 30 g/L favored effective cell growth 5.28 g/L. 56 Thus, higher glycerol 338
concentrations induced the accumulation of lipids by supressing cellular growth. 339
Taken together, the inhibition affected generally the glycerol conversion rate (Table 3), so that 340
higher the initial crude glycerol, lower the conversion, which was also confirmed by Tchaerou et 341
al. (2015), who deduced that high initial crude glycerol concentration (180 g/L) led to lower 342
glycerol conversion in Rhodosporidium toruloides. However, the decrease in growth resulted in 343
oil production (54% w/w of dry biomass compared to 40% (w/w) at 120 g/L). 344
Moreover, the analysis of nitrogen concentration showed that ammonium units start to deplete 345
after 16 h (Figure 3). Initial nitrogen concentration was around 600 mg/L and after 16 h, 346
remaining concentration was constant (70-100 mg/L) during entire fermentation. This limitation 347
of nitrogen in the media will trigger the pathway towards lipid biosynthesis, In fact, yeast 348
required nitrogen which is furnished by ammonium hydroxide during the growth phase, in 349
contrast to lipogenic phase. Nitrogen at 0.014 g/L has been found to be the critical 350
RSC
Advances
Accepted
Manuscript
18
concentration reported by Cescut (2009) to enhance lipid synthesis. 42 In this study, limiting 351
concentrations of nitrogen in around 70 mg/L into the medium lead to the induction of lipid 352
accumulation. 353
Thus, the reduction of ammonium concentration activated the ATP citrate lyase enzyme, so 354
that nitrogen limitation could activate diacylglycerol acyltransferase, which converted acyl-CoA 355
to triglyceride (TAG) 57 and this point was noted to be a separating phase between growth and 356
lipogenic phase. Lipid concentration started at this stage with a concomitant increase of 357
biomass concentration. Maximum specific growth rate was around 0.15 h-1 during the first 358
stage of growth 12 h. Thus, to distinguish between both phases, the calculation of growth 359
parameters was required and the analysis of nitrogen concentration was analyzed. Nitrogen 360
source started to deplete from 16 h, afterwards, the nitrogen concentration was almost 361
constant along the fermentation. 362
Besides, transition between growth phase and citric acid production is accompanied by 363
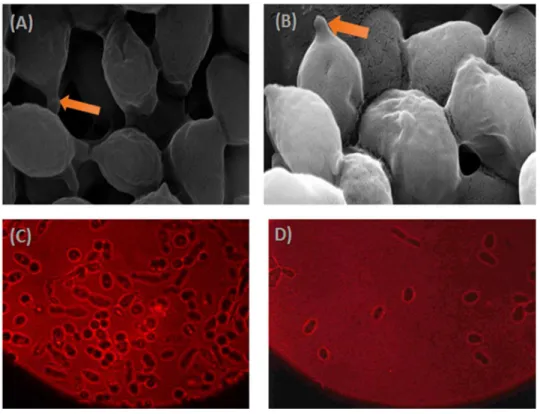
morphological changes. In the first stage of growth phase, Nile red lipid staining revealed that 364
lipid bodies are small and make up very little of the intracellular space at 12 h post-inoculation 365
when the cells are presumably still growing exponentially (Figure 2 D). 366
In contrast, in the lipid accumulation stage, large lipid droplets are distinguished by 48h of 367
growth, and cells appear elongated and grow as pseudo-filaments and cells are generally 368
swollen and continue to sprout throughout the time course (Figure 2 A, B, C). Besides, the 369
apparition of bud scars after nitrogen depletion, on both poles confirm the accumulation stage 370
of lipids droplets (Figure 2). Thus, mycelial transition was indicative of lipogenic phase and was 371
RSC
Advances
Accepted
Manuscript
19
more pronounced during the oxygen limitation. The cell size was notably affected by the 372
different percentage of accumulated lipids among lipogenic and CA production phase. In fact, 373
different conditions were reported to induce the dimorphism transition of yeast to mycelium 374
during lipid accumulation phase. In fact, Zinjarde et al. (1998), showed that micro aerobic 375
conditions were among the reasons of dimorphism in Yarrowia species. 58 Besides, genetic 376
modifications, nature of culture media and presence of specific compounds, such as N-377
acetylglucosamine, or bovine serum albumin (BSA) are reported to enhance efficiently the 378
transition phenomena. 59-60 Chávez et al. (2009) has reported that the dimorphic transition 379
event is related to the activation of protein kinase signaling pathway and other signaling 380
transduction mechanisms specific for some oleaginous strains. 61 In fact, Zinjarde et al. (1998) 381
suggested that the dimorphism transition is strain specific and depends ultimately on the 382
nature of carbon source and the microenvironment conditions (i.e. lower dissolved oxygen 383
concentration). 58 384
The practical outcome of the present study is that a saturation rate of dissolved oxygen 30% is 385
suitable to enhance the morphogenesis changes during growth and lipogenic phase and a 386
control of mechanical agitation during lipogenic and CA production should be monitored to 387
avoid mycelial cells disruption and eventual drop in biomass concentration in the bioreactor. 388
Most of the accumulated lipids between 0-16 h corresponded to catalytic biomass and lipids 389
corresponds to phospholipids and sterols, components of cell wall of yeasts. The glycerol was 390
used for biomass accumulation and the yield of glycerol conversion to biomass was high 391
compared to lipogenic phase (YX/S= 0.47 ± 0.10 and YP/S=0.08 ± 0.02). Around 4.7 ± 0.5 g/L of
392
lipid concentration was observed with a lipid content of 25.0% (w/w) of dry weight at 36 h 393
RSC
Advances
Accepted
Manuscript
20
(Figure 3). The analysis of metabolites in the supernatant showed that many organic acids were 394
produced (pyruvic acid, ketoglutaric acid, acetic acid) but in small traces and the concentration 395
does not exceed 2.0 ± 0.1 g/L. Moreover, citric acid, a non-growth-associated metabolite, was 396
secreted in lower concentration (4.0 ± 0.8 g/L) and was constant during time course. A 397
concomitant production of citric acid is related to the nitrogen exhaustion which also is defined 398
to trigger citric acid as well as SCO. 62-63 399
The simultaneous production of SCO and CA permits to classify our isolate as typical 400
"oleaginous" feature, comparable to other Yarrowia species reported by Tsisgie et al. (2011) 401
and Fontanille et al. (2012) 64-65, respectively, where lipid accumulation takes place while 402
glycerol was available in the media and can be used as carbon source. Besides, lower 403
concentration of citrate was reported and this can be explained as a consequence of 404
intracellular nitrogen limitation in yeast overflow metabolism. It does not start until nitrogen in 405
the medium is exhausted, the growth has mainly ceased and intracellular nitrogen decreased. It 406
is possible that nitrogen limitation somehow interrupts the TCA cycle by decreasing the activity 407
of some enzymes, leading to citrate secretion. 62 408
There are also data on the importance of nitrogen limitation in Candida oleophila ATCC 20177 409
growth for CA production; whereby the optimum [NH4+] concentration was found to be
410
1.2 mg/g. 62 411
Although Y. lipolytica is known to produce CA and the concentration reached around 154 g/L 66, 412
still in this study, the concentration remained stable which was favoured possibly by 413
maintenance of pH during fermentation pH = 6.5. These results are in accordance with 414
RSC
Advances
Accepted
Manuscript
21
Kamzolova et al. (2011), who reported that a pH around 4.5–6.0 was required to enhance CA 415
production (6.10–6.17 g/L) in the presence of crude glycerol. 10 Accordingly, CA production has 416
a direct relation to pH changes, however, Crolla and Kennedy (2004) suggested that pH showed 417
no direct effect on the mechanism of citric acid synthesis, but influenced the permeability of 418
cell membranes to both substrate and products. 67 419
Taken together, CA production in SM7 is not surprising since lipid synthesis and intensive CA 420
production are two competitive processes for acetyl-CoA (i.e. precursor of TAG accumulation) 421
and both phenomena are triggered by nitrogen depletion. Moreover, the lower CA 422
concentrations can be related to the fact that SM7 may selectively consume the CA produced 423
during lipogenic phase as carbon source to enhance TAG accumulation. 63 424
Herein, the majority of the glycerol was converted into SCO in 60 h and the yield of lipid 425
productivity was around 0.20 g/L/h. Thus, the difference in physiological behaviour during 426
lipogenic phase and CA is strain dependent and Yarrowia species did not exhibit the same 427
behaviour. In this regard, Dobrowolski et al. (2016) observed that during lipogenic phase in Y. 428
lipolytica A101, carbon metabolism is shifted towards lipid accumulation until a threshold is 429
achieved, after which excess carbon is excreted as citric acid in which lipid is stored. However, 430
afterwards, lipid started to degrade and CA production occurred. 68 In contrast, Makri et al. 431
(2010) have reported that some of the Yarrowia species are termed as atypical "oleaginous" 432
feature, in which, lipid is stored after nitrogen exhaustion, that afterwards is being degraded 433
while simultaneously significant quantities of sugar or glycerol remain unconsumed in the 434
medium and in parallel, citric acid production occurred. 31 435
RSC
Advances
Accepted
Manuscript
22
Herein, Y. lipolytica SM7 is belonging to typical "oleaginous" feature, in which nitrogen 436
exhaustion triggered the lipid synthesis and storage while lower quantities of citric acid (4 g/L) 437
and other low-molecular weight metabolites are produced (2 g/L). Hence, Y. lipolytica SM7 is 438
very closer to Yarrowia species reported by Fontanille et al. (2012) where SCO occurs after 439
nitrogen exhaustion and CA is secreted into the medium 61, without cellular lipid degradation 440
occurring. 69 441
To further elaborate on the physiological behaviour of SM7 in the presence of crude glycerol, 442
extended fermentation time has been proposed to confirm the choice of operational 443
parameters tested along fermentation time (36-72 h) and to confirm the oleaginous feature of 444
selected strain. Extended time of the process up to 100 h led to a decrease in biomass, lipid 445
quantity and lipid content (24.0 ± 2.1 g/L, 7.3 ± 1.3 g/L and 44.1 ± 0.9% (w/w of dry biomass) 446
respectively and CA production increased gradually after increasing fermentation time and 447
reached around 14.7 ± 2.3 g/L of CA in 100 h. These results agree with the observation of Makri 448
et al. (2010) who noted that CA increased progressively when CA production phase coincided 449
with the lipid turnover phase. 31 450
Besides, Bellou et al. (2016) observed that not only nitrogen depletion was required for CA 451
production, but Y. lipolytica needs double limited media (in both nitrogen and magnesium) in 452
the presence of crude glycerol to achieve both lipid and CA in significant quantities, Y. lipolytica 453
was cultivated in continuous cultures (D = 0.028 h-1) in media containing glycerol around 454
86.9 ± 8.5 g/L as carbon source and double limited in both magnesium and nitrogen, lipid 455
accumulation was equal to 24.7 ± 1.3% (w/w of dry weight). 17 In the present study, magnesium 456
was not limited, however it was provided at lower concentration sufficient to induce the lipid 457
RSC
Advances
Accepted
Manuscript
23
accumulation, moreover, during sterilization of medium, minerals can precipitate and become 458
thereafter unavailable for yeast cells. 70 All of these observations strengthened the stimulatory 459
effect of limited nitrogen and magnesium to induce a lipid content of 52% (w/w) of dry weight. 460
Additionally, Bellou et al. (2016) have noted that higher CA amount of 9.9 ± 0.5 g/L was favored 461
in higher glycerol concentration, however, the amount was reduced to 6.6 ± 0.3 g/L, in media 462
containing glycerol at lower concentrations (i.e. 53.1 ± 2.4 g/L) and was totally absent in the 463
presence of glucose even at higher concentration, 101 g/L and double limited media. 17 Similar 464
findings were reported by Rywinska et al. (2010) concluded that CA synthesis was highly 465
favored in the presence of glycerol instead of glucose 71, which confirmed the potential of crude 466
glycerol to enhance concomitant and concurrent production of lipid and CA. 467
These observations were in agreement with current study since CA was decreased from 468
12.5 ± 2.5 to 3.8 ± 0.9 g/L while decreasing glycerol concentration from 100 to 75 g/L (Table 3). 469
This behaviour was found to be a unique feature of Y. lipolytica compared to other oleaginous 470
microorganisms reported in the literature. Conventionally, the oleaginous organisms 471
accumulate reserve lipid under nitrogen depletion and degrade it under carbon starvation 472
conditions. 15, 53, 63 During transition from lipogenic to CA production phase, significant 473
quantities of the stored lipid were degraded and converted into CA. 474
During fermentation, air flow rate was kept constant at 2.5 L/min. Agitation rate was varied 475
during fermentation in order to keep the DO above 30% saturation. 476
During first growth phase from 0-18 h, higher agitation from 250 to 500 rpm was kept to 477
maintain a high dissolved oxygen of 60% and aeration rate of 3.5 L/min. When DO reached 60% 478
RSC
Advances
Accepted
Manuscript
24
of saturation, the mixing was reduced to 400-350 rpm and then the aeration was reduced to 479
2.5 L/min in order to maintain the DO at about 30% of saturation. The values of oxygen 480
utilization rate (OUR), oxygen transfer rate (OTR) and oxygen transfer coefficient (KLa) is
481
presented in Figure 4. Experiments showed that OUR increased slightly between 24 to 60 h. 482
This increase was accompanied with an increase of KLa value between 60-84 h-1. This value was
483
maintained approximatively in the range due to the variation of agitation rate. A saturation 484
level of 30% of dissolved oxygen was based on previous reported works. For example, Zhao et 485
al. (2010) maintained the dissolved oxygen at 40% of air saturation and achieved around 56.5% 486
(w/w) of lipid production from Rhodosporidium toruloides Y4 in the presence of Jerusalem 487
artichoke as carbon substrates. 72 Besides, Polburee et al. (2016) have fixed a KLa value of
488
129 h−1 to obtain around 63.8% (w/w of dry biomass) of lipid content with a lipid concentration 489
of 8.99 g/L during the cultivation of Rhodosporidium fluviale DMKU-RK253 in crude glycerol. 37 490
Moreover, an optimum of 88.5 h-1 was required to maintain high lipid production of 491
Schizochytrium sp. 73 In summary, the two-stage cultivation with a dissolved oxygen shift, 492
developed in this study could enhance lipid synthesis. In the first stage, when nitrogen present 493
in the cultured medium and KLa around 48-52 h-1, there was high biomass yield up to 0.47 g/g
494
glycerol with only low lipid yield of 0.08 g/g. Then, the high lipid yield was observed when the 495
dissolved oxygen decreased from 60% to 30% in the second stage (i.e. lipogenic phase). The 496
highest lipid yield of 0.16 g/g glycerol was observed during 66 h. Thus, Yarrowia responds to 497
nutrient limitation in the manner typical of oleaginous yeasts, which accumulate intracellular 498
lipids during a stationary phase. This strategy also supported high levels of biomass and lipid 499
RSC
Advances
Accepted
Manuscript
25
concentration when compared with the cultivation of Yarrowia species in crude glycerol media 500
Table 5. 501
3.3 Lipid analysis and fatty acid composition
502
Analysis of the fatty acid composition of SCOs produced by Y. lipolytica varied as a function of 503
fermentation time aligining with studies of Papanikolaou et al. (2013), who confirmed that fatty 504
acids changed as a function of the glycerol concentration employed and the culture time. 77 In 505
the present study, at crude glycerol concentration of 89 g/L, oleic acid (Δ9C18:1) was detected at 506
higher concentrations ranging from 39.2% to 43.5% during growth and lipogenic phase, 507
respectively. Similarly, Papanikolaou et al. (2013) found that oleic acid (Δ9C18:1) was around 508
47.1 and 59.7% for wild-type Yarrowia lipolytica (W29) and genetically engineered strain 509
(JMY1203) respectively, in the presence of 90 g/L of glycerol concentration, during the late 510
exponential phase and the early stationary phase (60–90 h) 77, corresponding to the lipogenic 511
phase (36-66 h) in the current study. Furthermore, the predominance of (Δ9C18:1) was in 512
accordance with data reported by André et al. (2009) and Makri et al. (2010), in the presence of 513
crude glycerol. Oleic acid was produced not only in the presence of crude glycerol as carbon 514
source, but also in the presence of hydrophobic substrates, for instance, when Y. lipolytica was 515
grown on rapeseed oil, oleic (Δ9C18:1) and linoleic (Δ9,12 C18:2) acids, were detected at higher 516
concentration of 61.9 and 29.2% of the total fatty acids, respectively. 11 Herein, the analysis of 517
fatty acid profile between different phases is presented in Table 6, which revealed significant 518
changes along time course. Myristic (C14:0) 8.0%, palmitic (C16:0) 13.2%, stearic (C18:0) 9.68%, 519
oleic (Δ9 C18:1) 39.2%, linoleic (Δ9,12 C18:2) 27.0% were the major fatty acids detected at an early 520
growth stage before nitrogen depletion. Moreover, the fatty acid profile of the cells did not 521
RSC
Advances
Accepted
Manuscript
26
change significantly upon entry into the nitrogen limitation phase (between 6 and 16 h). For 522
example, a significant increase of oleic (Δ9C18:1) content from 39.0% to 43.5%, C16:0 content 523
from 13.2 to 14.4%. Moreover, a smaller decrease of linoleic (Δ9,12 C18:2) from 27.0 to 17.5% is 524
observed with a small variation of strearic acid content (C18:0). These observations confirmed 525
that the composition is phase- dependent and a fatty acid selectivity towards more unsaturated 526
fatty acids is noted. The mainly produced fatty acids were C16 and C18 long-chain fatty acids, as 527
do other oleaginous yeasts. 31, 78 Another observation to be concluded from this observation is 528
the high fatty acid desaturase activity during yeast cultivation which is reflected by higher ratio 529
of C18:1/C18:0 which is > 1. The higher ratio, higher activity of D9-desaturase is observed, 530
especially in the lipid production phase which was also confirmed by Kamzolova et al. (2011). 10 531
Although Yarrowia showed good yields of unsaturated fatty acids, it exhibited very low content 532
of the myristic acid (C14:0) and other fatty acids, such as arachidic acid (C20:0), cis-11eicosanoic 533
acid (C20:1) lignoceric acid (C24:0). Nevertheless, these produced fatty acids can constitute 534
perfect precursors for the synthesis of 2nd generation biodiesel. 79-81 535 536
RSC
Advances
Accepted
Manuscript
27 4 Conclusion
537
Y. lipolytica is a good candidate for glycerol consumption and lipid production. Single cell oil 538
production is comparable to some of the highest in the literature for microorganisms growing 539
on glycerol. Despite large reports of this conventional yeast, this is the first report to deal with 540
the conversion of this residue to SCO with in-depth analysis of metabolites and growth 541
parameters at fermenter scale. Furthermore, when a two-stage cultivation strategy using 542
dissolved oxygen shift cultivation was developed, the highest biomass, lipid quantity and lipid 543
content of 25.80 ± 1.5 g/L, 13.6 ± 0.8 g/L, and 52.7 ± 1.2% (w/w of dry biomass), respectively, 544
were obtained. This two-stage cultivation strategy shows potential for application in industrial 545
processes to achieve high lipid concentration, and the fatty acid composition obtained by this 546
strain show it is favorable for use as the feedstock for biodiesel manufacture. Finally, the actual 547
optimal values of ammonium hydroxide amounts and concentration of crude glycerol and 548
fermentation time should be further studied in response to other operational factors. 549
550
Acknowledgments 551
Authors would like to acknowledge the Natural Sciences and Engineering Research Council of 552
Canada (grant A4984, Strategic grant 412994 – 11, Canada Research Chair) for financial support. 553
554
RSC
Advances
Accepted
Manuscript
28 Figure Captions List
555
556
Fig. 1 Response surface plots showing binary interaction of different variables. The 557
interaction between (A) NH4OH concentration and glycerol concentration, (B)
558
glycerol concentration and fermentation time, (C) fermentation time and glycerol 559
concentration 560
Fig. 2 Lipid accumulation of Y. lipolytica SM7 over the course of fermentation time. 561
Arrowhead denotes typical bud scarring, (A) and (C) corresponds to the 562
accumulation stage, (B) and (D) corresponds to an early depletion stage 563
Fig. 3 Time course of cell growth and lipid accumulation with Y. lipolytica. Culture was 564
performed in the original optimized medium on 89 g crude glycerol/L, 565
0.54 g NH4OH/L, pH = 6.5 ± 0.3, Temperature = 28 ± 1°C
566
Fig. 4 Variation of KLa, OUR and OTR in 5-L fermenter. Culture was performed in the
567
optimized medium on 89 g crude glycerol/L, 0.54 g NH4OH/L, pH = 6.5 ± 0.3,
568 Temperature = 28 ± 1°C 569 570 571
RSC
Advances
Accepted
Manuscript
29 References
572
1. G. Vicente, M. Martinez and J. Aracil, Bioresour. Technol., 2004, 92, 297–305. 573
2. G. Antolin, F. V. Tinaut, Y. Briceno, V. Castano, C. Perez and A. I. Ramirez, Bioresour. 574
Technol., 2002, 83, 111-114. 575
3. B. J. Kerr, W. A. Dozier and K. Bregendahl, Proceedings of the 23rd Annual Carolina 576
Swine Nutrition Conference, Raleigh, NC, 2007, 6-18. 577
4. V. K. Garlapati, U. Shankar and A. Budhiraja, Biotechnol. Rep., 2016, 9, 9-14. 578
5. L. Rodolfi, G. C. Zittelli, N. Bassi, G. Padovani, N. Biondi, G. Bonini and M. R. Tredici, 579
Biotechnol. Bioeng., 2009, 102, 100-112. 580
6. S. Magdouli, S. Yan, R. D. Tyagi and R. Y. Surampalli, Crit. Rev. Environ. Sci. Technol., 581
2014, 44, 416-453. 582
7. S. Papanikolaou and G. Aggelis, Lipid. Technol., 2009, 21, 83-87. 583
8. J. D. Rivaldi, B. F. Sarrouh and S. S. d. Silva, In Current Research Topics in Applied 584
Microbiology and Microbial Biotechnology ed. Mendez-Vilas, A. pp. 429-433. Madrid: 585
World Scientific Publishing Co. Formatex Research Center, 2009. 586
9. A. Abghari and S. Chen, Front. Energy. Res., 2014, 2, 21. 587
10. S. V. Kamzolova, A. R. Fatykhova, E. G. Dedyukhina, S. G. Anastassiadis, N. P. 588
Golovchenko and I. G. Morgunov, Food. Technol. Biotech., 2011, 49, 65-74. 589
RSC
Advances
Accepted
Manuscript
30
11. S.V. Kamzolova, E. G. Dedyukhina, V. A. Samoilenko, J. N. Lunina, I. F. Puntus, R. K. 590
Allayarov, M. N. Chiglintseva, A. A. Mironov and I. G. Morgunov, Appl. Microbiol. 591
Biotechnol., 2013, 97, 9133-9144. 592
12. A. P. Abreu, B. Fernandes, A. A. Vicente, J. Teixeira and G. Dragone, Bioresour. Technol., 593
2012, 118, 61-66. 594
13. Y. Liang, N. Sarkany, Y. Cui, J. Yesuf, J. Trushenski and J. W. Blackburn, Bioresour. 595
Technol., 2010, 101, 3623-3627. 596
14. N. Bati, E. G. Hammond and B. A. Glatz, J. Am. Oil. Chem. Soc., 1984, 61, 1743-1746. 597
15. S. Papanikolaou, I. Chevalot, M. Galiotou-Panayotou, M. Komaitis, Marc I and G. Aggelis, 598
Electron. J. Biotechnol., 2007, 10, 425-435. 599
16. J. Blazeck, A. Hill, L. Liu, R. Knight, J. Miller and A. Pan, Nat. Commun., 2014, 5, 3131. 600
17. S. Bellou, I.-E. Triantaphyllidou, P. Mizerakis and G. Aggelis, J. Biotechnol., 2016, 234, 601
116-126. 602
18. S. Papanikolaou, S. Fakas, M. Fick, I. Chevalot, M. Galiotou-Panayotou, M. Komaitis, I. 603
Marc and G. Aggelis, Biomass Bioenergy, 2008, 32, 60-71. 604
19. G. Barth and C. Gaillardin, Yarrowia lipolytica, In: Wolf K (ed) Nonconventional yeasts in 605
biotechnology. Springer-Verlag, Berlin, Heidelberg, New York, 1996. 606
20. F. A. G. Gonçalves, G. Colen and J. A. Takahashi, Scientific. World. J., 2014, 2014, 476207-607 476214. 608
RSC
Advances
Accepted
Manuscript
31
21. J. Lin, H. Shen, H. Tan, X. Zhao, S. Wu, C. Hu and Z. K. Zhao, J. Biotechnol., 2011, 152, 609
184-188. 610
22. C. E. Nakamura and G. M.Whited, Curr. Opin. Biotechnol., 2003, 14, 454-459. 611
23. P. Polburee, W. Yongmanitchai, N. Lertwattanasakul, T. Ohashi, K. Fujiyama and S. 612
Limtong, Fungal. Biol., 2015, 119, 1194-1204. 613
24. S. J. Sarma, S. K. Brar, E. B. Sydney, Y. L. Bihan, G. Buelna and C. R. Soccol, Int. J. 614
Hydrogen. Energ., 2012, 37, 6473-6490. 615
25. Z. Lazar, T. Dulermo, C. Neuvéglise, A. M. Crutz-Le Coq and J. M. Nicaud., Metab. Eng., 616
2014, 26, 89-99. 617
26. S. Joshi, C. Bharucha, S. Jha, S. Yadav, A. Nerurkar and A. J. Desa, Bioresour. Technol., 618
2008, 99, 195-199. 619
27. R. S. Makkar, S. Swaranjit and S. S. Cameotra, J. Am. Oil. Chem. Soc., 1997, 74, 887-889. 620
28. A. Beopoulos, Z. Mrozova, F. Thevenieau, M. T. Dall, I. Hapala and S. Papanikolaou, Appl. 621
Environ. Microbiol., 2008, 74, 7779-7789. 622
29. P. A. E. P. Meesters, G. N. M. Huijberts and G. Eggink, App. Microbiol. Biotechnol., 1996, 623
45, 575-579. 624
30. S.S. Tchakouteu, O. Kalantzi, C. Gardeli, A.A. Koutinas, G. Aggelis and S. Papanikolaou, J. 625
Appl. Microbiol., 2015, 118, 911-927. 626
31. A. Makri, S. Fakas and G. Aggelis, Bioresour. Technol., 2010, 101, 2351-2358. 627
32. J. B. M. Rattray, A. Schibecl and D. K. Kidby, Bacteriol. Rev., 1975, 39, 197-231. 628
RSC
Advances
Accepted
Manuscript
32
33. R. S. Moreten, Physiology of lipid accumulation yeast, In: Moreton RS, editor. Single cell 629
oil. London: Longman, 1988, 1-32. 630
34. J. Folch, M. Lees and G. H. S. Stanley, J. Biolog. Chem., 1957, 226, 497-509. 631
35. R. Halim, B. Gladman, M. K. Danquah and P. A. Webley, Bioresour. Technol., 2011, 102, 632
178-185. 633
36. G. Annadurai, S. M. Balan and T. Murugesan, Bioprocess. Eng., 1999, 21, 415-421. 634
37. P. Polburee, W. Yongmanitchai, K. Honda, T. Ohashi, T. Yoshida, K. Fujiyama and S. 635
Limtong, Biocheml. Eng. J., 2016, 112, 208-218. 636
38. M. Lipp and E. Anklam, Food. Chem., 1998, 62, 73-97. 637
39. S. Papanikolaou, and G. Aggelis, Eur. J. Lipid. Sci. Technol., 2010, 112, 639-654. 638
40. S. Papanikolaou, I. Chevalot, M. Komaitis, G. Aggelis and I. Marc, Antonie Van 639
Leeuwenhoek., 2001, 80, 215-224. 640
41. C. Ratledge, Yeasts, moulds, algae and bacteria as sources of lipids. In: Kamel, and 641
Kakuda (Ed.), Technological advances in improved and alternative sources of lipids, 642
Blackie academic and professional, London, 1994. 643
42. J. Cescut, Accumulation d’acylglycérols par des espèces levuriennes à usage carburant 644
aéronautique: physiologie et performances de procédés. Toulouse: Université de 645
Toulouse, 2009. 646
43. C. T. Evans and C. Ratledge, J. Gen. Microbiol., 1984, 130, 1705-1710. 647
RSC
Advances
Accepted
Manuscript
33
44. A. K. Azad, A. Yousuf, A. Ferdoush, M. M. Hasan, M. R. Karim and A. Jahan, J. Microb. 648
Biochem. Technol., 2014, S8:008. doi:10.4172/1948-5948.S8-008.
649
45. M. Hassan, P. J. Blanc, L. M. Granger, A. Pareilleux and G. Goma, Process. Biochem., 650
1996, 31, 355-361. 651
46. T. Braunwald, L. Schwemmlein, G. S. Hönninger, W. T. French, R. Hernandez, W. E. 652
Holmes and W. Claupein, Appl. Microbiol. Biotechnol., 2013, 97, 6581-6588. 653
47. N. G. Karanth and A. P. Satur, Bioprocess. Eng., 1991, 6, 241-248. 654
48. J. M. Ageitos, J. A. Vallejo, P. Veiga-Crespo and T. G. Villa, Appl. Microbiol. Biotechnol., 655
2001, 90, 1219-1227. 656
49. A. Yousuf, Waste. Manage., 2012, 32, 2061-2067. 657
50. C. Angerbauer, M. Siebenhofer, M. Mittelbach and G. M. Guebiz, Bioresour. Technol., 658
2008, 99, 3051-3056. 659
51. I. Kolouchová, O. Mátková, K. Sigler, J. Masák, T. Rezanka, Int. J. Anal. Chem., 2016, 660
2016, 9. 661
52. Y. H. Chang, K. S. Chang, C. F. Lee, C. L. Hsu, C.W. Huang and H. D. Jang, Biomass. 662
Bioenergy., 2015, 72, 95-103. 663
53. S. Papanikolaou, S. Sarantou, M. Komaitis and G. Aggelis, J. Appl. Microbiol., 2004, 97, 664
867-875. 665
54. P. A. E. P. Meesters, H. van de Wal, R. Weusthuis and G. Eggink, Biotechnol. Tech. 1996, 666 10, 277-282. 667
RSC
Advances
Accepted
Manuscript
34
55. W. Rymowicz, A. Rywin´ska, B. Z´arowska and P. Juszczyk , Chemical Papers 2006, 60, 668
391-394. 669
56. E. E. Karamerou, C. Theodoropoulos and C. Webb, Biomass Bioenergy, 2016, 89, 113– 670
122. 671
57. M. Takagi, K. Watanabe, K. Yamaberi and Y. Yoshida, Appl. Microbiol. Biotechnol., 2000, 672
54, 112-117. 673
58. S. S. Zinjarde, A. Pant and M. V. Deshpande, Mycol. Res., 1998, 102, 553-558. 674
59. J. Kim, S. A. Cheon, S. Park, Y. Song and J. Y. Kim, FEMS Microbiology, 2000, 190, 9-12. 675
60. F. M. Pérez-Campo and A. Dominguez, Curr. Microbiol., 2001, 43, 429-433. 676
61. J. A. Cervantes-Chávez, F. Kronberg, S. Passeron, J. Ruiz-Herrera, Fungal. Genet. Biol., 677
2009, 46, 390-399. 678
62. S. Anastassiadis, A. Aivasidis and C. Wandrey, Appl. Microbiol. Biotechnol., 2002, 60, 81-679
87. 680
63. C. Ratledge and J. P. Wynn, Adv. Appl. Microbiol., 2002, 51, 1-51. 681
64. P. Fontanille, V. Kumar, G. Christophe, R. Nouaille and C. Larroche, Bioresour. Technol., 682
2012, 114, 443-449. 683
65. Y. A. Tsigie, C. Y. Wanga, C. T. Truong and Y. H. Ju, Bioresour. Technol., 2011, 102, 9216-684
9222. 685
66. A. Rywińska and W. Rymowicz, J. Ind. Microbiol. Biotechnol., 2010, 37, 431-435. 686
67. A. Crolla and K. J. Kennedy, J. Bacteriol., 2004, 110, 73-84. 687