HAL Id: hal-01444055
https://hal.archives-ouvertes.fr/hal-01444055
Submitted on 28 Jul 2020
HAL is a multi-disciplinary open access
archive for the deposit and dissemination of
sci-entific research documents, whether they are
pub-lished or not. The documents may come from
teaching and research institutions in France or
abroad, or from public or private research centers.
L’archive ouverte pluridisciplinaire HAL, est
destinée au dépôt et à la diffusion de documents
scientifiques de niveau recherche, publiés ou non,
émanant des établissements d’enseignement et de
recherche français ou étrangers, des laboratoires
publics ou privés.
Distributed under a Creative Commons Attribution - NonCommercial| 4.0 International
License
Malta: a Holocene perspective
B. Gambin, Valérie Andrieu-Ponel, F. Médail, N. Marriner, O. Peyron, V.
Montade, T. Gambin, C. Morhange, D. Belkacem, M. Djamali
To cite this version:
B. Gambin, Valérie Andrieu-Ponel, F. Médail, N. Marriner, O. Peyron, et al.. 7300 years of vegetation
history and climate for NW Malta: a Holocene perspective. Climate of the Past, European Geosciences
Union (EGU), 2016, 12 (2), pp.273–297. �10.5194/cp-12-273-2016�. �hal-01444055�
www.clim-past.net/12/273/2016/ doi:10.5194/cp-12-273-2016
© Author(s) 2016. CC Attribution 3.0 License.
7300 years of vegetation history and climate for NW Malta:
a Holocene perspective
B. Gambin1,2, V. Andrieu-Ponel1, F. Médail1, N. Marriner3, O. Peyron3, V. Montade3,4, T. Gambin5, C. Morhange6,7,
D. Belkacem1, and M. Djamali1
1Institut Méditerranéen de Biodiversité et d’Ecologie marine et continentale (IMBE), Aix Marseille Université, CNRS, IRD, Avignon Université, Bâtiment Villemin, BP 80, 13545 Aix-en-Provence CEDEX 04, France 2Institute of Earth Systems, University of Malta, Msida, MSD 2080, Malta
3Institut des Sciences de l’Evolution de Montpellier, UM, CNRS, IRD EPHE, Avenue Eugène Bataillon, 34095 Montpellier CEDEX 05, France
4Ecole Pratique des Hautes Etudes, 4–14 rue Ferrus, 75014 Paris, France
5Department of Classics and Archaeology, University of Malta, Msida, MSD 2080, Malta 6CEREGE, Aix Marseille Université, CNRS, BP 80, 13545 Aix-en-Provence CEDEX 04, France 7Institut Universitaire de France, Paris, France
Correspondence to: B. Gambin (belinda.gambin@imbe.fr; belinda.gambin@um.edu.mt) Received: 28 August 2015 – Published in Clim. Past Discuss.: 30 September 2015 Revised: 18 January 2016 – Accepted: 18 January 2016 – Published: 15 February 2016
Abstract. This paper investigates the Holocene vegetation
dynamics for Burmarrad in Northwest Malta and provides a pollen-based quantitative palaeoclimatic reconstruction for this centrally located Mediterranean archipelago. The pollen record from this site provides new insight into the vegetation changes from 7280 to 1730 cal BP which correspond well with other regional records. The climate reconstruction for the area also provides strong correlation with southern (be-low 40◦N) Mediterranean sites. Our interpretation suggests an initially open landscape during the early Neolithic, sur-rounding a large palaeobay, developing into a dense Pistacia scrubland ca. 6700 cal BP. From about 4450 cal BP the land-scape once again becomes open, coinciding with the start of the Bronze Age on the archipelago. This period is concur-rent with increased climatic instability (between 4500 and 3700 cal BP) which is followed by a gradual decrease in sum-mer moisture availability in the late Holocene. During the early Roman occupation period (1972–1730 cal BP) the land-scape remains generally open with a moderate increase in Olea. This increase corresponds to archaeological evidence for olive oil production in the area, along with increases in cultivated crop taxa and associated ruderal species, as well as a rise in fire events. The Maltese archipelago provides
im-portant insight into vegetation, human impacts, and climatic changes in an island context during the Holocene.
1 Introduction
Interpreting the complex relationship between vegetation dy-namics, climate change, and anthropogenic activities dur-ing the Holocene is important for understanddur-ing past soci-eties and their environment (Weiner, 2010; Walsh, 2013). Palynology, the study of pollen and spores (e.g. Erdtman, 1943; Faegri and Iversen, 2000; Moore et al., 1991; Tra-verse, 2008), has been an important element in this inter-pretation and has been central to environmental reconstruc-tion since the early 20th century (MacDonald and Edwards, 1991). The analysis of pollen grains extracted from sediment cores from terrestrial and marine environments, as part of an interdisciplinary approach, provides quantitative data on the past changes in vegetation compositions (e.g. Behre, 1981; Giesecke et al., 2011; Sadori et al., 2013a), revealing valu-able palaeoecological information that can assist with cli-mate reconstructions (e.g. Bartlein et al., 2011; Mauri et al., 2015). Over the past 25 years there has been a growing body of knowledge relating to Holocene vegetation changes
partic-ularly within the Mediterranean. This region is considered a hotspot of biodiversity (Médail and Quézel, 1999) as well as a climate change “hotspot” (Giorgi and Lionello, 2008). Re-cent research has highlighted possible anthropogenic influ-ences along with the, often hard to separate, climatic signal through palaeoenvironmental reconstruction, such as to the west (Carrión et al., 2007; Estiarte et al., 2008; López Sáez et al., 2002; Pantaléon-Cano et al., 2003), centrally (Bellini et al., 2009; Calò et al., 2012; Combourieu Nebout et al., 2013; Di Rita and Magri, 2012; Noti et al., 2009; Peyron et al., 2011; Sadori et al., 2013b; Tinner et al., 2009), as well as in eastern areas (Bottema and Sarpaki, 2003; Finkelstein and Langgut, 2014; Hajar et al., 2010; Jahns, 2005; Kaniewski et al., 2014; van Zeist et al., 2009).
Numerous studies have highlighted the climatic con-trast between the western versus eastern and northern ver-sus southern sides of the Mediterranean Basin during the Holocene (Brayshaw et al., 2011; Jalut et al., 2009; Magny et al., 2012; Roberts et al., 2011, Peyron et al., 2013). It is gen-erally considered that environmental change was primarily nature-dominated in the wetter early Holocene and human-dominated in the warmer, drier late Holocene (Berger and Guilaine, 2009), with the mid-Holocene (6–3 ka BP) remain-ing a “melange” (Roberts et al., 2011); therefore focus is of-ten placed on this mid-Holocene climatic transition (Collins et al., 2012; Fletcher et al., 2013; Mercuri et al., 2011; Pérez-Obiol et al., 2011; Vannière et al., 2011).
Within the Mediterranean, the centrally located Maltese archipelago (Fig. 1a) provides a key site to study these dynamics in an island context during the Holocene. How-ever, with no peat bogs or lake deposits, suitable sites for palaeovegetation data collection are very limited; notwith-standing this situation some recent research has been carried out on coastal areas (Carroll et al., 2012; Djamali et al., 2012; Fenech, 2007; Marriner et al., 2012).
The purpose of this study is to expand on the current knowledge of the Holocene vegetation dynamics on this strategically located archipelago, positioned almost midway between the western and eastern edges of the Mediterranean, through the study of a terrestrial core taken from Burmar-rad, the second largest flood plain, on the Maltese Islands (Fig. 1d). This will allow for:
a. completing the previous results from Burmarrad ob-tained by Djamali et al. (2012), that covered a shorter period during the early to mid-Holocene (7350– 5600 cal BP);
b. a new palaeovegetation reconstruction from 7280 to 1730 cal BP for NW Malta;
c. the first quantitative palaeoclimatic reconstruction for the Maltese islands.
It is hoped that the more interdisciplinary research con-ducted both within this archipelago and other Mediterranean
locations will provide more data to enable concise recon-structions of the fluctuating vegetation assemblages and cli-matic variations present over the Holocene. This information, in turn, might provide a better understanding of the various processes and factors affecting not only past but also present and future landscapes.
2 Setting
2.1 Location
The Maltese archipelago (latitude: 35◦4802800–36◦0500000N, longitude: 14◦1100400–14◦3403700E) is approximately 96 km from Sicily and 290 km from the coast of Libya. The land area is nearly 316 km2, comprising of a number of small low-lying islands, three of which are inhabited – Fig. 1b; Malta (245.7 km2), Gozo (67.1 km2), and Comino (2.8 km2) – with a few uninhabited islets being less than 0.1 km2in size (Cassar et al., 2008). The geology of the islands consists of five main types of sedimentary rocks: Upper Coralline Lime-stone, Greensand, Blue Clay, Globigerina LimeLime-stone, and Lower Coralline Limestone, deposited during the Oligocene and Miocene (Pedley et al., 2002). One of the most character-istic geomorphological features of the islands is the “wieden” (Chetcuti et al., 1992), a hybrid landform with a physical ap-pearance of a river valley but in process more like an arid region’s wadi (Anderson, 1997).
The archipelago’s vegetation, similar to other Mediter-ranean islands and coastal areas, is strongly affected by tense summer heat and low precipitation, as well as in-creasing anthropogenic activity in recent millennia (Grove and Rackham, 2001; Roberts, 2014). Presently, the three main semi-natural vegetation types are garrigue, steppe, and maquis (Table 1), while there are a few much smaller com-munities developed as woodlands, in freshwater and on rocky habitats, on sand dunes and in coastal wetlands; these smaller communities are significant due to the rare endemic species found within them (Schembri, 1997).
Current evidence for the archipelago establishes human occupation on the islands at about 7200 years ago, with the initial settlers originating from Sicily (Blouet, 2007). During the period covered by the BM2 core the islands have under-gone a succession of occupiers; during the Neolithic, Temple, and Bronze periods (Trump, 2002), as well as the Historical period with Phoenician, Punic, and Roman settlements (Bo-nanno, 2005).
2.2 Climate
The climate of the archipelago (Fig. 1c) is considered to be typically Mediterranean (Chetcuti et al., 1992), with mild, wet winters and hot, dry summers, while the spring and au-tumn seasons are short (Blondel et al., 2010). The annual pre-cipitation is 530 mm, with 70 % of this rainfall occurring be-tween October and March, though much is lost to
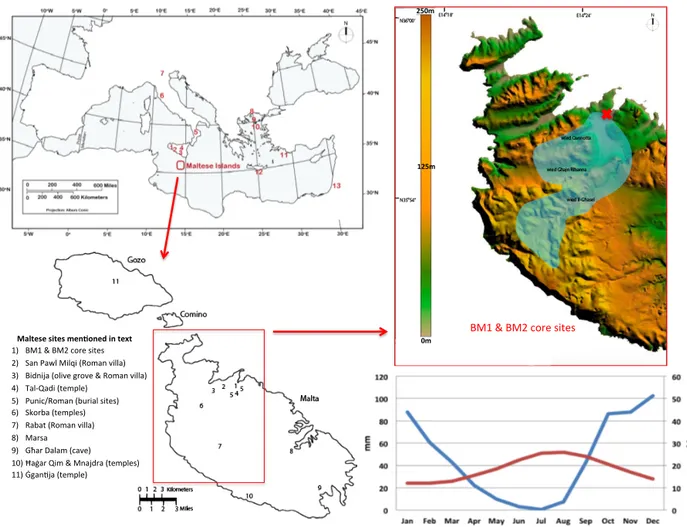
evapotran-Maltese'sites'men+oned'in'text' 1) BM1%&%BM2%core%sites% 2) San%Pawl%Milqi%(Roman%villa)% 3) Bidnija%(olive%grove%&%Roman%villa)% 4) Tal@Qadi%(temple)% 5) Punic/Roman%(burial%sites)% 6) Skorba%(temples)%% 7) Rabat%(Roman%villa)% 8) Marsa% 9) Għar%Dalam%(cave)% 10) Ħaġar%Qim%&%Mnajdra%(temples)% 11) ĠganSja%(temple)% 250m' BM1%&%BM2%core sites % 0m' 125m'
Figure 1.Study area. (a) Mediterranean region highlighting the Maltese Islands. Selected regional sites mentioned in text: 1: Lago Preola, 2:
Gorgo Basso, 3: Biviere di Gela, 4: Lago Pergusa, 5: Lago Trifoglietti, 6: Lago Accesa, 7: Lago Ledro, 8: Tenaghi P., 9: SL152, 10: MNB-3, 11: NS14, 12: HCM2-22, 13: Soreq Cave; base map source: Arizona Geographic Alliance; (b) Maltese Islands: key sites mentioned in text; (c) average annual temperature and rainfall, based on Galdies (2011) data for the 30-year climatic period 1961–1990; (d) the topography and catchment area (blue) of Burmarrad.
Table 1.Selection of plant taxa characteristic of the main Maltese vegetation communities (adapted from Schembri, 1997; Stevens et al.,
1995).
Vegetation community
selected main taxa
Garrigue Thymus capitatus, Erica multiflora, Euphorbia melitensis, Teucrium fruticans and Anthyllis hermanniae
Steppe Lygeum spartum (clay slopes) Hyparrhenia hirta, Andropogon distachyus and Brachypodium retusum.
Also Stipa capensis and Aegilops geniculata, Carlina involucrata, Notobasis syriaca, Galactites
tomentosa, Asphodelus aestivuus, and Urginea pancration
spiration (Anderson, 1997). The northwesterly wind (majjis-tral) is the most common wind direction for the islands, av-eraging about 20.7 % of the days annually (Galdies, 2011).
2.3 Burmarrad region
The Burmarrad area where the BM2 core was taken (Fig. 1d) is currently an agricultural plain with a number of settle-ments, along with patches of maquis, garrigue, and steppe along its edges, as well as one small remnant stand of indige-nous olive trees. Though hard to date, the latter are consid-ered to be up to 1200 years old (Grech, 2001). Terracing with rubble walls for agricultural purposes can also be found on the rocky slopes of the catchment area. The present agricul-tural plain is subject to seasonal flooding; however, before silting in, there is strong archaeological evidence to suggest that it was used as a natural anchorage up until at least Roman times (Gambin, 2005; Trump, 1972). The earliest evidence for occupation in this area is in the form of a prehistoric tomb at San Pawl Milqi dating to 6050–5750 BP (Locatelli, 2001). The fluctuating cultural changes since this time have influenced the widespread landscape transformation during the Holocene not only in this area, but also throughout the archipelago.
3 Methods
Through the Franco-Maltese ANR project PaleoMed (C. Morhange, leader), a number of cores have been taken from locations on the Maltese archipelago with the aim of probing the islands’ environmental history. A multi-disciplinary team has been investigating a number of bod-ies of evidence including sediments, charcoal, pollen, and shells. A mid-Holocene section of the BM1 sediment core has been examined (Djamali et al., 2012); while geoarchae-ological analysis of the Burmarrad area has been undertaken by Marriner et al. (2012).
3.1 Coring and Sampling
A percussion corer (diameter 10 cm) was used to extract the BM2 core. The 10 m long core was sampled at regular 5– 10 cm intervals, while the top 2 m was not considered due to proximity to the surface. The methodology used to define the sedimentary environments is based on high-resolution sedi-mentological and palaeoecological data (ostracods and ma-rine molluscs); the initial facies descriptions (such as colour and lithofacies) were conducted under standardized labora-tory conditions (see Marriner et al., 2012).
3.2 Laboratory Analysis
Pollen extraction was undertaken following the classic method described by Moore et al. (1991). Each of the 1 cm3 samples were chemically treated with 10 % HCl to
remove the carbonate fraction, 48 % HF to remove the sili-ciclastic fraction, and concentrated (37 %) HCl was used to remove the silicofluorides produced during HF treat-ment. Following these treatments, acetolysis was used to remove any organic material and to outline the pollen wall structure to aid identification. To calculate the pollen concentrations, a known amount of Lycopodium spore tablets were added to the samples prior to treatment. The pollen percentages are calculated using the pollen sum of all terrestrial pollen counted; it excludes Cyperaceae and other aquatic/hygrophilous species, NPPs (non-pollen paly-nomorphs), and undetermined/indeterminable grains.
A mean total count of at least 300 terrestrial pollen grains was used for each sample – this amount is considered suf-ficient to provide a fossil assemblage census (Benton and Harper, 2009). Pollen identification was undertaken using the IMBE’s pollen reference collection and the pollen atlases of Europe and North Africa (Reille, 1992, 1995, 1998) along with the pollen atlas of Central Europe (Beug, 2004). Cereal-type pollen was described as Poaceae > 45 µm with a mini-mum annulus diameter of 8–10 µm (following López-Merino et al., 2010).
NPPs were identified using a number of references: Cugny (2011), Mudie et al. (2011), Haas (1996), van Geel (1978), and Macphail and Stevenson (2004). Pollen per-centages were calculated in TILIA, while pollen percentage diagrams were created using TGview (Grimm, 2004/5). Fi-nal diagrams were redrawn and amended in Adobe Illustra-tor. The pollen diagram taxa have been grouped according to ecology and life form: trees and shrubs, herbs, aquatic and hygrophilous species, coprophilous associated species, and NPPs. Microcharcoals (woody not herbaceous particles) smaller than 10 µm were excluded from the count. The Ly-copodium spore tablets and sample weight were also used to estimate microcharcoal concentrations (Stockmarr, 1971).
This paper presents the results of pollen analysis carried out on 48 samples collected from the BM2 core between the depths 210 and 1000 cm. Some parts of the core did not pro-vide any palynological material to be represented in the dia-gram (in particular the section between 450 and 240 cm).
3.3 Pollen-based quantitative climate reconstruction
Use of only one method for pollen-based palaeoclimate re-constructions could reduce the robustness of the results ob-tained (Birks, 2011; Brewer et al., 2008), therefore a multi-method approach was utilized for the climatic reconstruction based on the BM2 data set. The chosen approach has been successfully used in studies throughout the Mediterranean area (Peyron et al., 2013; Sadori et al., 2013a). Three meth-ods were chosen: the modern analogue technique “MAT” which compares past assemblages with modern assemblages (Guiot, 1990); the weighted averaging “WA” method (Ter Braak and Van Dam, 1989); and the weighted average-partial least square technique “WAPLS” (Ter Braak and Juggins,
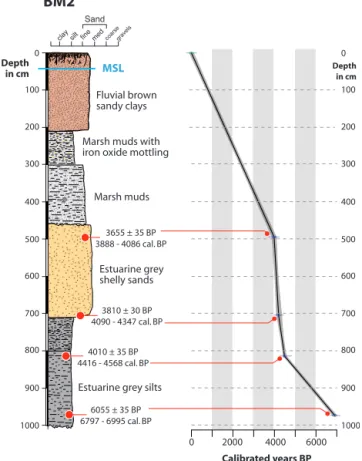
Table 2.Radiocarbon dates obtained from the Burmarrad BM2 core.
Depth Radiocarbon date Calibrated age at 2σ range Laboratory reference Material
500 cm 3655 ± 35 BP 3888–4086 cal BP Poz-42682 Wood Fragment
705 cm 3810 ± 30 BP 4090–4347 cal BP Poz-42443 Grain
820 cm 4010 ± 35 BP 4416–4568 cal BP Poz-42442 Charcoal
980 cm 6055 ± 35 BP 6797–6995 cal BP Poz-42444 Charcoal
Fluvial brown sandy clays
Marsh muds
Estuarine grey shelly sands Marsh muds with iron oxide mottling
Estuarine grey silts
Sand clay silt fine medcoarsegravels
MSL BM2 3655 ± 35 BP 3888 - 4086 cal. BP 3810 ± 30 BP 4090 - 4347 cal. BP 4010 ± 35 BP 4416 - 4568 cal. BP 6055 ± 35 BP 6797 - 6995 cal. BP 0 2000 4000 6000 Calibrated years BP 100 0 200 300 400 500 600 700 800 900 1000 100 0 200 300 400 500 600 700 800 900 1000 Depth in cm Depthin cm
Figure 2.BM2 sedimentary profile and age–depth model
interpo-lated curve.
1993). The MAT is the only one based on a comparison of past pollen assemblages to modern pollen assemblages, while the WA and WAPLS are transfer functions that require a statistical calibration between environmental variables and modern pollen assemblages; Peyron et al. (2013) provide a comprehensive outline of these three approaches. The cli-mate parameters esticli-mated from the Burmarrad core are the temperature of the coldest month (MTCO) and the seasonal precipitation. Calculations for the winter and summer pre-cipitations are based on the sum of the months: December, January, February and June, July, August respectively.
4 Results
4.1 Sediment and chronology
The BM2 core has been subdivided into five lithostrati-graphic zones (Fig. 2), recording a general transition from upper estuarine, through marine, to a marsh/fluvial environ-ment. The visual core description is as follows: the lower part of the sequence is predominately composed of grey silts (Unit 1a: 1000–800 cm) followed by slightly darker grey silts (Unit 1b: 800–710 cm) both deposited in an estuarine envi-ronment, grey shelly sands (Unit 2: 710–460 cm) deposited under marine conditions, marshy muds (Unit 3: 460–300 cm) and marshy muds with oxide mottling (Unit 4: 300–210 cm), and finally, at the upper part, brown sandy clays (Unit 5: 210– 0 cm). The two latter sedimentary units display different de-grees of pedogenesis. No pollen samples were taken from the top 200 cm surface section due to the considerable biologic and anthropogenic activity that this layer is regarded to have undergone.
Four radiocarbon dates, calibrated using IntCal09 and Ma-rine09 (Reimer et al., 2009) have been used for the BM2 core (Table 2). The samples used for the dating consisted of two charcoal pieces, one grain, and one wood fragment. An age model based on these four dates was constructed using the R-code Clam (Blaauw, 2010); this is obtained by repeated random sampling of the dates’ calibrated distributions to pro-duce a robust age–depth model through the sampled ages, displayed in the linear interpolation diagram (Fig. 2).
Results of the Accelerator Mass Spectrometry (AMS) dat-ing are provided in Fig. 2. The lowest part of the core is ra-diocarbon dated to approximately 7280 cal BP while the top corresponds to approximately 1730 cal BP. The interpolated curve is quite steep in the midsection of this diagram. This may be an indication of anthropogenic activity in this area causing accelerated runoff and rapid infill of the plain dur-ing this period (Gambin, 2005; Marriner et al., 2012). Al-though all chronology should be treated with caution, it is noted that there is good correlation between the BM1 (Dja-mali et al., 2012) and BM2 cores. Reworking processes in low-energy ria environments such as these tends to be low; furthermore to overcome reservoir issues we have dated char-coal and short-lived plant material. Our interpretations are based on a chronological timescale established according to four radiocarbon dates; we assume that sedimentation rate in the intervals between the dating points remains relatively
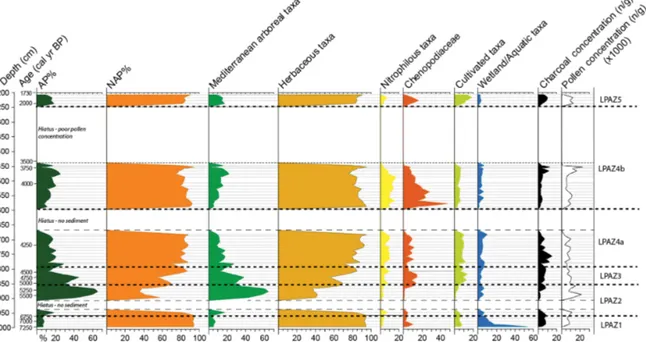
Figure 3.Burmarrad simplified pollen diagram: selected percentage curves and pollen concentration versus depth. Mediterranean arboreal taxa: Ephedra, Erica, Juniperus, Olea, Phillyrea, Pinus and Pistacia. Nitrophilous taxa: Rumex, Urtica and P. lanceolata-type. Cultiva-tion indicator taxa: including crops (Cerealia-type, Triticum-type) and some associated secondary indicator species (Brassicaceae,
Con-volvulus). The pollen percentages are calculated using the pollen sum of all terrestrial pollen counted; it excludes Cyperaceae and other
aquatic/hygrophilous species, NPPs (non-pollen palynomorphs), and undetermined/indeterminable grains. The microcharcoal concentration was calculated using the sample weight and number of Lycopodium spores observed (following Stockmarr, 1971).
constant; however, we do not exclude the possibility that in some depths, some changes in sedimentation rate may have occurred leading to slightly different ages for the observed environmental variations.
4.2 Pollen diagram
From the BM2 core only 48 of the 57 spectra are recorded in the pollen diagram due to poor pollen concentration (hiatus between depth 450 and 240 cm). Two other smaller hiatuses appear in the record due to core recovery issues (940–890 and 680–600 cm). The pollen concentration in the core gen-erally was poor; however, the preservation of the grains was, on the whole, satisfactory. There was sufficient diversity of taxa to reflect pollen contributions from a number of habitats, including wetland as well as a variety of dry ground environ-ments.
The pollen diagram provides percentages for all the terres-trial and aquatic pollen counted, as well as that of spores, microcharcoal, microforaminifera, and dinoflagellates; the pollen sum was calculated using terrestrial pollen totals only. No taxa were omitted from the pollen diagram. However, pollen productivity and dispersal levels (Hevly, 1981) and possible preservation variability (Havinga, 1971) have been considered (Figs. 3–6).
A total of 98 pollen and spore types were identified, in-cluding 17 arboreal pollen (AP) taxa and 56 non-arboreal
pollen (NAP) taxa, the latter comprising herbs and weed species. With regard to NPP type, 17 different taxa were identified (Fig. 6). Following Cushing (1967) the diagram has been divided into Local Pollen Assemblage Zones (LPAZ) – these five zones are based on principle terrestrial taxa changes.
4.2.1 LPAZ1 (1000–960 cm) Early Holocene: ca. 7280–6700 cal BP
The lower part of this zone (980 cm) is radiocarbon dated to 6055 ± 35 BP. AP taxa are very low (6 and 8 %) consist-ing of Quercus (deciduous and evergreen), Pistacia, and Er-ica arborea-type. NAP taxa are dominant, between 92 and 94 %, mostly composed of Cichorioideae, Poaceae, and As-teroideae, along with Chenopodiaceae, Convolvulus, Plan-tago, Cerealia-type. Microcharcoal was recorded at concen-tration levels start at 3.7, then fluctuate between 6.6 and 8.1. Microforaminifera range from 9.8 to 18.9 %, dinoflagellates, 50 to 14 %, and pollen of aquatic plants, at 3–6 %, the latter being at its highest percentage recorded throughout the five LPAZs. This zone dates to the early Neolithic, Ghar Dalam cultural phase.
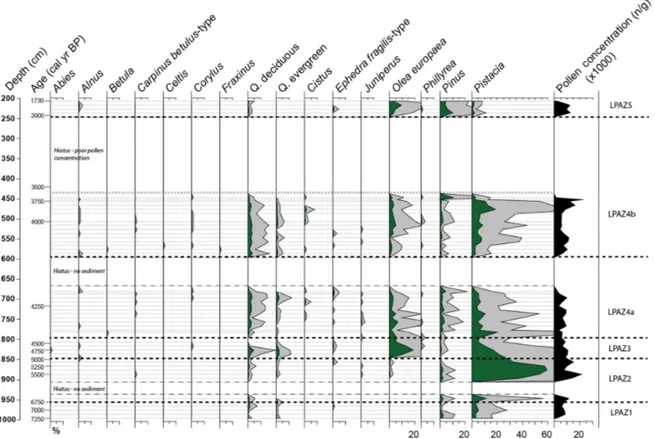
Figure 4.Burmarrad pollen percentage diagram versus depth: trees and shrubs. The pollen percentages are calculated using the pollen sum of all terrestrial pollen counted; it excludes Cyperaceae and other aquatic/hygrophilous species, NPPs, and undetermined/indeterminable grains.
Figure 5.Burmarrad pollen percentage diagram versus depth: herbaceous taxa. The pollen percentages are calculated using the pollen sum
of all terrestrial pollen counted; it excludes Cyperaceae and other aquatic/hygrophilous species, NPPs, and undetermined/indeterminable grains.
Figure 6.Burmarrad pollen percentage diagram versus depth: aquatic/wetland taxa and NPPs. The pollen percentages are calculated us-ing the pollen sum of all terrestrial pollen counted; it excludes Cyperaceae and other aquatic/hygrophilous species, NPPs, and undeter-mined/indeterminable grains. 68 00 $c al $B P$ 66 00 $c al $B P$ 64 00 $c al $B P$ 62 00 $c al $B P$ 60 00 $c al $B P$ 58 00 $c al $B P$ 56 00 $c al $B P$ 54 00 $c al $B P$ 52 00 $c al $B P$ 50 00 $c al $B P$ 48 00 $c al $B P$ 46 00 $c al $B P$ 44 00 $c al $B P$ 42 00 $c al $B P$ 40 00 $c al $B P$ 38 00 $c al $B P$ 36 00 $c al $B P$ 34 00 $c al $B P$ 32 00 $c al $B P$ 30 00 $c al $B P$ 28 00 $c al $B P$ 26 00 $c al $B P$ 24 00 $c al $B P$ 22 00 $c al $B P$ 20 00 $c al $B P$ 18 00 $c al $B P$ 16 00 $c al $B P$ 70 00 $c al $B P$
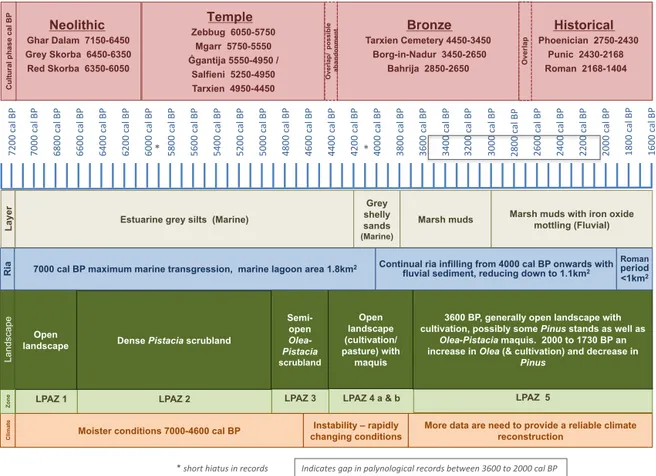
Estuarine grey silts (Marine)
Grey shelly sands
(Marine)
Marsh muds
LPAZ 1 LPAZ 2 LPAZ 3 LPAZ 4 a & b LPAZ 5
Marsh muds with iron oxide mottling (Fluvial) Neolithic Ghar Dalam 7150-6450 Grey Skorba 6450-6350 Red Skorba 6350-6050 Temple Zebbug 6050-5750 Mgarr 5750-5550 Ġgantija 5550-4950 / Salfieni 5250-4950 Tarxien 4950-4450 Bronze Tarxien Cemetery 4450-3450 Borg-in-Nadur 3450-2650 Bahrija 2850-2650 Historical Phoenician 2750-2430 Punic 2430-2168 Roman 2168-1404 Open
landscape Dense Pistacia scrubland
Semi-open
Olea-Pistacia
scrubland
3600 BP, generally open landscape with cultivation, possibly some Pinus stands as well as
Olea-Pistacia maquis. 2000 to 1730 BP an
increase in Olea (& cultivation) and decrease in
Pinus Overlap/ possible a b an d o n m en t Open landscape (cultivation/ pasture) with maquis Overlap
Moister conditions 7000-4600 cal BP changing conditions Instability – rapidly
7000 cal BP maximum marine transgression, marine lagoon area 1.8km2 Continual ria infilling from 4000 cal BP onwards with
fluvial sediment, reducing down to 1.1km2
Roman period <1km2 C lim ate Zone La nd sca pe Layer C u lt u ra l ph as e c al B P Ria 7200 $ cal $B P$
More data are need to provide a reliable climate reconstruction Indicates*gap*in*palynological*records*between*3600*to*2000*cal*BP* * short*hiatus*in*records**
$
*$ *$Figure 7.Synthesis of cultural phases, LPAZs (local pollen assemblage zones), sediment, vegetation dynamics, and climatic reconstruction:
4.2.2 LPAZ2 (960–850 cm) Early to mid-Holocene: ca. 6700–5000 cal BP
This zone is characterized by a very significant rise in AP taxa, increasing to a maximum of 65 % (880 cm). The major-ity of this AP is comprised of Pistacia pollen (almost 60 %). NAP taxa are much lower than the previous zone, gener-ally between 35 and 60 %. Cichorioideae, though beginning the zone at 21 %, dip to 7 % before rising to 18 %. Poaceae significantly decrease to around 1 %. With regard to NPPs, though present in very low percentages in LPAZ1 there is also some presence of Glomus, Sporormiella, and Delitschia, while Coniochaeta appears for the first time, peaking at 5 % (860 cm). Aquatics in this zone are slightly lower than in LPAZ1. Microcharcoal concentration decreases significantly after the transition to this zone ranging between 1.3 and 2.2 (the lowest level reached in the whole core sequence), then rising towards the end to 8.3, before decreasing slightly to 7.6. Dinoflagellates peak at the beginning of this zone at 40 % diminishing to only < 1 %, while microforaminifera peak in the middle of this zone at 28 % tapering off to 6 %. This zone covers both the Neolithic (end of Ghar Dalam, as well as Grey and Red Skorba) and Temple (Zebbug, Mgarr, ˙Ggantija and Salfieni) periods (Fig. 7).
4.2.3 LPAZ3 (850–800 cm) Mid-Holocene: ca. 5000–4438 cal BP
This zone is radiocarbon dated to 4010 ± 35 BP at 820 cm. AP vary between 13 and 45 %, while NAP taxa fluctuate be-tween 55 and 87 %. The transition to this zone is marked by the significant rise in Olea, peaking at 19 % (830 cm). Pista-cia, though relatively high at the beginning at 21 %, reaches a low of 6 % (810 cm). New AP taxa entering the record in-clude Betula and Phillyrea, while deciduous Quercus records a highest peak of the whole core sequence in this zone at 4 %. Brassicaceae peak at 11 % (its highest in the whole sequence) then decreases to 7 %. Pseudoschizaea has continued to in-crease from the previous zone, reaching 9 % by the end of LPAZ3, while Glomus rises almost in unison to 7 %. Aquat-ics are at their lowest for the whole sequence. The microchar-coal concentration level is fairly high, ranging between 3.5 and 8.3 %. The comparable cultural phase (Fig. 7) is the end of the Temple period (Tarxien phase).
4.2.4 LPAZ4a (800–685 cm) Mid- to Late Holocene: ca. 4438–4140 cal BP
The middle part of this sequence (720 cm) is radiocarbon dated to 3810 ± 35 BP. AP are in decline, ranging between 12 and 29 %, while NAP are high, fluctuating between 71 and 88 %. Aquatic taxa remain fairly similar in percentage to LPAZ3. The beginning of this zone is marked by the highest microcharcoal concentration recorded, 14.9 %. Olea, though still present, has diminished drastically to values of 1–5 % and Pistacia to between < 1 and 10 %. Of the NAP, Apiaceae
have increased up to 5 %, as have Asteroideae with a peak of 32 % (the highest recorded in the core) and Plantago-type pollen, with P. lanceolata-type reaching its highest level in the core, 10 %. Sporormiella peak in this zone at 32 %, as do Pseudoschizaea at 14 % and Glomus spp. at 15 %, the lat-ter again mirroring the Pseudoschizaea increase. The cal BP dates correspond to the end of the Temple period (Tarxien) and beginning of the Bronze Age (Tarxien Cemetery).
4.2.5 LPAZ4b (685–455 cm) Mid- to Late Holocene: ca. 4140–3682 cal BP
The middle part of this sequence (500 cm) is radiocarbon dated to 3655 ± 35 BP. AP are still relatively low, only rang-ing between 6 and 25 %, while NAP remain high: 75–95 % (highest recorded). Microcharcoal concentrations are gener-ally much lower, ranging between 2.2 and 5.1 (except for two peaks at 12.7 and 11.6 % towards the end). Olea, occurs be-tween < 1 and 4 % and Pistacia only 3 to 19 %. Of the NAP taxa, Euphorbiaceae dramatically peaks at 41 % and Api-aceae reach their peak with 7 %, while Asteroideae remain high with between 9 and 23 %, as does Cichorioideae, 32 %. Chenopodiaceae peaks at 48 % (the highest in the whole sequence). Aquatic taxa are still low. Pseudoschizaea and Glomus spp. both remain relatively high. The zone corre-sponds to the beginning of the Bronze Age (Tarxien Ceme-tery phase).
4.2.6 LPAZ5 (455–210 cm) the late Holocene: ca. 3682–1731 cal BP
This last analysed section of the core has two notable AP species peaks, though as a whole sequence LPAZ5 records the lowest AP record of 10 % dropping from 18 %, while NAP taxa remain high at 82–90 %. Firstly, the start of LPAZ5 has a significant Pinus increase – the pollen from this species has been present throughout all the zones at low levels, 0– 4 %, but now records a peak of 10 %. Pistacia on the other hand is present in its lowest percentages, between < 1 and 4 %. Towards the end of this zone a second but smaller Olea peak occurs, reaching 10 %, while NAP taxa Cerealia-type pollen (Triticum, 2 %), 7 %, Cichorioideae, 63 %, Bras-sicaceae, 11 %, and Scabiosa, 7 %, all record peaks. Aquatic taxa are recorded at their lowest levels. This last zone also has another two microcharcoal concentration peaks reaching 9.2 and 10.4. This final LPAZ starts within the Bronze Age (Tarxien Cemetery) phase, followed by a break in the palyno-logical record (3600–2000 cal BP), and ends within the early Roman phase.
4.3 Climate reconstruction for the Burmarrad area, Malta
A quantitative climate reconstruction has been performed for Malta on the BM2 pollen sequence. The results (Fig. 8)
include: temperature, MTCO (mean temperature coldest month), and winter and summer precipitation. The findings are compared and contrasted with other Mediterranean cli-mate reconstructions (see Sect. 5.2).
4.3.1 Temperature reconstruction – MTCO
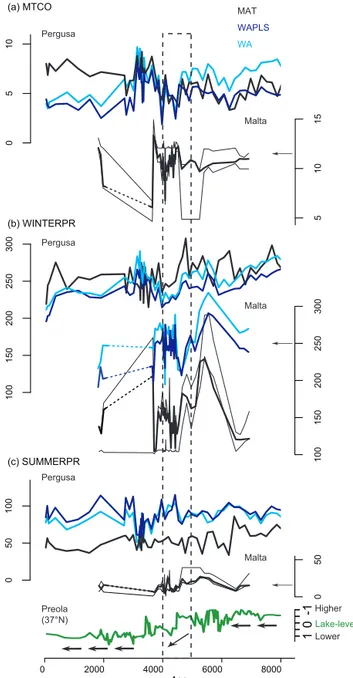
Between ca. 7000 and 4800 cal BP the temperature (MTCO) is fairly stable at around 11◦C, close to present-day values. After 4800 the temperature becomes more unstable with a minimum at 7◦C (∼ 4100 cal BP) and maximum at 14◦C (3700 cal BP). Just after this period there is a sharp decline. However, more data would be necessary to confirm this trend. After 3600 cal BP the dashed line is due to an ab-sence of palynological data for this period. The period be-tween 2000 and 1800 cal BP is marked by a brief increase in temperature to 12◦C close to the present-day coldest month mean minimum temperature for Malta.
4.3.2 Precipitation reconstruction
Winter precipitation displays much more variability than summer. Although reconstructed values differ following dif-ferent methods (MAT, WAPLS, and WA) they illustrate the same trends. From 7000 to 4600 cal BP both winter and sum-mer precipitation are generally high and tend to decrease especially after 6000 cal BP. The period between 4500 and 3800 cal BP is characterized by low winter precipitation in-dicating a dry period. Again there is no fluctuation displayed between 3700 and 2000 cal BP due to a break in the se-quence. Between 2000 and 1800 cal BP precipitation values are under the present-day ones.
5 Discussion
5.1 Vegetation dynamics and climate fluctuations
A number of studies have highlighted the problem of dis-entangling the human- and climate-induced changes in the Mediterranean region (e.g. Behre, 1990; Pons and Quezel, 1985; Sadori et al., 2004; Roberts et al., 2011; Zanchetta et al., 2013). More often than not it may be a fluctuating combination of these two forces driving the changes rather than a single factor, with one amplifying or even moderating the vegetation signals provided in the palynological record. While it is acknowledged that vegetation patterns can vary even within small island settings such as Malta (Hunt, 2015), the BM2 core provides insight into both changing vegetation dynamics and hydroclimatic fluctuations in the Burmarrad valley system from 7280 to 1730 cal BP.
5.1.1 Early Neolithic
Trump (2002) states that evidence of the first settlers in Malta, around 7200–7000 BP, is found at the Skorba and
5 10 15 0 2000 4000 6000 8000 Age 0 5 10 MAT WAPLS WA (a) MTCO Pergusa Malta 100 150 200 250 300 100 150 200 250 300 (b) WINTERPR (c) SUMMERPR Pergusa Malta Pergusa Malta -10 1 Higher Lower Lake-levels Preola (37°N) 0 50 0 50 100
Figure 8.Comparison between pollen-inferred climate for Malta
(35.9◦N, Burmarrad, Malta) and Lago Pergusa (37.5◦N, Sicily)
us-ing MAT (modern analogue technique), WAPLS (weighted average-partial least-squares technique), and WA (weighted averaging) and
lake levels for Lago Preola (37.4◦N, Sicily). (a) Mean temperature
of coldest month (MTCO), (b) winter precipitation (WINTERPR), (c) summer precipitation (SUMMERPR). (Malta’s present-day val-ues are indicated with an arrow on the scale bar).
Ghar Dalam prehistoric sites. These original occupiers com-ing from Sicily (Blouet, 2007), brought with them knowl-edge in tool making (stone, wood, and bone) and agricul-tural practices (Pace, 2004), as well as crop (barley, lentils, emmer, and club wheat) and domesticated animals such as sheep, goats, cattle, and pigs (Trump, 1972). However, the exact date when humans arrived in Malta remains a key
ques-tion. Broodbank (2013) postulates that permanent Mediter-ranean island settlements were probably preceded by early visitations. However, these remain “archaeologically invisi-ble” (Colledge and Conolly, 2007). The Mediterranean Sea, as well as other areas such as the Persian Gulf (Wells, 1922), were being sailed as early as 9950 cal BP. Even be-fore the Holocene epoch, during the Upper Palaeolithic and Younger Dryas, coastal and island crossings were taking place (Broodbank, 2006, 2013); given the inter-island visi-bility and this early movement of seafarers, it is plausible that the Maltese islands may have been visited, and possi-bly temporarily occupied, before being permanently settled during the Neolithic.
Much of southern mainland Europe saw decreasing de-ciduous woodland areas (from the early Neolithic onwards, Delhon et al., 2009). This vegetation does not appear abun-dant on the Maltese Islands during this period (Carroll et al., 2012; Djamali et al., 2012), though it has been postu-lated that deciduous forest was the dominant vegetation at this time (Grech, 2001). Evidence for the environment during this early Neolithic period in Burmarrad suggests an initially open landscape at ca. 7280–6700 cal BP surrounding a large palaeobay during the maximum marine transgression period (Marriner et al., 2012) with mainly non-arboreal pollen and aquatic/wetland taxa. Recorded species indicating this envi-ronment are Botryococcus, a common green algae and Phae-roceros laevis, a bryophyte, which is associated with contin-ually moist or slightly wet, often acidic, soils (Boros et al., 1993), generally located in flood plains, ditches, streams, and freshwater marsh areas. It is also considered one of the ini-tial species post-fire events (Bates, 2009). However, P. lae-vis, similar to most bryophytes, is not associated with halo-phytic conditions (Warny et al., 2012). This species might also be considered an indicator of human activity (Djamali et al., 2012). These results are consistent with pollen records from the BM1 core, dated to a similar period from the same flood plain (Djamali et al., 2012), as well as the coastal areas of the neighbouring island of Sicily (Noti et al., 2009) and SE Spain just prior to 7000 cal BP (Pantaléon-Cano et al., 2003). However, not all Mediterranean coastal sites had an open environment at this time, with some areas experiencing it earlier, such as other coastal and inland regions in Sicily (Calò et al., 2012; Tinner et al., 2009) and western Greece (Avramidis et al., 2012).
Although the evidence from the BM2 core and the BM1 core (Djamali et al., 2012) points to this area having an open landscape, it is necessary to highlight that there are Mal-tese archaeological records from the Neolithic period from other locations. Such evidence might point to a different more “woody” environment, such as the discovery of Cer-cis siliquastrum, Crataegus sp., and Fraxinus sp. charcoal remains (Metcalfe, 1966). Both C. siliquestrum (Fabaceae) and Crataegus (Rosaceae) are extremely under-represented in pollen diagrams, due to the low pollen production and their dispersal methods. These are deciduous arboreal taxa that
ei-ther did not appear in the pollen record of the BM2 core or only in minimal and infrequent quantities. Therefore, these species may have originated in isolated patches in other re-gions on the archipelago or were brought as timber to the island by the early farmers or trading seafarers along with other goods.
Many of the key anthropogenic pollen indicators (API) used in different parts of the Mediterranean region, such as primary crop species (Vitis, Olea, cereals, and pulses) and secondary “weed” species (Artemisia, Chenopodiaceae, P. lanceolata, Rumex, Urtica), are native to the Mediterranean area (Brun et al., 2007; Grove and Rackham, 2001; Mercuri et al., 2013a; Sadori et al., 2013a) making it difficult to state with any certainty that an individual species is evidence of anthropogenic activity – although it may be possible to take a combination of key cultivated and ruderal species to pro-vide a stronger indication of human presence (such as Car-rión et al., 2010a; Behre, 1990), even if this activity only has a weak influence on the natural vegetation or perhaps acts as an amplifier to the stronger climatic stimulus. Us-ing the works of Andrieu-Ponel et al. (1999), Behre (1990), Brun et al. (2007), Carrión et al. (2010a), Li et al. (2008), and Mercuri et al. (2013a, b), selected taxa from the BM2 core have been identified with consideration of their bio-geography to highlight potential evidence of human activ-ity throughout the sequence: cultivated (which includes cere-als and associated secondary indicator taxa) and nitrophilous species (taxa often inferring livestock, pasture, and settle-ment) (Fig. 3). Based on different groups of API, we suggest that traces of human activity are present from the base of the BM2 core (7280 cal BP), similar to Noti et al.’s (2009) south-ern Sicily results – crop taxa (Cerealia-type) and associated ruderal species (such as P. lanceolata, Chenopodiaceae, Ci-chorioideae, Brassicaceae, and Sporormiella) are noted from the start of the early Neolithic onwards.
These initial traces of palynological evidence, mainly based on NAP taxa which are, due to their phenology, consid-ered more sensitive and responsive to environmental change (Markgraf and Kenny, 2013), coincide with archeological ev-idence for nearby permanent dwelling structures on the is-land (Pace, 2004; Trump, 2002), as well as abundant mi-crocharcoals – the latter might be indicative of landscape modification through the use of fire, which has been recorded during the same time period in neighbouring Sicily (Noti et al., 2009) as well as throughout other Mediterranean areas (Vannière et al., 2011), although climate-driven fire events cannot be discounted (Sadori et al., 2015a). Nonetheless, the extent to which these first recorded settlers actually im-pacted the landscape from its “original state” is hard to deci-pher without pre-occupation data. What is clear is that arbo-real pollen was extremely low in this catchment area during the early Neolithic, and those tree species actually recorded in the pollen sequence, such as Pinus, may well have been present due to long-distance transportation (Calò et al., 2012; Court-Picon et al., 2006; Hjelle, 1999).
5.1.2 Mid Neolithic to early Temple Period
The three cultural phases of the Maltese Neolithic period are delineated mainly by changes in pottery styles, the initial style being almost identical to pottery found in Stentinello, Sicily (Trump, 2004). These remains have been recovered from both the Ghar Dalam cave and the Skorba huts, the latter located very close to the Burmarrad catchment area (Fig. 1b), as well as fragments for other locations in the archipelago including Gozo. It is highly probable that during this first Ghar Dalam phase (Fig. 7) many more geograph-ically important sites around the island were being settled (Pace, 2004), while farming customs and practices were pos-sibly undergoing adaptation. The first temples were built later – ca. 5450 cal BP during the ˙Ggantija phase (Fig. 7).
The major recorded change in the landscape is from a predominantly open herbaceous and wetland environment, to a much more closed evergreen arboreal cover. At ca. 6700 cal BP there is a rapid expansion of Pistacia, reach-ing a peak of 60 % at 5500 cal BP – this peak coincides with the boundary between the Zebbug and Mgarr phases of the Temple Period (Fig. 7). Evidence from these phases can be found within the catchment area, such as the tomb dating to the Zebbug phase at San Pawl Milqi. These unusually high percentages for Pistacia, generally considered under-represented in records (Collins et al., 2012), produce low to moderate pollen quantities that are poorly dispersed (Beer et al., 2007), suggestive of very dense areas of Pistacia scrub-land within the Burmarrad catchment area. This high per-centage was also recorded by Djamali et al. (2012) in the same plain (BM1 core). However, it was not part of the pollen records from Carroll et al. (2012) taken from Salina Bay, sit-uated within the same catchment area as the BM1 and BM2 cores. This may be due to a number of reasons: Pistacia pollen not dispersing to the Salina core site (for example, ge-omorphic, hydrologic and/or vegetative features in the land-scape affecting pollen movement), different preservation or deposition conditions within the core sediments, and/or dif-ferent methods utilized for the pollen extraction process.
Similar rapid and large expansion of Pistacia during this period appears in records from Sicily at Biviere de Gela (Noti et al., 2009), Lago Preola (Calò et al., 2012), and Gorgo Basso, where an earlier even larger expansion is recorded be-tween 10 000 and 7500 yr cal BP (Tinner et al., 2009). This earlier Pistacia peak and subsequent decline were also noted in Crete (Bottema and Sarpaki, 2003) and western Greece (Jahns, 2003). Djamali et al. (2012) provide a concise ac-count of the life cycle, distribution, and possible expansion time frame difference of this genus in relation to the Malta record. The trigger for this Pistacia increase has been pro-posed as being climatic in origin. Noti et al. (2007) suggest that the expansion of forests and scrublands between 7000 and 5000 cal BP recorded in southern Sicily is due to in-creased moisture availability at this time, which is also noted in southern Spain (Carrión, 2002).
With regard to NAP taxa, the level recorded is the lowest within the whole sequence, with particularly low percentages of nitrophilous taxa, supporting the theory of dense scrub-land, that would restrict the growth of other plant species. Chenopodiaceae taxa use, as a possible indictor of a ni-trophilous environment, is treated with caution. Many in this taxon are known halophytes (Grigore et al., 2008) and pos-sess a close association with aridity (Pyankov et al., 2000); therefore their use, especially given this coastal zone context, is always in conjunction with other key taxa. Additionally, there is the lowest level of Poaceae, including Cerealia-type (Triticum-type), further confirming the dense scrubland sce-nario. Microcharcoal quantities are also at their lowest levels, a decrease that is noted in other sites in southern European localities, such as Lago Pergusa (Sadori and Giardini, 2007) and Trifoglietti (Joannin et al., 2012) in Italy. Sadori and Gi-ardini (2007) state that this decline in fire events corresponds to forest closing; in the case of Burmarrad this could be con-sidered as scrubland closing.
Burmarrad’s palaeo-lagoon is still present during this pe-riod, with key indicator species such as dinoflagellates reach-ing their highest level; these are primarily marine organisms (Traverse, 2008). Their presence confirms the lower estuar-ine environment at the site recorded in both BM1 (Djamali et al., 2012; Marriner et al., 2012) and BM2 (this study).
5.1.3 Late Temple Period
The Temple period in Malta lasted between 6050 and 4450 cal BP; this period is unique to the archipelago (Pace, 2004). To date, nowhere else in the world are there free-standing stone buildings (such as Ha˙gar Qim, Mnajdra, and
˙
Ggantija, Fig. 1b) dating to this period. The first temple struc-ture is dated to ca. 5450 cal BP, built during the ˙Ggantija phase (Fig. 7). The purpose of these buildings is thought to be for ritual purposes, for the estimated 10 000 people settled on the islands at this time (Trump, 2002).
During this temple-building phase there is a notable in-crease of Olea from 4938 cal BP peaking at 4635 cal BP (20 %). This increase in Olea is similar to that observed in Sicily and Minorca around 5000 cal BP (Pérez-Obiol and Sadori, 2007). However, this increase is later than that noted by Tinner et al. (2009) at Gorgo Basso (6500 cal BP), but ear-lier than the one recorded by Sadori et al. (2013) at Pergusa (3200 cal BP), an increase that they propose is less likely to be “natural” in origin. Pérez-Obiol and Sadori (2007) argue that it is difficult to state whether these early increases in Olea are climatic or anthropogenic in origin; though likely driven by climate, the possibility that Neolithic people were cultivating it cannot be excluded (Beaulieu et al., 2005). Car-rión et al. (2010b) through wood-charcoal and wood analy-sis from prehistoric sites have shown that Olea europaea L. var. sylvestris, the oleaster (shrubby form), was abundant in the western Mediterranean during the early to mid-Holocene (8800–5600 cal BP), and they suggest that it may have been
the dominant species in thermophilous plant formations dur-ing this time, with wild varieties thrivdur-ing in the warmest re-gions and generally near coastal areas. The oleaster usually takes a shrubby form while the Olea europaea L. var. eu-ropaea is more tree-like. Davis (1994) suggests that Olea levels around 20 % might be indicative of local cultivation (within 5 km) while values > 5 % may indicate olive cultiva-tion on a wider regional scale.
With this increase in Olea there is also a steady increase in herbaceous taxa, particularly nitrophilous and anthropogenic pollen indicator species (Fig. 3). Another significant increase is seen in Brassicaceae – though previously at minimal levels, it now reaches around 15 %. Noti et al. (2009) also observed an increase in herbaceous taxa at Biviere di Gela in southern Sicily (namely Chenopodiaceae-type, Cichorioideae, Brassi-caceae, Mercurialis annua, and Rumex acetosella-type) at around the same time. The issue with Brassicaceae (along with Asteraceae, Chenopodiaceae, Poaceae, and Rubiaceae) is the fact that it has undifferentiated families composing arable weeds, as well as disturbed habitats and sometimes marsh-plant species such as Nasturtium officinale (Zeist et al., 2009) and the pollen produced only shows slight mor-phological variation, so taxonomic level determination gen-erally only reaches genus or family level (Brun et al., 2007). Therefore an increase in Brassicaceae by itself might not be a clear indicator of human activity. However, when com-bined with the increase in other taxa such as Plantago-type, Poaceae, Cerealia-Plantago-type, and/or Rumex (Costantini et al., 2009; Djamali et al., 2012) or Sordariaceae (Carrión et al., 2007), this can strengthen its signal of anthropogenic pres-ence, in the latter case suggesting possible pastoral activ-ity. In this regard, in the BM2 core, there is a synchronous increase in API taxa (e.g. Chenopodiaceae, Plantago-type, Poaceae, and Rumex) with Brassicaceae, as well as an in-crease in coprophilous-associated NPPs such as Sordaria, Delitschia, Coniochaetaceae, and Sporormiella (Cugny et al., 2010; Gelorini et al., 2012), suggestive of human activity, particularly the possible grazing of livestock in the area.
5.1.4 Bronze Age
The Bronze Age in Malta occurred between 4450 and 2650 cal BP (Fig. 7), and is divided into three phases rep-resenting different colonizations of these islands: Tarxien Cemetery, Borg-In-Nadur, and Bahrija, the latter settlers co-inhabiting the island with the Borg-In-Nadur people for about 200 years (Pace, 2004). Trump (2004) suggests that the difference in cultures between the Temple and Bronze Age is so apparent that it is possible that the islands passed through a phase of abandonment, though this remains the subject of an ongoing debate. During the Bronze Age, for-tified settlements were built on strategically located hilltops complete with underground food storage facilities known as “silo-piths” (Buhagiar, 2007), while dolmen structures (pos-sibly used for the burial of cremated remains) were also
con-structed. Even though there is evidence that these Bronze Age people built dwellings and undertook agricultural ac-tivity, including livestock management and possible crop ro-tation (Fenech, 2007), the previous Temple Period, with its megalithic temple civilization, is considered culturally and economically superior (Buhagiar, 2014). The population of the islands during the Bronze Age is suggested to have been smaller than that of the Temple period (Blouet, 2007), though their impact on the landscape can still be traced. One such impact found around the islands is the ancient cart rut tracks. These parallel channels are incised into the limestone rock (Hughes, 1999) – 22 such networks have been recorded in the Burmarrad catchment area alone (Trump, 2004). There has been speculation on the origin, use, and date of these cart ruts since they were first referenced in 1647 by Gian Francesco Abela, one of Malta’s earliest historians (Hughes, 1999; Mottershead et al., 2008). Although it is not this pa-per’s purpose to delve into their much-debated chronology and use, it is pertinent to point out that at least some are sug-gested to be Bronze Age in origin (Trump, 2004).
Throughout the early and mid-Bronze Age, arboreal species in the Burmarrad catchment area are decreasing in abundance, while herbaceous taxa are increasing, suggest-ing the opensuggest-ing up of the landscape. Furthermore, the in-creased microcharcoal concentration at the start of this se-quence might indicate the use of slash-and-burn to this end. This increase in fire activity around 4500 cal BP is also noted in southern Sicily at Gela di Biviere (Noti et al., 2009) and slightly earlier (5000 cal BP) at Lago Pergusa (Sadori and Gi-ardini, 2007). It is also observed as a general trend in the Mediterranean from around 4000–3000 cal. BP (Vannière et al., 2011). The cause of this increased fire activity is sug-gested to be partly due to human activity and associated dis-turbances.
Pastoral activity plant indicators (such as Rumex and Plan-tago lanceolata-type) reach their highest levels in this se-quence. P. lanceolata is known to grow in both hay mead-ows and grazed areas (Briggs, 2009), though there are dis-tinct ecotypic variants for co-adaptive traits depending on the habitat (Van Groenendael, 1986; Steans, 1976, cited in Briggs, 2009). However, further evidence including a very significant increase in Sporomiella, a coprophilious fungi as-sociated with pastoral activities (Pavlopoulos et al., 2010), along with increases in nitrophilous taxa (Li et al., 2008) such as Urtica and an exceptionally large peak in Chenopo-diaceae, at ca. 4000 cal BP, strengthens the interpretation that land use in the Burmarrad area included grazing from around 4200 cal BP onwards. This increase in the use of livestock supports the argument put forward by Blouet (2007) whereby he proposes that, during the Bronze Age, “war-like” condi-tions led to a shift towards livestock use rather than crop cul-tivation, due to the ability to be able to move animals quickly into the fortified settlements.
The early part of the Bronze Age in this area is also marked by a rise in Pseudoschizaea (a Zygnematacean algae spore)
and Glomus (Glomaceae). Carrión et al. (2010) state that an increase in both these taxa may indicate increased soil erosion. Supporting this idea, increasing Glomus spp were noted by Ejarque et al. (2011) in areas of greater soil per-turbance and erosion. Furthermore, Estiarte et al. (2008) de-scribe Pseudoschizaea as indicative of soil erosive activity, especially when associated with certain taxa, such as Aster-aceae, that are known markers of edaphic processes. In the case of the early Bronze Age in Burmarrad, there is an in-crease in Asteraceae coinciding with the inin-crease of Glo-mus spp and Pseudoschizaea, further supporting the sugges-tion that during this time there is increased erosional activity, which is synchronous with a reduction in pollen concentra-tion rate as well as reduced arboreal taxa. This increased ero-sion can also be seen within the changing dynamics of the ria. At around 7000 cal BP the area formed a marine lagoon (area ca. 1.8 km2), followed by a sharp decrease in marine mollusc taxa from ca. 4000 cal BP, with the area infilling with flu-vial sediment and gradually becoming landlocked (Marriner et al., 2012).
This increasing human pressure on the landscape during the Bronze Age is not isolated to the Maltese archipelago or the central Mediterranean area (Mercuri, 2014) it has also been recorded throughout the whole region, between 5000 and 3000 cal BP, as societies and their associated ecologi-cal disturbances become more apparent (Sadori and Giardini, 2007; Mercuri et al., 2015). Sadori et al. (2011) note two sig-nals within the Mediterranean; the first corresponds to a cli-mate event of 4300–3800 BP (Magny et al., 2009), that of a sudden and brief episode between 4400 and 4100 cal BP which initially affects the arboreal pollen concentration fol-lowed by the percentages (generally being accompanied by human presence indicators), then a second between 3900 and 3400 BP, which they suggest is slightly longer and involved intensive land exploitation.
Towards the latter part of this period in Burmarrad (ca. 3600 cal BP) the remaining Mediterranean arboreal taxa decline again. However, there is a distinct increase in Pinus, reaching over 10 % from its previous levels of 1–4 % throughout the whole sequence. MacDonald and Cwynar (1985) suggest that when Pinus reaches 20 % it comes significant in the environment, lower percentages be-ing more likely due to background noise from long-distant transport. Furthermore, Calo et al. (2012) state that Pinus levels of 10 % might still be representative of long-distant transport because the species is a known producer of large quantities of well-dispersed pollen, therefore its pollen can be found even if the plant is not locally abundant. The origin of this Pinus pollen might not be Sicily or mainland Europe because Pinus (along with Corylus, Alnus, and Ostrya) has been documented to be on the island prior to the Holocene, in Pleistocene deposits (Hunt, 1997). Therefore this 10 % in-crease at Burmarrad might be indicative of Pinus either now growing in small communities within the catchment area or perhaps in larger communities elsewhere on the archipelago.
In neighbouring Sicily, Pinus levels increase at a similar time at Lago Preola (Calò et al., 2012) and Gorgo Basso (Tin-ner et al., 2009). However, Carroll et al. (2012) recorded considerably more Pinus around this time (3900 cal BP on-wards) within the same catchment area (reaching levels close to 80 %) although they suggest that this may be due to infill-ing of a former dredged channel (mid-19th century) rather than indicative of local vegetation at this time.
In addition, towards the middle of the Bronze Age pe-riod, there is a gradual decline in nitrophilous and pastoral taxa (Fig. 3), perhaps indicating a reduction in the amount of livestock within the catchment area. On the other hand, there is an increase in Poaceae as well as a considerable rise in Euphorbia. This latter taxon (along with Kickxia, Pa-paver rhoeas-group, Sinapis, Scleranthus, and Valerianella) is considered one of the classic indicators of cultivated areas in southern Europe (Brun et al., 2007). Therefore the Bur-marrad area, while remaining a generally open landscape, may well have transformed from a predominately grazed area to a more cultivated one from the middle of the Bronze Age period onwards. Marriner et al. (2012) suggest that by around 3000 cal BP the Burmarrad ria had reduced to 0.9 km2 (50 % smaller than its 7000 cal BP maximum marine trans-gression) providing a fertile deltaic floodplain for food pro-duction. Further supporting the suggestion of agricultural ac-tivity at this time are the silo-piths found within the hill-top settlements (Buhagiar, 2007). These provide indirect ev-idence that the amount of agricultural production was great enough to enable food storage to take place during this time. In Sicily, the evergreen vegetation decreased from 4500 to 3700 cal BP (such as at Biviere di Gela, Gorgo Basso, and Lago Preola; Fig. 1a), and a similar reduction can be ob-served within the Burmarrad catchment area. These sites in Sicily then record a recovery of evergreen taxa between 3700 and 2600 cal BP. Almost synchronously, an increase is noted at around 3680 cal BP in NW Malta. Unfortunately, the Bur-marrad core has a break in the record just after this date, though it may be reasonable to suggest that a similar recov-ery period to Sicily occurred on the archipelago.
5.1.5 Historical period
The BM2 core sequence (Fig. 7) covers the first three phases of the historical period: Phoenician 2750–2430 BP, Punic 2430–2168 BP, and Roman 2168–1404 BP (Pace, 2004), al-though palynological data are currently only available for the period 1972–173 cal BP. At the beginning of the second Punic War the islands changed from Carthaginian to Ro-man rule, forming part of the Sicilian province (Bonanno, 2005). However, for about the first three hundred years the Punic culture, detectable in pottery styles and inscriptions, persisted (Blouet, 2007). Seventeen Roman period sites have been linked to the production and exportation of olive oil on the islands (Gambin, 2005), along with extensive port re-mains, such as quays and various buildings including
ware-houses, around the Marsa area (Gambin, 2004/5), being in close proximity to the Grand Harbour, a naturally sheltered ria. Following Roman occupation in 2168 BP, archaeologi-cal remains and textual evidence both suggest that Malta was producing refined textiles and that some islanders were liv-ing in sophisticated dwellliv-ings such as a typical domus lo-cated in Rabat (Bonanno, 2005). The Burmarrad area also has archaeological evidence of Roman occupation. Evidence includes large oil-producing Roman villas (San Pawl Milqi and Bidnija), burial complexes (Bonanno, 2005), along with ceramic deposits datable to the Punico-Roman period from the silted ancient harbour (Gambin, 2005).
The last part of the core sequence for the Burmarrad plain dates to the mid-Roman phase (1972–1730 cal BP). The landscape in the catchment area at this time appears rela-tively open – Pinus levels have reduced, and NAP taxa are high, with a marked peak in Cichorioideae, Brassicaceae, and Cerealia-type, as well as smaller increases in Triticum-type and Plantago-Triticum-type. An increase in agricultural activity within this area is supported by the presence of these culti-vated crop and associated ruderal taxa. Marriner et al. (2012) conclude that around this time a large part of the area had become a well-developed fertile deltaic plain, therefore it is very likely that it was used for cultivation purposes. These crop taxa are generally considered to have poor dispersal, be-ing under-represented (though present), even when near cul-tivated land (Brun et al., 2007; Behre, 1981).
When interpreting pollen data, possible long-distance transport, including that of cereals, should be considered (Birks and Birks, 1980; Court-Picon et al., 2005). Another consideration regarding Poaceae, including cereals and other crop species, is that pollen dispersal and its potential de-position is dependent on harvesting methods (Hall et al., 2013). Furthermore, it has been suggested by López-Merino et al. (2010) that crop cultivation may decrease the herba-ceous plant community abundance, while abandonment can have the opposite effect. This increase in cultivated species and corresponding decrease in herbaceous taxa can be noted in the pollen record of Burmarrad during this time, although attention must be placed on the over- or under-representation situation caused by a plant’s life cycle. Under-represented taxa, such as cereals, are considered to produce low quan-tities of pollen that are poorly dispersed (Court-Picon et al., 2006). This can cause over-representation of extra-local and regional pollen that is anemophilous in nature. Furthermore, pollen production of local Poaceae taxa in intensive live-stock areas has been suggested to be low due to overgraz-ing (Hjelle, 1998; Mazier et al., 2006), which possibly would also allow for over-representation of extra-local and regional pollen, although Ejarque et al. (2011) observed contrasting results in their modern pollen-rain study.
Another notable increase is that of Olea, peaking at ca. 1800 cal BP. Although not as large as the one recorded in the Temple period it reaches nearly 10 %. This level appears consistent with Di Rita and Magri’s (2009) research from an
early period (3500–2700 cal BP) that finds Olea percentages never exceeding 10 % in sites within the evergreen vegetation belt in Italy and the Balkans (such as Lago Battaglia, Caroli and Caldara, 2007, Lago dell’Accesa, Lake Voulkaria, and Malo Jezero). Olea is considered an emblematic plant of the Mediterranean (Kaniewski et al., 2012; Di Rita and Melis, 2013) acting as a bio-indicator to define the limits of this re-gion’s vegetation (Grove and Rackham, 2001; Carrión et al., 2010; Roberts et al., 2011) being both drought-tolerant and cold-intolerant (Collins et al., 2012), though its adequacy as a true bio-indicator has been questioned due, in part, to its cultivation (Blondel et al., 2010). Olea is a good producer and disperser of pollen (van Zeist et al., 2009). Its pollen can be found in the surface samples even when the plant is not present in the region (Canellas-Bolta et al., 2009; Joannin et al., 2012), though other researchers (Davis, 1994; Stevenson, 1981) note that it may only be a good producer but a poor dis-perser. It has been observed that Olea pollen can vary greatly in modern surface samples within olive stands, such as be-tween 3 and 40 % (van Zeist and Bottema, 1991) and 7.6 and 56.4 % (Florenzano, 2013). In fact Florenanzo (2013) notes that this level decreased to just 2.1–7.6 % at 500 m from the stand. Djamali et al. (2015) suggest that their SW Iran Olea levels, reaching 8.2 %, indicate small-scale olive groves distributed over the catchment area. With this is mind, the origin of BM2’s Olea increase, if not from Burmarrad, is most likely still from within the islands. However, Carroll et al. (2012) did not record Olea in their Salina Bay sequence in any great quantities and it was not noted as present during this particular phase (possible explanations for the latter site provided in Sect. 5.1.2).
The interpretation that Olea was present on the island, pos-sibly within the Burmarrad area, is based both on the paly-nological evidence provided in BM2 as well as from archae-ological and geoarchaearchae-ological evidence as stated by Gam-bin (2004, 2005, 2012) and Bruno (2007), which suggests that Burmarrad was an area of olive production during the Roman period. The Roman villa of San Pawl Milqi, situated within the catchment area, has substantial structures for olive pressing and oil production (Cefai et al., 2005). Also sup-porting this idea is the nearby presence of an ancient grove that is situated next to a surveyed but unexcavated Roman villa (Docter et al., 2012). Furthermore, the scale and quan-tity of these archeological remains suggest that the oil pro-duction exceeded the needs of the local population (Gam-bin, 2005; Marriner et al., 2012). This rise in Olea cultivation in the Roman period corresponds well with that observed in Tripolitania, Libya (Barker et al., 1996), as well as other ar-eas such as Spain (Pantaléon-Cano et al., 2003) and the Lev-ant (Kaniewski et al., 2014; Litt et al., 2012). Di Rita and Ma-gri (2009, p. 304) note that the “Roman occupation coincided with a modest diffusion of Olea”; they suggest that between 2500 and 1500 cal BP the climate conditions in southern Italy were not so advantageous for olive cultivation (whereas the Bronze Age people benefited from plentiful wild olive