HAL Id: hal-00301681
https://hal.archives-ouvertes.fr/hal-00301681
Submitted on 26 Apr 2007
HAL is a multi-disciplinary open access
archive for the deposit and dissemination of
sci-entific research documents, whether they are
pub-lished or not. The documents may come from
teaching and research institutions in France or
abroad, or from public or private research centers.
L’archive ouverte pluridisciplinaire HAL, est
destinée au dépôt et à la diffusion de documents
scientifiques de niveau recherche, publiés ou non,
émanant des établissements d’enseignement et de
recherche français ou étrangers, des laboratoires
publics ou privés.
M. Paulatto, T. Pinat, F. Romanelli
To cite this version:
M. Paulatto, T. Pinat, F. Romanelli. Tsunami hazard scenarios in the Adriatic Sea domain. Natural
Hazards and Earth System Science, Copernicus Publications on behalf of the European Geosciences
Union, 2007, 7 (2), pp.309-325. �hal-00301681�
www.nat-hazards-earth-syst-sci.net/7/309/2007/ © Author(s) 2007. This work is licensed under a Creative Commons License.
and Earth
System Sciences
Tsunami hazard scenarios in the Adriatic Sea domain
M. Paulatto, T. Pinat, and F. Romanelli
Dipartimento di Scienze della Terra, Universit`a degli Studi di Trieste, Via E. Weiss 4, 34127 Trieste, Italy Received: 1 February 2006 – Revised: 10 April 2007 – Accepted: 10 April 2007 – Published: 26 April 2007
Abstract. The tsunami phenomenon is mainly detected in
oceanic domains but it can also occur in small basins as the Adriatic Sea. The presence of great waves has been recorded a few times in the past centuries on the Adriatic shorelines, therefore this suggests the idea to evaluate which could be the maximum amplitude reached by a possible future tsunami event. In this framework we calculate several synthetic mare-ograms applying to the shallow water basin case both the ory of modal summation by Panza et al. (2000) and the the-ory of the Green’s function by Yanovskaya et al. (2003). The first is applied to the case of tsunamis generated by an off-shore source, the second to the case of tsunamis generated by an inland source. Both kinds of tsunamigenic events did al-ready occur in the Adriatic domain, as witnessed in many cat-alogues (Caputo and Faita, 1984; Bedosti and Caputo, 1986; Tinti et al., 2004) and also pointed out in the recent “Cat-alogue of reported tsunami events in the Adriatic Sea” (see Appendix).
We calculate synthetic mareograms varying those param-eters which are the most influencing in tsunami generation, such as magnitude, focal depth, water layer thickness, etc., in order to estimate the expected values of tsunami maximum amplitude and arrival time, in the whole Adriatic basin, for the selected scenarios.
1 Introduction
A tsunami occurs after a huge mass of water is displaced by some force from its equilibrium configuration. Gravity acts as a restoring force, tending to bring the displaced mass of water back to its original equilibrium state. Most tsunamis are generated by submarine earthquakes, but possible sources are also inland/coastal earthquakes, landslides and meteoric impacts. Due to their generation mechanism, periods and wavelengths associated with tsunamis are longer than those associated with ordinary wind-driven sea waves and for large Correspondence to: F. Romanelli
(romanel@dst.units.it)
submarine earthquakes their amplitudes can be very impres-sive, especially when the waves approach the shorelines.
In spite of the fact that the great majority of seismic tsunamis is generated in oceanic domains, smaller basins sometimes experience this phenomenon. Large tsunami events require the presence of a thick water layer that can be found only in the oceanic domain; anyway also in the Mediterranean Sea many tsunamis, sometimes of destructive intensity, have occurred during historical times. In partic-ular, focusing on the Adriatic Sea domain, where the local seismicity is not very strong (usually less than M=7) and the water depth is usually very small (typically less than 400 m), about 60 tsunamis have been signalled in the last 2000 years (see Appendix).
The study of earthquake and tsunami historical catalogues, has been essential in defining the tsunamigenic areas in the Adriatic domain. We have investigated the locations of earth-quake sources in the region, clustering them in six groups, depending on their location nearby the Adriatic Sea coasts, which define the six tsunamigenic prone areas analysed in the present study. The following catalogues have been used:
– CF, Primo catalogo dei maremoti delle coste italiane
(Caputo and Faita, 1984);
– ATC, Catalogue of reported tsunami events in the
Adri-atic Sea (see Appendix)
– ITC, The new catalogue of the Italian tsunamis (Tinti et
al., 2004);
– CFT, Catalogo dei Forti Terremoti, dal 461 AC al 1997
(Boschi et al., 2000);
– CSI, Catalogo della Sismicita‘ Italiana dal 1981 al 2002
(Castello et al., 2005);
– NT4, Catalogo Parametrico dei Terremoti Italiani al
di sopra della soglia del danno (Camassi and Stucchi, 1998);
– ECCSE, Earthquake Catalogue for Central and
South-eastern Europe, 342 BC–1990 AD (Shebalin et al., 1997);
– CEE, Catalogue of European Earthquakes with
intensi-ties higher than 4.0 (Van Gils et al., 1991);
– PA, Tsunami in the East Mediterranean: 1. A catalogue
for the area of Greece and adjacent seas (Papadopoulos, 2001).
The objective of this work is to extend the study and mod-elling of tsunami generation and propagation to the case of a small shallow water basin, the Adriatic Sea, and to assess the tsunami hazard potential of the study area, with the calcula-tion of a series of hazard scenarios.
2 Tsunami modelling: theory and method
The traditional approach to model tsunami generation is based on solving the hydrodynamic equations with boundary conditions at the ocean floor corresponding to a static dis-placement caused by the earthquake source (e.g. Hammack , 1973; Lee and Chang, 1980; Okal, 1982; Comer, 1984a, b), Another well developed approach is based on the modal the-ory (e.g. Pod’yapolsky, 1968; Ward, 1980-a; Comer, 1984a, b; Panza et al., 2000). The former approach assumes the ocean and solid Earth to be partially coupled, whereas ac-cording to the latter they are fully coupled. Though the modal theory gives a solution corresponding to the exact boundary conditions, and it may be easily extended to models with slightly varying thickness of the water layer, it can be ap-plied only when a source is located under the ocean. How-ever, there are indications that sources near a coastline and even inland, may cause intense tsunami waves. For the anal-ysis of such a case a suitable approach may be that based on the Green’s function technique, as proposed firstly by Kajiura (1963) for the analysis of tsunamis excited by an impulsive source.
2.1 Modal summation technique – Tsunamis generated by offshore earthquakes
The approach we make use here for modelling tsunamis gen-erated by offshore earthquakes is the extension, performed by Panza et al. (2000) to the case of tsunami propagation, of the well-known modal theory (Pod’yapolsky, 1968; Ward, 1980-a; Comer, 1984a, b) and therefore we simply refer to it as “modal method”. In this approach it is assumed that the ocean and the solid Earth are fully coupled.
From the mathematical point of view, in the modal ap-proach the equations of motion are solved for a multi-layered model structure, according to Haskell (1953), so the set of equations is converted into a matrix problem in which to look for eigenvalues and eigenfunctions.
In general, the modal theory gives a solution correspond-ing to the exact boundary conditions, and so it is easily ex-tended to models with slightly varying thickness of the water layer. Therefore, the modal method allows us to calculate synthetic signals for both laterally homogeneous (1d) and laterally heterogeneous (2d) structures. For the 2d case, the structural model is parameterised by a number of 1d struc-tures put in series along the profile from the source to the receiving site. The liquid layer is considered to be homo-geneous and incompressible, no vertical stratification of the water is considered.
The parameterisation of the bathymetry is important for the longer source-site paths, since it can strongly influence travel times. In our calculations the number of model struc-tures varies from 2 to 14, depending mainly on the number of slope-trending variations along each path. It is a useful rule to keep the parameterisation as simple as possible.
The modal method has a major limitation: due to its intrin-sic mathematical formulation, it can be applied only when a source is located under the ocean (i.e. is applicable only to the offshore source case).
2.2 Green’s function approach – Tsunamis generated by in-land/coastal earthquakes
There are several indications that sources near or even in-side a coastline, may cause intense tsunami waves. For the analysis of such cases, a suitable approach to compute syn-thetic mareograms has been developed by Yanovskaya et al. (2003) with the Green’s function technique, which solves the problem of modelling tsunamis generated by inland/coastal sources.
This method uses the representation theorem together with the Green’s function as first proposed by Kajiura (1963) for the calculation of tsunamis generated by an extended source under an infinite water layer of constant thickness. This case is then extended with the addition of a coastline, considering a semi-infinite water layer of constant thickness.
The exact solution for the Green’s function in the liquid layer is represented in an integral form, and therefore, to solve the problem, it is necessary to adopt an approxima-tion. The approximation adopted is the well-known asymp-totic representation of the integral solution by Hankel’s func-tions, which allows the calculation only for the far-field case. A rough evaluation, in the case of tsunamis in a shallow wa-ter domain, fixes at about ten kilomewa-ters the lower limit for source-site distances that can be considered in this approxi-mation.
2.3 Wave propagation
Since we use two-dimensional and one-dimensional models, we can compute mareograms only along straight segments from the source to the receiver sites, neglecting all three-dimensional effects, such as refraction and diffraction, this
is a limitation of our method. When analysing the results one has to take into consideration that variations of the sea depth can cause refraction and thus focusing or de-focusing of the wave in some regions. Diffraction of the wave front may also play a significant role in the presence of obstacles such as an island or a peninsula.
Morever in proximity of the coast a number of local ef-fects can generally occur, due to the thinning of the liquid layer, strongly influencing both travel time and maximum amplitude. The ensamble of this phenomena is often called shoaling and is responsible for the final tsunami run-up. The major contribution is the amplification of the wave approach-ing the coast due to the progressive thinnapproach-ing of the water layer. The principle of conservation of energy requires that the wave energy, when the tsunami reaches shallow waters, is redistributed into a smaller volume, this results in a growth of the maximum amplitude. The linear theory gives for the shoaling amplification factor a simple expression, known as Green’s law. Typically the shoaling factor ranges from 1 (no growth) up to several units (amplification) depending on the considered domain (e.g. Ward, 1980-b). In the specific case of the Adriatic Sea, where the water layer thickness above the source can range from 1000 m to a few tens of meters, a simple calculation using Green’s law gives a shoaling factor in the range 1.0–2.1.
Shoaling amplification acts approximately untill the wave amplitude is less than half the sea depth (Ward and Day, 2007), then nonlinear phenomena cause the waves to break and eventually turn them backward. Ward and Day (2007) suggest that due to complications of wave refraction and interference runup is best considered as a random process that can be characterised by its statistical properties. Mod-els and observations hint that runup statistics follow a single skewed distribution spreading between 1/2 and 2 times its mean value.
Another phenomenon contributing to the wave amplifica-tion is the overlapping of the signal, due to the fact that waves travel more slowly in shallow than in deep waters, so the front of the wave packet, that first reaches shallow waters, is overtaken by the tail of the signal. This often results in a growth of the maximum amplitude.
When dealing with very long source-site distances (hun-dreds of kilometers), an additional effect on tsunami maxi-mum amplitude becomes relevant due to the phenomenon of dispersion, i.e. the fact that the components at low frequency of the signal travel faster than the higher ones. After a certain distance the slower high-frequency components tend to mi-grate at the tail of the wavetrain where they don’t contribute any more to the main peak amplitude. This aspect is not evi-dent in a small and shallow domain as the Adriatic Sea.
Earthquakes near a coastline or under the sea can also trig-ger large submarine landslides. Their contribution to tsunami generation can be conspicuous, but can be predicted only if the location and size of the landslide is known with suffi-cient accuracy. Minisini et al. (2006) show that in the
South-ern Adriatic Sea slope instability could have played a rele-vant role in tsunami generation in historical and prehistorical times.
3 Hazard scenarios
Modelling a hazard scenario has the main purpose to assess the maximum threat expected from a studied phenomenon in a certain area and to give specific directives to the local authorities in order to prevent and mitigate serious conse-quences on the population, the infrastructures and the envi-ronment.
By means of the modelling we calculate the maximum am-plitude of the vertical displacement of the water particles on the sea surface and the travel time of the maximum ampli-tude peak, since they are the most relevant aspects of the tsunami wave and also are the only characteristics always recorded in the chronicles and therefore in catalogues. The horizontal displacement field is calculated too, and, in aver-age, it exceeds the vertical one by an order of magnitude ap-proximately (this accounts for the great inundating power of tsunami waves with respect to wind driven ones). For source-site distances comparable with the dimension of the source (near-source) the extension of the fault may be relevant. In that case the point source approximation may be too crude for the estimation of arrival times.
To calculate tsunami hazard scenarios we first investigate the available historical data, from earthquake catalogues (as listed in Sect. 1) and other previous works (e.g. the “Seismo-genic Zonation of Italy”, ZS9 (Meletti C. and Valensise G., 2004) and the “Global Seismic Hazard Assessment Project”, GSHAP, Slejko et al., 1999) and successively we proceed to determine a number of tsunamigenic zones in the Adriatic Sea, i.e. six zones which have been identified as prone to generate tsunamis, namely: Zone 1, Eastern Central Adriatic Sea and coasts of Croatia; Zone 2, Eastern Italian coast; Zone 3, Gargano Peninsula (here we distinguish two cases: Zone 3-a, offshore source, and Zone 3-b, inland source); Zone 4, Northern Albanian coast; Zone 5 Coasts of Southern Croatia, Bosnia Herzegovina ad Montenegro; Zone 6, Julia and Friuli (Fig. 1).
As pointed out in Sect. 2, to model tsunami generation we distinguish two main cases: events generated by inland sources and events generated by offshore sources. In the Adriatic Sea both cases are possible and have been observed and reported in the catalogues, so we divide the source zones in two groups: offshore and inland.
3.1 Offshore sources
We consider offshore sources for zones 1, 2, 3-a, 4 and 5. For each zone we fix a representative epicenter, chosen among a set of historical earthquake locations extracted from the cata-logues, so that it is representative of the local seismicity. The
12 12 13 13 14 14 15 15 16 16 17 17 18 18 19 19 20 20 40 40 41 41 42 42 43 43 44 44 45 45 46 46 47 47 zone 6 zone 1 zone 5 zone 4 zone 2 zone 3 Trieste Venice Ravenna Bari Ortona Ancona Durres Dubrovnik Zadar Split Lesina Tremiti 20 40 60 80 100 200 200 400 600 1000 1200 800
Fig. 1. Bathymetric map of the Adriatic Sea. The bathymetric contours are drawn with a step of 20 m in the range from 0 to –200 m and with a step of 200 m in the range from –200 m to –1200 m. The contours of the six tsunamigenic zones are shown in red, the blue triangles correspond to the 12 receiver sites, the stars correspond to the epicenters of the considered events (yellow: offshore, orange: inland).
focal mechanism is chosen so that it has the maximum effi-ciency in generating tsunamis (in our modelling it is always a thrust fault, oriented normally to the source-site path in order to maximise the radiation in the direction of the site (Okal, 1988)). We calculate scenarios for three different values of magnitude and focal depth, to estimate how the tsunami generation is affected by the variation of these parameters, which are the most relevant in determining the intensity of the tsunami. For each source zone we choose a number of sites (usually four) among the major towns on the Adriatic coasts where we calculate the synthetic mareograms. The bathymetry along each source-site path is extracted from a bathymetric map1. The water depth at the sites where the mareograms are calculated is always taken to be 50 m.
1AdriaMed, 2001. The Geographical Management Units of the
Adriatic Sea. Paper presented at the GFCM-SAC Working Group on Management Units (Alicante, 23–25 January 2001). FAO-MiPAF Scientific Cooperation to Support Responsible Fisheries in the Adriatic Sea. GCP/RER/010/ITA/OP-02: 12 pp. Available from World Wide Web hhttp://www.faoadriamed.org/pdf/0P-02.zipi.
Table 1. Main parameters identifying the four sites of Zone 1.
Site Latitude Longitude Epicentral dist. R Durres (DU) 41.32◦N 19.45◦E 404 km Ortona (OR) 42.35◦N 14.40◦E 138 km Split (SP) 43.52◦N 16.43◦E 90 km Venice (VE) 45.42◦N 12.37◦E 331 km
3.1.1 Zone 1: Eastern Central Adriatic Sea and coasts of Croatia
This zone includes the area South-East of the central Adri-atic pit (or Jabuka pit) and the Croatian coasts from Zadar to the island of Hvar. The seismicity of the coastal region is determined by the subduction of the Adriatic plate under the Dinarides (ZS9) while the seismicity of the central Adriatic area is of intra-plate type (Slejko et al., 1999; Ivancic et al., 2002). The typical fault mechanisms are thrust or strike-slip and the focal depth ranges from 10 to 25 km. Most of the zone is underwater and so macroseismic data are not abun-dant. The maximum reported historical magnitude is M=6.1
-1200 -1000 -800 -600 -400 -200 0 0 50 100 150 200 250 300 350 400 d e p th (m) epicentral distance (km) -200 0 0 50 100 150 200 250 300 d e p th (m) -200 0 0 50 d e p th (m) DU VE SP -200 0 0 50 100 d e p th (m)
bathymetric profile modeled profile
OR
Fig. 2. Bathymetric profiles (in blue) along source-site paths and their parameterisations (in black) used for calculations for the four sites of Zone 1. From above: Venice (VE), Durres (DU), Ortona (OR) and Split (SP).
v -0.04 -0.02 0 0.02 0.04 0.06 0.08 0 50 100 150 200 Amp lit u d e (m) time (min) OR SP DU VE
Fig. 3. Synthetic mareograms for Zone 1. Focal depth, H =10 km (blue), 15 km (red), 25 km (green). Magnitude: M=6.5.
(Musson, 1999). Even according to the most pessimistic es-timates, earthquakes with magnitude lower than 6.0 generate tsunamis with maximum amplitude of the order of a few cen-timetres, therefore we study events with much higher values of magnitude (i.e. 6.5, 7.0 and 7.5) to emphasise the tsunami-genic effect. Three values of focal depth are used in the cal-culations: 10, 15 and 25 km.
The focal mechanism fixed for all simulations is a thrust, with dip angle of 45 degrees (T45). The location of the epi-center is fixed at the point of coordinates 43.20◦N, 15.21◦E, near the central Adriatic pit, in correspondence of the 29 March 2003 earthquake of magnitude M=5.52. The liquid
2Blasetti, C.: Bachelor Degree in Physics, Thesis work with
ti-Table 2. Main parameters identifying the four sites of Zone 2.
Site Latitude Longitude Epicentral dist. R Durres (DU) 41.32◦N 19.45◦E 547 km Ortona (OR) 42.35◦N 14.40◦E 158 km Venice (VE) 45.42◦N 12.37◦E 219 km Zadar (ZA) 44.12◦N 15.22◦E 143 km -0.004 -0.002 0 0.002 0.004 0.006 0.008 0 50 100 150 200 Amp lit u d e (m) time (min) OR ZA VE DU
Fig. 4. Synthetic mareograms for Zone 2. Focal depth, H =10 km (blue), 15 km (red), 25 km (green). Magnitude: M=6.0.
layer above the source is 200 m thick. Four sites are chosen, in correspondence of the cities of Durres, Ortona, Split and Venice. The main parameters identifying each site are listed in Table 1. In Fig. 2 we show as an example the bathymet-ric profiles and their parameterisations along the source-site paths for the four sites of Zone 1. The synthetic mareograms calculated at the four sites for magnitude M=6.5 are shown in Fig. 3.
3.1.2 Zone 2: Eastern Italian coast
This zone comprehends the Adriatic coasts of Central Italy, from Ravenna to San Benedetto del Tronto. The seismicity is determined by the passive subduction of the Adriatic plate under the Northern Apennines (Slejko et al., 1999). The fo-cal mechanisms are mainly thrust and strike-slip (ZS9), with focal depth ranging from 10 to 25 km. The maximum mag-nitude reported on the historical catalogues is M=6.0 (NT4). For the simulations magnitude values of 6.0, 6.5 and 7.0 are chosen. Three values of focal depth are used in the calcu-lations: 10, 15 and 25 km. The location of the represen-tative epicenter used for the modelling is chosen offshore, at the point of coordinates 43.65◦N, 13.55◦E, in correspon-dence of the epicenter of the 1972 earthquake of magnitude 5.1 (CFT, NT4.1, CEE), about 10 km far from the coast of Ancona. The liquid layer above the source is 50 m thick. The receiving sites are chosen in correspondence of the cities of Durres, Ortona, Venice, and Zadar. The main parame-ters identifying each site are listed in Table 2. The synthetic
tle: “Simulazione di tsunami in Adriatico”, Universit`a degli Studi di Trieste, 2003.
-0.04 -0.02 0 0.02 0.04 0.06 0.08 0 50 100 150 200 Amp lit u d e (m) time (min) OR DU SP VE
Fig. 5. Synthetic mareograms for Zone 3-a. Focal depth, H =10 km (blue), 20 km (red), 30 km (green). Magnitude: M=6.5.
mareograms calculated at the four sites for magnitude M=6.5 are shown in Fig. 4.
3.1.3 Zone 3-a: Gargano peninsula, offshore source
Table 3. Main parameters identifying the four sites of Zone 3-a, offshore source case.
Site Latitude Longitude Epicentral dist. R Durres (DU) 41.32◦N 19.45◦E 331 km Ortona (OR) 42.35◦N 14.40◦E 102 km Split (SP) 43.52◦N 16.43◦E 170 km Venice (VE) 45.42◦N 12.37◦E 451 km
This zone includes the Gargano peninsula, from the border between Puglia and Molise to Zapponeta, south of Manfredo-nia, and the Tremiti islands. The seismicity is of intra-plate type (Slejko et al., 1999). The typical focal mechanism is dip-slip, the focal depth ranges from 10 to 30 km. The maxi-mum historical magnitude reported on earthquake catalogues is M=7.0, but it usually does not exceed M=6.0 (ZS9). Zone 3 is of particular interest because it includes the most intense tsunami ever witnessed on the whole Adriatic domain. In 1627, an earthquake with epicenter near Capitanata caused a tsunami that hit severely the coasts of Gargano. According to the available data this was the largest tsunami in the Adriatic Sea (Caputo and Faita, 1984). The location of the event is still cause of controversy: most studies fix the epicenter in-side the coastline (Panza et al., 1991), others put it offshore (e.g. Tinti and Piatanesi, 1996) We study both cases, there-fore we distinguish a Zone 3-a (offshore case) and a Zone 3-b (inland case).
For the offshore case, modeled by the modal method, the chosen values for magnitude are 6.0, 6.5 and 7.0. The studied values of focal depth are 10 km, 20 km and 30 km. The rep-resentative epicenter is fixed near the Tremiti islands, at the point of coordinates 42.10◦N, 15.60◦E in correspondence of the epicenter of the 1908 earthquake of magnitude 4.4 (as given by NT4.1), about 20 km offshore from the coast of
Table 4. Main parameters identifying the four sites of Zone 4.
Site Latitude Longitude Epicentral dist. R Ancona (AN) 43.63◦N 13.50◦E 519 km Bari (BA) 41.12◦N 16.85◦E 184 km Dubrovnik (DB) 42.63◦N 18.12◦E 150 km Durres (DU) 41.32◦N 19.45◦E 55 km -0.2 -0.1 0 0.1 0.2 0.3 0.4 0 20 40 60 80 100 120 140 160 Amp lit u d e (m) time (min) DU DB BA AN
Fig. 6. Synthetic mareograms for Zone 4. Focal depth, H =10 km (blue), 20 km (red), 30 km (green). Magnitude: M=7.0.
Gargano. The liquid layer above the source is 100 m thick. The sites are chosen in correspondence of the cities of Dur-res, Split, Venice and Ortona. The main parameters identify-ing each site are listed in Table 3. The synthetic mareograms calculated at the four sites for magnitude M=6.5 are shown in Fig. 5.
3.1.4 Zone 4: Northern Albanian coast
This zone includes the coastal region of Albania, from the border with Montenegro to latitude 40.50◦N. The seismicity is determined by the subduction of the Adriatic plate under the Albanides (Slejko et al., 1999). The typical focal mecha-nisms are thrust and strike-slip, the maximum historically re-ported magnitude is 7.3 (ECCSE), the strongest in the Adri-atic region. The focal depth ranges from 10 to 30 km. The values of magnitude chosen for simulations are 6.5, 7.0 and 7.5, the values of focal depth are 10 km, 20 km and 30 km. The representative epicenter is located at the point of coor-dinates 41.50◦N, 19.00◦E, in correspondence with the
epi-center of the 346 AD earthquake of magnitude 7.3 as given by Shebalin et al. (1997). The liquid layer above the source is 180 m thick. The sites are chosen in correspondence of the cities of Ancona, Bari, Durres and Dubrovnik. The main parameters identifying each site are listed in Table 4. The synthetic mareograms calculated at the four sites for magni-tude M=7.0 are shown in Fig. 6.
Table 5. Main parameters identifying the four sites of Zone 5.
Site Latitude Longitude Epicentral distance R Bari (BA) 41.12◦N 16.85◦E 184 km Dubrovnik (DB) 42.63◦N 18.12◦E 20 km Durres (DU) 41.32◦N 19.45◦E 172 km Ortona (OR) 42.35◦N 14.40◦E 304 km -0.6 -0.4 -0.2 0 0.2 0.4 0.6 0.8 1 0 20 40 60 80 100 120 140 Amp lit u d e (m) time (min) DB DU BA OR
Fig. 7. Synthetic mareograms for Zone 5. Focal depth, H =10 km (blue), 20 km (green), 30 km (red). Magnitude: M=7.0.
3.1.5 Zone 5: Southern Croatia, Bosnia Herzegovina and Montenegro
This zone includes the coasts of Southern Croatia, from the island of Hvar to the border with Bosnia Herzegovina, and the coasts of Bosnia Herzegovina and Montenegro. The seis-micity is determined by the subduction of the Adriatic plate under the Dinarides. The typical focal mechanisms are dip-slip and strike-dip-slip. The maximum reported magnitude is 7.2 (Aliaj et al., 2004). The typical focal depth ranges from 10 to 30 km. The values of magnitude chosen for simulations are 6.5, 7.0 and 7.5, the values of focal depth are 10 km, 20 km and 30 km. The representative epicenter is chosen at the point of coordinates 42.30◦N, 18.10◦E off the coasts of Croatia,
near the city of Dubrovnik, in correspondence with the epi-center of the 1520 earthquake of magnitude 6.5 (ECCSE). The liquid layer above the source is 200 m thick. The sites are chosen in correspondence of the cities of Bari, Durres, Ortona and Dubrovnik. The main parameters identifying each site are listed in Table 5. The synthetic mareograms calculated at the four sites for magnitude M=7.0 are shown in Fig. 7.
3.2 Inland sources
Zone 3-b and Zone 6 are representative of the inland source case. For each zone we choose the parameterisation of a rep-resentative event, the 1627 earthquake and tsunami for Zone 3-b and the 1511 earthquake and tsunami for Zone 6, that we fix as a reference point for the calculation of scenarios varying a number of parameters.
Table 6. Main parameters identifying the three sites of Zone 3-b, inland source case.
Site Latitude Longitude Epicentral dist. R Lesina (LE) 41.86◦N 15.35◦E 20 km, 30 km Tremiti (TM) 42.16◦N 15.52◦E 30 km, 40 km Split (SP) 43.52◦N 16.45◦E 210 km, 220 km
Until now the Green’s function method has been imple-mented only for the case of laterally homogeneous structures, and therefore only for non laterally varying bathymetries. Anyway, for our calculations this is not a limitation since the profiles analysed by means of this method do not present complex bathymetries. In fact, in the Adriatic domain, due to the small extension of the basin and to the shallow aver-age water depth, most cases involve stations not far from the source and with an almost constant bathymetric source-site profile, well modeled by a laterally homogeneous structure with constant water depth. We consider a liquid layer of con-stant thickness, which averages the value of the sea depth along the source-site path.
3.2.1 Zone 3-b: Gargano Peninsula, inland source
To study the inland case of Zone 3 we consider an approach different from the one used in all zones previously treated. Since the modal theory requires the presence of a liquid layer above the epicenter, we use the Green’s function approach, introduced in Sect. 2. The same approach will be used for Zone 6, which is totally located inside the coastline. The values of magnitude chosen for simulations are 6.5 and 7.0. Since the distance of the source from the coast is of major importance in this approach, two epicenters are studied: one situated 20 km inland near the town of San Severo, corre-sponding approximately to the epicenter of the 1627 earth-quake, as given by Boschi et al. (2000); the other situated 10 km inland. Two different focal mechanisms are consid-ered, both thrust, but with different dipping angle: 45 and 75 degrees. The focal depth is 15 km. We consider three sites, all set in the direction orthogonal to the fault, at different dis-tances from the coast, corresponding to the town of Lesina, the Tremiti islands and the city of Split. The water layer tickness is taken to be 20 m for Lesina, 40 m for Tremiti and 100 m for Split. The relevant parameters identifying each site are listed in Table 6. The synthetic mareograms calculated at the three sites are shown in Fig. 8.
3.2.2 Zone 6: Julia and Friuli
This zone includes The Eastern Alps of Friuli Venezia Giulia and Slovenia, it is totally located inland, but there are ev-idences of a number of tsunamis generated by earthquakes located in this zone reported in the catalogues (ATS).
-0.4 -0.3 -0.2 -0.1 0 0.1 0.2 Amp lit u d e (m) -0.4 -0.3 -0.2 -0.1 0 0.1 0.2 0 20 40 60 80 100 120 140 Amp lit u d e (m) time (min) LE LE TR TR SP SP
Fig. 8. Synthetic mareograms for Zone 3-b, magnitude, M=7.0. Above: dip angle=45◦; below: dip angle=75◦. Blue line, d=10 km; red line, d=20 km.
In particular a tsunami is reported in this area correspond-ing to the 1511 earthquake. This event caused severe dam-age to the buildings because of the strong shocks and also may have generated a tsunami observed in the whole North-ern Adriatic area, specially in Trieste, where the docks and the lower city where inundated. The local chronicles report the effects of the shocks and the inundation:
“Si sentirono orribilissimi terremoti, uno de’ quali, il 26 marzo (1511), tra le ore due e le tre dopo mez-zogiorno, spaventoso, due torri del porto atterro‘ con molte mura e case... molti villaggi restarono rovinati, e si grande era l’accrescimento del mare, che gli abitanti di Trieste si trasportarono ad allog-giare sotto il castello (Kandler, 1863)3”.
This event is still cause of debate, since it is not clear whether the inundation was directly caused by the earth-quake. Our purpose is not to model in detail this specific event, since our method is not suitable to simulate the sea level displacement very near the coast. Thus further calcula-tions, e.g. with numerical methods, may be needed to solve this controversy.
The seismicity of this region is determined by the clash be-tween the Adriatic plate and the Alps, the typical focal mech-anism is thrust (Slejko et al., 1999). The typical focal depth is about 8 km (ZS9). For the calculation of tsunami scenarios we use as a starting point the parameterisation of the 1511 earthquake, as given by Fitzko et al. (2005) with magnitude
3Translation: “Terrible earthquakes were felt, one of them
oc-curred the 26th of March (1511) between two and three o’clock in the afternoon, it knocked down two towers in the docks and many walls and buildings (in Trieste)... many villages were reduced to ravines and the sea level grew so much that the inhabitants of Tri-este had to move under the castle”.
Table 7. Main parameters identifying the three sites of Zone 6.
Site Latitude Longitude Epicentral dist. R Trieste (TS) 45.67◦N 13.77◦E 30 km, 50 km Venice (VE) 45.45◦N 12.35◦E 130 km, 150 km Ravenna (RA) 44.42◦N 12.20◦E 210 km, 230 km -0.06 -0.04 -0.02 0 0.02 0.04 0.06 0 50 100 150 200 250 Amp lit u d e (m) time (min) -0.06 -0.04 -0.02 0 0.02 0.04 0.06 Amp lit u d e (m) TS TS VE VE RA RA
Fig. 9. Synthetic mareograms for Zone 6, magnitude, M=7.0. Above: dip angle=45◦; below: dip angle=30◦. Blue line, d=20 km; red line, d=40 km.
M=7.0. We first fix the distance of the source from the coast to be d=40 km, the epicentral distance R=50 km for Trieste, R=150 km for Venice and R=230 km for Ravenna and the focal depth H =10 km. Successively more scenarios are cal-culated reducing the distance of the source from the coast to 20 km and considering different values of magnitude (6.5 and 7.0). According to Pinat et al. (2005) two focal mechanisms are considered: a T45 and a thrust fault with dipping angle of 30◦. The relevant parameters identifying each site are listed in Table 7. The synthetic mareograms calculated at the three sites are shown in Fig. 9.
4 Discussion of results
We computed synthetic mareograms for a number of tsunamigenic areas in the Adriatic Sea. Here we discuss first the results obtained for the offshore source cases (zones 1, 2, 3-a, 4, 5) which were modeled with the modal approach, then the results for the inland source cases (zones 3-b and 6), studied with the Green’s functions approach.
All travel times reported in Tables 8-14 are for the maxi-mum amplitude peak.
4.1 Offshore sources
We point out some general aspects resulting from the calcu-lations; the effect of each parameter is considered keeping all
Table 8. Maximum amplitudes and travel times for the four sites of Zone 1. Scenarios are calculated for three values of magnitude, M=6.5, 7.0, 7.5, and three values of focal depth, H =10, 15, 25 km. Amplitudes are reported in meters. Amplitudes exceeding 1 m are written in bold style. M 6.5 7.0 7.5 Travel H (km) 10 15 25 10 15 25 10 15 25 time (min) Durres 0.02 0.01 <0.01 0.11 0.06 0.03 0.60 0.33 0.15 109 Ortona 0.07 0.04 0.02 0.40 0.22 0.10 2.25 1.22 0.54 23 Split 0.06 0.03 0.01 0.32 0.17 0.08 1.80 0.98 0.43 31 Venice 0.03 0.02 0.01 0.17 0.09 0.04 0.97 0.53 0.24 188
Table 9. Maximum amplitudes and travel times for the four sites of Zone 2. Scenarios are calculated for three values of magnitude, M=6.0, 6.5, 7.0, and three values of focal depth, H =10, 15, 25 km. Amplitudes are reported in meters. Amplitudes exceeding 1 m are written in bold style. M 6.0 6.5 7.0 Travel H (km) 10 15 25 10 15 25 10 15 25 time (min) Durres <0.01 <0.01 <0.01 0.01 <0.01 <0.01 0.05 0.02 0.01 178 Ortona 0.01 <0.01 <0.01 0.04 0.02 0.01 0.24 0.12 0.05 42 Venice <0.01 <0.01 <0.01 0.02 0.01 0.01 0.13 0.07 0.03 135 Zadar 0.01 <0.01 <0.01 0.03 0.01 0.01 0.15 0.08 0.03 84 others fixed.
– The greater is magnitude the larger is the maximum
am-plitude. Events with magnitude M=6.0 (which is nearly the maximum magnitude in many regions of the Adri-atic domain) generate tsunamis with amplitudes of a few centimetres. The shoaling and other amplification phe-nomena due to the local morphology, could increase that amplitude up to some factors, enough to cause small damages and inundations, specially if coinciding with the high tide or a sea storm (e.g. in Venice).
– The larger is the focal depth the smaller is the maximum
amplitude. According to the modal summation theory, when a source is located deeper inside the Earth inte-rior it is less efficient in exciting the high frequencies, so their contribute to the total displacement at the sea bottom is reduced. It follows that shallow earthquakes are more capable than deep ones to generate tsunamis.
– Increasing the epicentral distance, the maximum
ampli-tude decreases, if we exclude local effects. This is due to the fact that the radiation pattern is attenuated by the geometrical spreading as we move the site far from the source.
– The water layer thickness affects amplitude in two
ways: i) Where the depth of the liquid layer is thicker tsunami waves are faster and the geometrical spread-ing is more intense, e.g. the source-site paths cross-ing the southern-Adriatic ridge, where the water thick-ness reaches 1200 m, present a reduction of travel times
and maximum amplitudes (compared with travel paths with the same epicentral distance); ii) Sources set un-der a thinner water layer are less effective in generating tsunamis (e.g. compare Zone 1 with Zone 2)
– The maximum overall amplitude is about 5 m,
calcu-lated at the site set in correspondence of the city of Dubrovnik for a magnitude 7.5 event with epicenter in Zone 5.
We analyse now each zone separately. Zone 1
Zone 1 is important for its central position in the Adriatic Sea. We note that although the epicenter chosen for the sim-ulations is closer to the Croatian coast than to the Italian one, travel times are shorter and the maximum amplitude is larger for the site in Ortona than for the site in Split. This is due to the fact that the travel path from the epicenter to Ortona runs along the central Adriatic pit where, since the water layer is thicker, the waves move faster. The Croatian coasts are sheltered by the presence of many islands and are highly un-even, so the effect of a wave reaching the coast would depend strongly on the local morphology, being amplified at some sites and attenuated in others.
The amplitudes at the site in Durres are strongly reduced, but the travel time is relatively short, just 1 h and 50 min to cover more than 400 km. In Venice the maximum amplitude is just under 1 m for the M=7.5 event, while a more real-istic scenario with M=6.5 and a focal depth of 15 km
pro-Table 10. Maximum amplitudes and travel times for the four sites of Zone 3, offshore source case. Scenarios are calculated for three values of magnitude, M=6.0, 6.5, 7.0, and three values of focal depth, H =10, 15, 25 km. Amplitudes are reported in meters. Amplitudes exceeding 1 m are written in bold style.
M 6.0 6.5 7.0 Travel H (km) 10 15 25 10 15 25 10 15 25 time (min) Durres <0.01 <0.01 <0.01 0.01 <0.01 <0.01 0.05 0.02 0.01 57 Ortona 0.01 <0.01 <0.01 0.07 0.02 0.01 0.41 0.13 0.04 26 Split 0.01 <0.01 <0.01 0.03 0.01 <0.01 0.16 0.06 0.02 68 Venice <0.01 <0.01 <0.01 0.02 0.01 <0.01 0.10 0.03 0.01 215
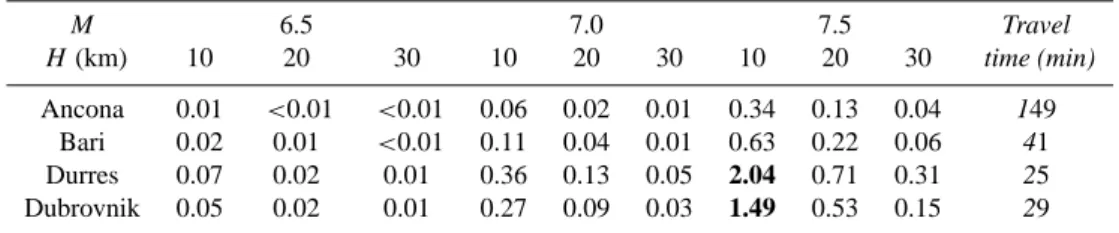
Table 11. Maximum amplitudes and travel times for the four sites of Zone 4. Scenarios are calculated for three values of magnitude, M=6.5, 7.0, 7.5, and three values of focal depth, H =10, 20, 30 km. Amplitudes are reported in meters. Amplitudes exceeding 1 m are written in bold style. M 6.5 7.0 7.5 Travel H (km) 10 20 30 10 20 30 10 20 30 time (min) Ancona 0.01 <0.01 <0.01 0.06 0.02 0.01 0.34 0.13 0.04 149 Bari 0.02 0.01 <0.01 0.11 0.04 0.01 0.63 0.22 0.06 41 Durres 0.07 0.02 0.01 0.36 0.13 0.05 2.04 0.71 0.31 25 Dubrovnik 0.05 0.02 0.01 0.27 0.09 0.03 1.49 0.53 0.15 29
duces a wave of just 2 cm. The travel time is more than three hours, this would be enough to alert the local authorities re-sponsible for mitigating the hazard, in presence of a suitable alarm network. The region most exposed to tsunamis from this zone seems to be the Italian coast from Ancona to the Gargano peninsula. Maximum amplitudes and travel times are reported in Table 8.
Zone 2
A tsunami generated by an earthquake located in Zone 2 would hit more seriously the Italian coasts than the Croat-ian ones, but the sources in this region are less effective in tsunami genesis because they are located under a shallow liquid layer. Calculations for scenarios with magnitude 6.0 give maximum amplitudes lower than a centimeter at the four sites, not enough to represent a relevant hazard. Amplitudes in the region very near to the epicenter (tens of kilometers) could be more relevant. The maximum amplitude is that cal-culated in Ortona for the event with magnitude 7.0 and focal depth 10 km, that reaches 24 cm. Maximum amplitudes and travel times are reported in Table 9.
Zone 3-a
For Zone 3-a amplitudes calculated are significant only at the site of Ortona and are elsewhere of the order of a few centimetres. Waves can be high in the vicinity of the epicen-ter. In general offshore sources in Zone 3 seem to be unable to generate intense tsunamis due to the low seismicity of the
area. Maximum amplitudes and travel times are reported in Table 10.
Zone 4
Severe tsunamis can be generated by sources located in Zone 4 due to the high seismicity of the region. The Eastern coasts of the Adriatic basin are more exposed, while the Italian coasts seem to be somehow protected by the presence of the southern Adriatic ridge. Events of magnitude 7.0 or higher can generate relevant amplitudes in the whole Southern Adri-atic Sea. Events of magnitude 6.5 or lower would be relevant only in the proximity of the epicenter. Maximum amplitudes and travel times are reported in Table 11.
Zone 5
Among all the epicenters fixed for the offshore source cases, the epicenter fixed for Zone 5 seems to be the most effec-tive. As already mentioned, the overall maximum amplitude is calculated at the site of Dubrovnik where it reaches about 5 m. The event of magnitude 7.0 gives wave heights of al-most 1 m in the vicinity of the epicenter. All considerations made for Zone 4 hold for Zone 5 as well. Maximum ampli-tudes and travel times are reported in Table 12.
Table 12. Maximum amplitudes and travel times for the four sites of Zone 5. Scenarios are calculated for three values of magnitude, M=6.5, 7.0, 7.5, and three values of focal depth, H =10, 20, 30 km. Amplitudes are reported in meters. Amplitudes exceeding 1 m are written in bold style. M 6.5 7.0 7.5 Travel H (km) 10 20 30 10 20 30 10 20 30 time (min) Bari 0.02 0.01 <0.01 0.09 0.03 0.01 0.50 0.18 0.05 42 Durres 0.05 0.02 0.01 0.29 0.10 0.03 1.62 0.56 0.15 48 Ortona 0.02 0.01 <0.01 0.12 0.04 0.01 0.67 0.24 0.07 112 Dubrovnik 0.16 0.05 0.02 0.89 0.31 0.08 4.98 1.72 0.47 4
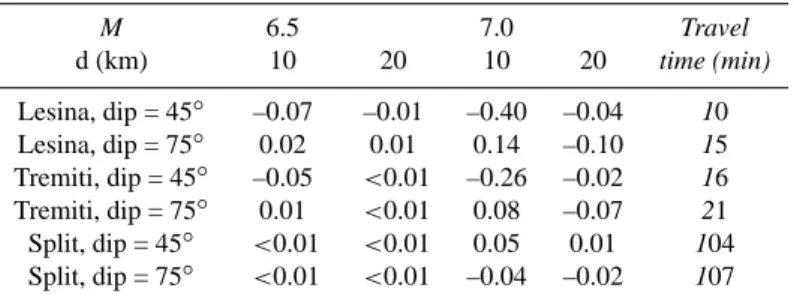
Table 13. Maximum amplitudes and travel times for the three sites of Zone 3-b, inland source case. Scenarios are calculated for two values of magnitude, M=6.5, 7.0, two values of the inland distance of the source from the coast, d=10 km, 20 km and two values of the dipping angle, dip=45◦, 75◦. Travel times reported are referred to the maximum amplitude peak. Other travel times can differ by a few minutes. Amplitudes are reported in meters.
M 6.5 7.0 Travel d (km) 10 20 10 20 time (min) Lesina, dip = 45◦ –0.07 –0.01 –0.40 –0.04 10 Lesina, dip = 75◦ 0.02 0.01 0.14 –0.10 15 Tremiti, dip = 45◦ –0.05 <0.01 –0.26 –0.02 16 Tremiti, dip = 75◦ 0.01 <0.01 0.08 –0.07 21 Split, dip = 45◦ <0.01 <0.01 0.05 0.01 104 Split, dip = 75◦ <0.01 <0.01 –0.04 –0.02 107 4.2 Inland sources Zone 3-b
Amplitudes calculated for Zone 3-b (inland source case) reach a maximum of about 40 centimetres, at the site of Lesina, for an event of magnitude 7.0. The maximum am-plitude corresponds to a negative peak and thus to a retreat of the sea, in accordance with the observations of the 1627 earthquake and tsunami. With the considered configuration, the most effective focal mechanism is a thrust fault with dip angle of 75◦, the case with dip angle of 45◦results in smaller amplitudes. The distance of the source from the coastline is of main importance in determining the intensity of the re-sulting tsunami, sources closer to the coastline are more ef-fective. Waves amplitudes of a few centimetres can be ex-pected on the opposite side of the basin, in correspondence of Split. Maximum amplitudes and travel times are reported in Table 13.
Zone 6
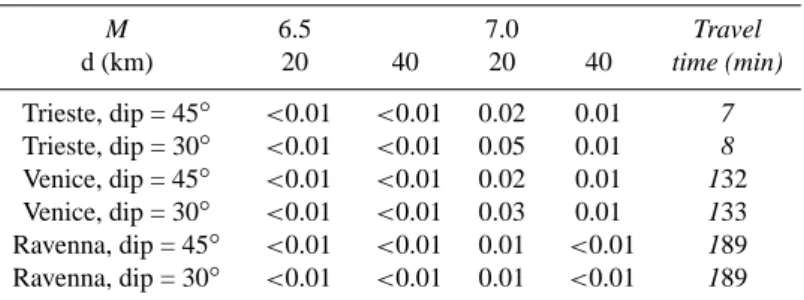
The results of our calculations suggest that only small tsunamis can be generated by inland sources in Zone 6. The maximum amplitude calculated reaches 5 cm in Trieste. A more detailed modelling, with near-field and near-source ef-fects taken into account, is needed to properly simulate the impact of a tsunami on the shoreline near the seismic source.
All considerations made for Zone 3-b hold for Zone 6 as well. Maximum amplitudes and travel times are reported in Table 14.
General remarks
We assess the estimated hazard from tsunami events in the Adriatic Sea resulting from our calculations.
In the upper Adriatic Sea, excluding events of very high magnitude (M>7.0) no serious risk seems to be represented by sources located in Zone 6. Waves of amplitude up to a few centimetres can be expected. Tsunamis generated by earth-quakes in all other zones would take a relatively long time (2–4 h) to reach the Northern coasts, because of the small thickness of the water layer, and find their amplitude con-siderably reduced. In the case of a serious hazard, thanks to the long travel times, it could be possible, in presence of a monitoring and alert network, to warn the population and take suitable measures to mitigate damage in the harbours and coastal industrial areas.
In the central Adriatic Sea, earthquakes located in Zone 1 and 2 do not represent a serious hazard for the whole Adriatic Sea, because of the low seismicity (excluding the possibility of earthquakes with magnitude much higher than the maxi-mum historical value), but they can represent a potential haz-ard in the vicinity of the epicenter. The historical seismicity suggests that in Zone 3 severe events can occur, with waves of amplitude up to a few meters that can represent a
seri-Table 14. Maximum amplitudes and travel times for the three sites of Zone 6, inland source case. Scenarios are calculated for two values of magnitude, M=6.5, 7.0, two values of the inland distance of the source from the coast, d=20 km, 40 km and two values of the dipping angle, dip=45◦, 30◦. Travel times reported are referred to maximum amplitude peaks. Amplitudes are reported in meters.
M 6.5 7.0 Travel d (km) 20 40 20 40 time (min) Trieste, dip = 45◦ <0.01 <0.01 0.02 0.01 7 Trieste, dip = 30◦ <0.01 <0.01 0.05 0.01 8 Venice, dip = 45◦ <0.01 <0.01 0.02 0.01 132 Venice, dip = 30◦ <0.01 <0.01 0.03 0.01 133 Ravenna, dip = 45◦ <0.01 <0.01 0.01 <0.01 189 Ravenna, dip = 30◦ <0.01 <0.01 0.01 <0.01 189
ous hazard for the population. The potentially most danger-ous sources are located inland, so arrival times on the Italian coasts would be too short (a few minutes after the shock) for any alarm system to act efficiently.
In the Southern Adriatic Sea, the coasts of Southern Croa-tia, Bosnia Herzegovina, Montenegro and Albania present the highest seismicity in the Adriatic domain, with the possi-bility of very strong events (M>7.0). Maximum amplitudes calculated on the Eastern coast are of a few meters, but they hardly reach 1 meter on the Western coast.
5 Conclusions
The results of our calculations suggest that a tsunami with maximum amplitude up to a few meters can be expected also in the Adriatic Sea, in agreement with a number of historical events reported in the catalogues.
For the offshore sources, as expected, the maximum tsunami amplitudes coincide with the highest magnitude of the generating event and with the minimum focal depth.
An inland source is less efficient in the tsunamigenic effect than an analogous offshore source. The maximum tsunami height is caused by the closest-to-coast source with the high-est magnitude. Fault mechanism, focal depth and water layer thickness also affect tsunami generation and propagation.
Within the Adriatic Sea, the region most prone to generate tsunamis seems to be the Eastern coast of the basin, where the Adriatic plate presses against the Dinarides and the Al-banides. Other regions where this phenomenon can occur are the Gargano Peninsula, the Eastern coasts of Central Italy and the Italian coasts on the Northern part of the basin.
Even though the cases of a smaller magnitude and deeper event are more frequent (both in the case of offshore and in-land sources), the use of the maximum credible values for calculating the tsunami risk is fundamental in the framework of protecting the Adriatic Sea coasts, specially in such a small and densely urbanised area that do not allow enough time to warn the population after a detection is made.
It has also to be taken into account that even if the seismic-ity in the Adriatic area is not high, the sea tide is, on average,
twice that of the Mediterranean Sea and the coasts are gen-erally quite shallow. In other words a modest tsunami wave of a couple of meters, may superimpose to a high tide of the order of the meter and thus cause major damages, if not loss of life, in a large number of coastal urban settlements. Partic-ularly in cases like this the identification of the tsunamigenic sources driving the hazard is of great importance for a proper tsunami risk assessment.
Appendix A
Catalogue of reported tsunami events in the Adriatic Sea (from 58 BC to 1979 AD)4
This catalogue furnishes a collection of the reported tsunamis within the Adriatic Sea, i.e. the Italian coasts from the Strait of Otranto to the gulf of Trieste, the coasts of Slovenia, Croa-tia, Serbia, Bosnia Herzegovina, Montenegro and Albania. The events are obtained by cross-comparison between many existing catalogues, in order to extract all the reported ones. For each tsunamigenic event, when present in a catalogue, we report: origin time, location, macroseismic intensity, mag-nitude and the areas (within Adriatic basin) where tsunamis have been reported. In the last column of the table, all the cat-alogues in which some information on the event (earthquake and tsunami) is reported, are listed; bold letters indicate the main reference catalogue for that event (i.e. the catalogue where the origin time has been taken from). Since in the present catalogue more attention is paid to the tsunamis than to the seismic events, the bold reference indicates always the tsunami catalogue, and not the earthquake catalogue, when contemporarily available. For some events there are no records of a related tsunami (they are labeled as N.A.T.R.= not available tsunami report) but they are included since their location and magnitude suggest a tsunamigenic potential.
4Adapted from: Pinat, T., Romanelli, F., and Panza G. F.:
“Cat-alogue of reported tsunami events in the Adriatic Sea (from 58 BC to 1979 AD)”, ICTP Internal Report 2005, IC/IR/2005/1
A0.1 Reference catalogues used for tsunamigenic events
– AM: Ambraseys (1962) – CF: Caputo and Faita (1984) – BC: Bedosti and Caputo (1986) – PA: Papadopoulos (2001)
– ITC: Italian Tsunami Catalogue (Tinti et al., 2004)
– TMS: Soloviev et al. (2000)
A0.2 Reference catalogues used for related earthquakes
– CFT: Catalogo dei Forti Terremoti (Boschi et al., 2000) – NT4.1: NT4.1 catalogue (Camassi and Stucchi, 1998) – CO: Copernicus Catalogue (Musson 1996, 2000)
Table A1. Reported tsunami events in the Adriatic Sea (from 58 BC to 1979 AD).
n Time dd/mm/yy Related Earthquake Location Lat-Lon
Intensity (I ) Magnitude (M)
Area of reported tsunami (within Adri-atic basin)
Reference Cat-alogues
1 58 B.C. (PA) 41.18–19.36 Albanian coasts, Durres PA, AM,TMS 2 346 A.D. (PA) 41.24–19.24 (PA) I =IX; M=6.8 Albania, Durres PA
3 21/7/365 (or 369) (CF) 35.00-25.00 (CF) I =XI Adriatic coasts CF, PA, AM
4 558 Ancona and
neighbour-ing area
BC
5 30/4/792 (or 793) (CF) 45.3–11.0 (CF) I =IX Gulf of Venice, Adri-atic coasts, Istria
CF, AM, TMS
6 ?/3/1106 (CF, BC) 45.28–12.20; (CFT) 45.28-12.20
(CF) I =VIII Gulf of Venice CF, BC, CFT, AM, TMS 7 ?/9/1273 (NT4.1) M=5.9 Albanian coasts,
Dur-res, Potenza AM, NT4.1, TMS 8 1302 Rimini coast BC 9 ?/12/1303 Adriatic coasts AM 10 ?/?/1321 (CF) 45.25–12.20; (CFT) 45.25–12.20
(CF) I =VIII Gulf of Venice CF, CFT, TMS
11 ?/?/1323 (CFT) 44.30–11.20; (NT4.1) 45.20 14.70 (CFT) I =VI-VII, M=4.2; (NT4.1) M=6.2 N.A.T.R. CFT, NT4.1 12 13/3/1331 (CF) 44.10–12.15 Adriatic coasts CF 13 25/1/1348 (CF) 46.36–13.50; (CFT) 46.22–13.35; (NT4.1) 46.50– 13.45 (CF) I =XI; (CFT) I =IX, M=6.9; (NT4.1) M=6.4 Gulf of Venice CF, CFT, NT4.1, TMS
Table A1. Continued. 15 26/3/1511 (CF) 46.15–13.20; (CFT, ITC) 46.12–13.26; (NT4.1) 46.26– 13.26 (CF) I =X; (CFT) I =X, M=6.8; (ITC) I =IX, M=6.5; (NT4.1) M=6.2
Gulf of Venice, Trieste CF, CFT, ITC, NT4.1, TMS
16 17/5/1520 (CO) 42.60–18.10 (CO) M=6.7 N.A.T.R. CO 17 (18 or) 19/3/1624 (CF) 44.35–11.50; (CFT)
44.39–11.51; (NT4.1) 44.66– 11.91
(CF) I =X; (CFT) I =VIII-IX, M=5.5; (NT4.1) M=5.5
Delta Padano, Argenta CF, CFT, NT4.1, TMS 18 30/7/1627 (CF) 41.50–15.20; (CFT, ITC) 41.44–15.21; (NT4.1) 41.73– 15.26 (CF) I =IX; (CFT) I =X; M=6.8; (NT4.1) M=7 Coasts of Gargano, Capitanata CF, ITC, CFT, NT4.1, TMS 19 6/9/1627 (BC) 42.00–15.00; (CFT) 41.36–15.21 (BC) I =VI-VII; (CFT) I =VIII-IX, M=5.7
Mouth of Fortore river, Coast of Gargano, Cen-tral Adriatic BC, CFT 20 31/5/1646 (CF) 41.50–15.50; (BC) 38.30– 15.70; (CFT) 41.52–15.56; (NT4.1) 41.83–16.00 (CF) I =IX; (BC) I =VI; (CFT) I =IX-X, M=6.1; (NT4.1) M=6.4 Coast of Gargano CF, BC, CFT, NT4.1
21 22/4/1661 Gulf of Venice and
Central Adriatic coasts
CF, TMS
22 6/4/1667 (CF) 42.30–18.15; (PA) 42.36– 18.06
(PA) I =IX, M=7.2 Dalmatian coasts and Italian Adriatic coasts, South Adriatic
CF, PA, AM, TMS
23 30/11/1667 Adriatic coasts, Venice CF, PA, AM, TMS 24 14/4/1672 (CF) 44.00–12.45;0 (CFT, ITC) 43.56–12.35; (NT4.1) 44.08– 12.66 (CF) I =IX; (CFT) I =VIII, M=5.6; (NT4.1) M=5.5
Central Adriatic coasts (Rimini) CF, CFT, ITC, NT4.1, PA 25 8/91694 (CF) 40.48–15.35; (CFT) 40.53–15.21; (NT4.1) 40.90– 15.43 (CF) I =X; (CFT) I =XI, M=46.8; (NT4.1) M=7
Apulian Adriatic coasts (Brindisi, Bari) CF, CFT, NT4.1, TMS 26 12/1/1721 (NT4.1) 45.30–14.40 (NT4.1) M=6.2 N.A.T.R. NT4.1 27 20/3/1731 (CF) 41.30–15.30; (CFT, ITC) 41.16–15.45; (NT4.1) 41.31– 15.80 (CF) I =X; (CFT) I =IX, M=6.6; (NT4.1) M=6.2
Apulia coasts (Siponto and Barletta) CF, CFT, ITC, NT4.1 28 20/2/1743 (CF) 40.30–17.35; (CFT, ITC) 39.51–18.47; (NT4.1) 39.66– 19.00 (CF) I =VIII; (CFT) I =IX; M=7.3; (NT4.1) M=7 Coasts of Salentinian peninsula (Brindisi and Lecce)
CF, CFT, ITC, NT4.1, TMS
29 17/9/1750 (CF) 46.00–12.45 (CF) I =VI Adriatic coasts CF, AM, TMS
30 22/10/1756 Coasts of Gargano
(Manfredonia)
CF, TMS
31 26/2/1781 Ortona coasts (Central
Adriatic)
Table A1. Continued.
32 (3 or) 4/1/1802 (CF) 45.30–14.00; (NT4.1) 45.40–14.30
(CF) I =VII; (NT4.1)
M=5.5
Coasts of Dalmatia and Istria
CF, NT4.1, AM, TMS 33 7/4/1813 (CF) 43.40–13.40 (CF) I =V Adriatic coasts
(An-cona)
CF
34 22/11/1821 (CO) 42.10–15.50 (CO) M=6.0 N.A.T.R. CO
35 20/8/1823 Dalmatian Coasts,
Dubrovnik
AM
36 18/3/1826 (CF) 43.50–13.00 (CF) I =III Adriatic coasts (Pesaro and Sinigallia)
CF, TMS 37 19/1/1833 (PA) I =VIII, M=6.5 Albania (Valona and
Saseno island)
PA, AM, TMS
38 10/8/1838 (NT4.1) 45.30–14.60 (NT4.1) M=4.7 Dalmatian coasts (Tri-este, Rijeka) CF, NT4.1, TMS 39 14/9/1843 Dalmatia, Dubrovnik, Gruz AM, TMS
40 3 (or 23)/3/1844 Dalmatia, Dubrovnik AM, TMS
41 16/8/1845 Dalmatia, Dubrovnik, Gruz AM, TMS 42 12/10/1851 (PA) 40.42–19.24; (NT4.1) 40.95–15.65 (PA) I =VIII, M=6.8; (NT4.1) M=6.4
Albanian coasts (Val-ona)
PA, NT4.1, AM
43 11/12/1853 Dalmatian coasts TMS
44 2/1/1866 (PA) 40.24–19.36 (PA) I =IX, M=6.6 Albanian coasts (Val-ona, Himara)
PA, AM, TMS
45 6/1/1866 Albanian coasts
(Val-ona, Narta)
AM, TMS
46 2 (or 3)/3/1866 (PA) 40.24–19.30 (PA) I =IX, M=6.3 Albanian coasts (Val-ona)
PA, AM, TMS
47 6/3/1866 (PA) 40.50–19.30 (PA) I =VIII, M=6.1 Albanian coasts (Hi-mara, Kanina)
PA, AM, TMS
48 13/3/1866 (PA) 40.30–19.30 (PA) I =VII, M=5.6 Albanian coasts (Hi-mara Kanina)
PA, AM, TMS
49 28/12/1869 (PA) 38.51–20-48 (PA) I =X, M=6.4 Albanian coasts (Val-ona) PA, AM 50 29/7/1870 (CFT) 43.18–10.37; (NT4.1) 43.30–10.63 (CFT) I =VIII, M=5.5; (NT4.1) M=5.2 Adriatic coast CF, CFT, NT4.1, TMS 51 6/8/1870 Dalmatia (Lesina) TMS
Table A1. Continued. 52 (17 or) 18/3/1875 (CF) 44.12–12.24; (CFT) 44.04–12.33; (NT4.1) 44.06– 12.56 (CF) I =VIII; (CFT) I =VIII, M=5.8; (NT4.1) M=5.2
Adriatic coast (Rimini-Cervia), Island of Vis (Lissa)
CF, CFT, NT4.1, ITC, AM, TMS 53 23/9/1878 (CO) 45.00–14.90 (CO) M=6.0 N.A.T.R. CO 54 8/12/1889 (CF) 42.03–15.30; (NT4.1)
41.75–15.58; (ITC) 41.50– 15.42
(CF) I =VII; (NT4.1) M=5; (ITC) I =VII, M=5.6
Adriatic coast (An-cona), Tremiti islands
CF, NT4.1, ITC, TMS
55 14/6/1893 (PA) 40.06–19.42 (PA) I =IX, M=6.6 Albanian coasts (Val-ona, Himara)
PA, AM, TMS
56 26/11/1920 (PA) 40.18–20.00 (PA) I =IX, M=6.3 Albania (Saseno) PA, TMS
57 18/12/1920 Albanian coasts
(Val-ona, Saseno)
AM, TMS 58 20/7/1937 (TMS) 43.20–16.40 (TMS) I =VIII, M=5.2 Croatian coasts, Island
of Hvar
TMS
59 11/1/1962 (CO) 43.15–16.94 (CO) M=6.1 Croatian coast (Makarska)
CO
60 22/6/1978 Central Adriatic coast
from Giulianova to Mola (Bisceglie) BC, ITC, TMS 61 7/4/1979 Southern Montenegro BC 62 15/4/1979 (CO) 42.02-19.07; (PA) 41.58– 19.00
(CO) M=6.8; (PA) I =IX Bari coastline, South Adriatic
BC, CO, PA, TMS
Acknowledgements. We are thankful to G. F. Panza for supporting
our research and to T. B. Yanovskaya for her kind contribution in revising the algorithms. We are grateful to the editor, S. Tinti, and the two referees (G. Papadopoulos and M. Gonz´ales), whose kind comments and suggestions helped us improving our work. Edited by: S. Tinti
Reviewed by: M. Gonz´alez and G. Papadopoulos
References
Aliaj, S., Adams, J., Halchuk, S., Sulstarova, E., Peci, V., and Muco, B.: “Probabilistic seismic hazard maps for Albania”, 13th World Conference on Earthquake Engineering, Vancouver, B.C., Canada, August 1–6, 2004, Paper No. 2469, 2004.
Ambraseys, N. N.: Data for the investigation of seismic sea waves in the Eastern Mediterranean. Bull. Seism. Soc. Am., 52, 895– 913, 1962.
Bedosti, B. and Caputo, M.: Primo aggiornamento del catalogo dei maremoti delle coste italiane, Atti della Accademia Nazionale
dei Lincei, Rendiconti Classe Scienze Fisiche, Matematiche, Naturali, s.VIII, 80, 570–584, Roma, 1986.
Boschi, E. Guidoboni, E., Ferrari, G., Valensise, G., and Gasperini, P.: Catalogo dei forti terremoti in Italia dal 461 a.C. al 1990, Istituto Nazionale di Geofisica, 1997.
Boschi, E., Guidoboni, E., Ferrari, G., Mariotti, D., Valensise, G., and Gasperini, P. (Eds.): Catalogue of Strong Italian Earthquakes from 461 B.C. to 1997, Ann. Geofis., 43, 609–868, 2000. Camassi, R. and M. Stucchi: NT4.1, a parametric catalogue of
dam-aging earthquakes in the Italian area. Gruppo Nationale per la Difesa dai Terremoti (GNDT), 1998.
Caputo, M. and Faita, G.: Primo catalogo dei maremoti delle coste italiane, Atti Accademia Nazionale dei Lincei, Memorie Classe Scienze Fisiche, Matematiche, Naturali, s. VIII, 17, 213–356, Roma, 1984.
Castello, B., Selvaggi, G., Chiarabba, C., and Amato, A.: CSI Cat-alogo della sismicita‘ italiana 1981–2002, versione 1.0. INGV-CNT, Roma, 2005.
Comer, R. P.: The tsunami mode of a flat earth and its excitation by earthquake sources, Geophys. J. Astr. Soc., 77, 1–28, 1984a. Comer, R. P.: Tsunami generation: a comparison of traditional
1984b.
Fitzko, F., Suhadolc, P., Aoudia, K., and Panza, G. F.: “Constraints on the location and mechanism of the 1511 Western-Slovenia earthquake from active tectonics and modelling of macroseismic data”, Tectonphysics, 2005.
Guidoboni, E. and Tinti, S.: The largest historical tsunamis in the Northern Adriatic Sea: a critical review, Science of Tsunami Hazards, 7, 45-54, 1989.
Hammack, J. L.: A note on tsunamis: their generation and prop-agation in an ocean of uniform depth, J. Fluid Mechanics, 60, 769–799, 1973.
Haskell, N. A.: “The dispersion of surface waves on multilayered media”, Bull. Seism. Soc. Am., 43, 17–34, 1953.
Ivancic, I., Herak, D., Markusic, S., Sovic, I., and Herak, M.: “Seis-micity of Croatia in the period 1997–2001”, Geofizika, Vol. 18– 19, 2001–2002, 2002.
Kajiura, K.: The leading wave of tsunami, Bull. Earthq. Res. Inst., 41, 535–571, 1963.
Kandler P. and Scussa V.:“Storia Cronografica di Trieste dalla sua origine sino all’anno 1695, cogli annali dal 1695 al 1848 del procuratore civico Cav. Pietro Dott. Kandler” a cura di F. Cameroni, prima edizione: Stab. tipogr.-litogr. di C. Coen edi-tore. Div. XX, p. 104, 1863.
Lee, J. J. and Chang, J. J.: Water waves generated by an impulsive bed upthrust of a rectangular block, Appl. Ocean Res., 2, 165– 170, 1980.
Meletti C. and Valensise G.: Zonazione sismogenetica dell’Italia e aree adiacenti ZS9, INGV internal document, available on World Wide Web at http://zonesismiche.mi.ingv.it/., 2004.
Minisini, D., Trincardi, F., and Asioli A.: “Evidence of slope insta-bility in the Southwestern Adriatic Margin”. Nat. Hazards Earth Syst. Sci., 6, 1–20, 2006,
http://www.nat-hazards-earth-syst-sci.net/6/1/2006/.
Musson, R. M. W.: An earthquake catalogue for the Circum-Pannonian Basin. In Seismicity of the Carpatho-Balcan Region, Proc. XV Congress of the Carpatho-Balcan Geol. Ass., edited by: Papanikolaou, D. and Papoulia, J., Athens 1996, 233–238, 1996.
Musson, R.:“Probabilistic seismic hazard maps for the North Balkan region”, Annali Geofis., 42, 1109–1124, 1999.
Musson, R. M. W.: Generalised Seismic Hazard Maps for the Pannonian Basin Using Probabilistic Methods, PAGEOPH, 157, 147–169, 2000.
Okal, E. A.: Mode-wave equivalence and other asymptotic prob-lems in tsunami theory, Phys. Earth Planet. Inter., 30, 1–11, 1982. Okal, E.A., 1988. Seismic parameters controlling far-field tsunami
amplitudes: A review, Natural Hazards, 1, 67-96
Panza, G. F., Craglietto, A., and Suhadolc, P.:“Source geometry of historical events retrieved by synthetic isoseismals”, Tecton-physics, 193(1991) 173–184, 1991.
Panza, G. F., Romanelli, F., and Yanovskaya, T. B.: “Synthetic tsunami mareograms for realistic oceanic models”, G.J.I, 141, 498–508, 2000.
Papadopoulos, G. A.: Tsunami in the East Mediterranean: 1. A cat-alogue for the area of Greece and adjacent seas. Proceedings of the “Joint IOC -IUGG International Workshop: Tsunami Risk Assessment Beyond 2000: Theory, Practice and Plans, Moscow, June 14–16, 2000”, 34–43, 2001.
Pinat, T., Romanelli, F., and Panza, G. F.: “Tsunami modelling in the upper Adriatic Sea domain” (abstract), Geophys. Res. Ab-stracts, Vol.7, 02697, European Geosciences Union, 2005. Pod’yapolsky, G. S.: Generation of longperiodic gravitational wave
in the ocean by seismic source in the crust, Izvestia AN SSSR, Fizika Zemli, 1, 7–24, 1968.
Shebalin, N. V., Leydecker, G., Mokrushina, N. G., Tatevossian, R. E., Erteleva, O. O., and Vassiliev, V. Yu.: Earthquake Catalogue for Central and Southeastern Europe 342 BC–1990 AD. – Final Report to Contract ETNU - CT 93 - 0087, 1997.
Slejko, D., Camassi, R., Cecic, I., Herak, D., Herak, M., Kociu, S., Kouskouna, V., Lapajne, J., Makropoulos, K., Meletti, C., Muco, B., Papaioannou, C., Peruzza, L., Rebez, A., Scandone, P., Sul-starova, E., Voulgaris, N., Zivcic, M. and Zupancic, P.: “GSHAP Seismic hazard assessment for the Adria region”, Ann. Geofis., 42, 1085–1108, 1999.
Soloviev, S. L., Solovieva, O. N., Go, C. N., Kim, K. S., and Shchet-nikov, N. A.: Tsunamis in the Mediterranean Sea 2000 B.C.– 2000 A.D., Advances in Natural and Technological Hazard Re-search, Kluwer Academic Publishers, 2000.
Tinti, S. and Piatanesi, A.: “Numerical simulations of the tsunami induced by the 1627 earthquake affecting Gargano, Southern Italy”, J. Geodynamics, 21(2), March 1996, 141–160(20), 1996. Tinti, S. and Maramai, A.: Catalogue of tsunamis generated in Italy and in Cote d’Azur, France: a step towards a unified catalogue of tsunamis in Europe, Annali di Geofisica, 39, 1253–1299, (Errata Corrige: Ann. Geofis. 40, 781), 1996.
Tinti, S., Maramai, A., and Graziani, L.: A new version of the Euro-pean tsunami catalogue: updating and revision, Nat. Haz. Earth Syst. Sci., 1, 255–262, 2001.
Tinti, S., Maramai, A., and Graziani, L.: The new catalogue of the Italian tsunamis, Nat. Haz., 33, 439–465, 2004.
Van Gils, J. M. and Leydecker, G. (Eeds.): Catalogue of Euro-pean earthquakes with intensities higher than 4. – Commission of the European Communities - nuclear science and technology. 353 pp., 14 fig., 1 tab.- ISBN 92-826-2506-0, Catalogue number: CD-NA-13406-EN-C. Brussels - Luxembourg, 1991.
Ward, S. N.: Relationship of tsunami generation and an earthquake source, J. Phys. Earth, 28, 441–474, 1980a.
Ward, S. N.: “Tsunamis”, Encyclopedia of Physical Science and Technology, Academic Press, California, 1980b.
Ward, S. N. and Day, S.: Tsunami Balls: A granular approach to tsunami runup and inundation, Submitted to Communications in Computational Physics, special issue on Computational Geo-physics, January 2007.
Yanovskaya, T. B., Romanelli, F., and Panza, G. F.: “Tsunami ex-citation by inland/coastal earthquakes: the Green function ap-proach”, Nat. Haz. Earth Syst. Sci., 3, 353–365, 2003.