HAL Id: hal-03122758
https://hal.archives-ouvertes.fr/hal-03122758
Submitted on 28 Jan 2021
HAL is a multi-disciplinary open access
archive for the deposit and dissemination of
sci-entific research documents, whether they are
pub-lished or not. The documents may come from
teaching and research institutions in France or
abroad, or from public or private research centers.
L’archive ouverte pluridisciplinaire HAL, est
destinée au dépôt et à la diffusion de documents
scientifiques de niveau recherche, publiés ou non,
émanant des établissements d’enseignement et de
recherche français ou étrangers, des laboratoires
publics ou privés.
Relationships between cloud condensation nuclei spectra
and aerosol particles on a south-north transect of the
Indian Ocean
Will Cantrell, Glenn Shaw, Caroline Leck, Lenart Granat, Hélène Cachier
To cite this version:
Will Cantrell, Glenn Shaw, Caroline Leck, Lenart Granat, Hélène Cachier. Relationships between
cloud condensation nuclei spectra and aerosol particles on a south-north transect of the Indian
Ocean. Journal of Geophysical Research: Atmospheres, American Geophysical Union, 2000, 105
(D12), pp.15313-15320. �10.1029/2000JD900219�. �hal-03122758�
JOURNAL OF GEOPHYSICAL RESEARCH, VOL. 105, NO. D12, PAGES 15,313-15,320, JUNE 27, 2000
Relationships between cloud condensation nuclei spectra and
aerosol particles on a south-north transect of the Indian Ocean
Will Cantrell • and Glenn Shaw
Geophysical Institute, University of Alaska Fairbanks
Caroline Leck and Lenart Granat
Department of Meteorology, Stockholm University, Stockholm, Sweden
Hdlane Cachier
Laboratoire Mixte Commissariat h l'Energie Atomique-CNRS, LSCE/CFR, Gif sur Yvette, France
Abstract. Do anthropogenic
emissions
affect cloud microphysical
properties?
One
parameter needed to answer the preceding question is a link between the aerosol number
distribution
and the cloud condensation
nuclei (CCN) supersaturation
spectrum
for
polluted and unpolluted air masses. On a south-north cruise in the Indian Ocean in March of 1998, we found that measured CCN spectra and CCN spectra calculated from the
ambient aerosol number distributions
disagreed
by as much as a factor of 2. The aerosol
soluble
fraction inferred from the relationship
between measured
and calculated
CCN
spectra
ranged from 0.2 to 0.05 and exhibited a broad minimum at the Intertropical
Convergence
Zone (ITCZ). The concentration
of CCN, non-sea-salt
SO42-,
NH•-, black
carbon, and organic carbon increased
by an order of magnitude
as we passed
through the
ITCZ.
1. Introduction
There are few places on Earth with a more pronounced juxtaposition of air masses than in the mid Indian Ocean dur- ing the Asian winter monsoon. From January to April the dominant circulation in the Northern Hemisphere is a low-
level flow from the subcontinent out over the ocean toward the
Intertropical Convergence 7,•no I'ITC'7I A
particles derived from urban pollution, natural organic com- pounds, biomass burning, and dust is carried with the air
streaming out from over the subcontinent. The flow in the
Southern Hemisphere is from the open ocean, a region rela- tively free from anthropogenic influences [Cachier, 1998; Mey- werk and Ramanthan, 1999]. These two air masses, with their strikingly different characteristics, meet at the ITCZ, and their confluence provides an opportunity to study the role of the ITCZ in interhemispheric transport of trace gases and aerosol [Krishnamurti et al., 1998; Rhoads et al., 1997]. It is also a unique natural laboratory for the investigation of how anthro- pogenic activities may affect Earth's radiative balance through the perturbation of cloud microphysical properties.
Aerosol particles affect the planet's radiative balance either by direct interaction with the incoming or outgoing radiation or, indirectly, by acting as cloud condensation nuclei (CCN). Keeping cloud dynamics and liquid water content constant, increasing the number of CCN can increase a cloud's droplet
concentration, and therefore the solar radiation it reflects
[Twomey, 1991]. A higher cloud droplet concentration results •Now at Department of Chemistry, Indiana University, Blooming-
ton.
Copyright 2000 by the American Geophysical Union.
Paper number 2000JD900219.
0148-0227/00/2000JD900219509.00
in smaller droplets, which can lead to a decreased chance of precipitation. This can result in increased cloud thickness and lifetime [Albrecht, 1989], which can also enhance a cloud's reflectivity [Pincus and Baker, 1994].
Experiments which clearly demonstrate a definitive cause- and-effect relationship between an increased number concen- tration of aerosol particles or CCN and an increase in the clottd droplet concentration have been elusive. Even the first
link in the chain, an increase in aerosol number concentration
leading to an increase in the concentration of CCN, is poorly understood [SeinfeM and Flagan, 1999]. Though there is cir-
cumstantial evidence that increases in the aerosol number con-
centration eventually lead to an increase in cloud albedo (ship tracks being the most promising evidence to date), there are few conclusive examples.
2. Cruise Track and Experimental Setup
The measurements were made aboard the Indian research
vessel Sagar Kanya in February and March of 1998 as part of the Indian Ocean Experiment (INDOEX), a multinational re- search effort culminating in an intensive field campaign in the winter/spring of 1999.
2.1. Cruise Track
The cruise track, shown in Figure 1, spanned almost 35 ø of latitude, providing the opportunity to sample north/south gra- dients in aerosol properties, radiation, and trace gases over the Arabian Sea and Indian Ocean. We crossed the ITCZ enabling us to sample both Northern and Southern Hemisphere air masses and to investigate possible cross-ITCZ transport of aerosol. Because of difficulties with the sampling setup and following winds for most of the southward journey, only data from the last leg of the cruise (March 19 to 28) will be pre-
15,314 CANTRELL ET AL.: AEROSOL AND CCN ON AN INDIAN OCEAN TRANSECT 20 10 -10 Port Luis -20 60 70 80 90
Figure 1. Cruise track for the Sagar Kanya. Data are pre- sented from the portion marked with the bold line.
sented here. That section of the cruise track is indicated with a
thick line in Figure 1. Data taken within the Indian Economic Exclusion Zone, which extends approximately 200 miles from the Indian coast, could not be presented here as clearance to use these data has not been forthcoming.
2.2. CCN Measurements
Sample air for the CCN spectra was drawn through a 30 m sampling line (5.7 cm inner diameter) from a position well forward on the ship. The line's inlet was about 15 m above the surface of the water. The residence time was approximately 2 min, and air was subsequently drawn from the center of the tubing to minimize particle losses. Calculated particle losses in the size range 30 to 500 nm were negligible, so the data were not corrected for this. To eliminate the possibility of contam- ination from the ship's exhaust, the CCN spectrometer was operated only at times when the ship was underway and facing
into the wind.
The CCN spectrometer consists of a device called the CCN Remover (CCNR) operated in series with a Scanning Mobility Particle Sizer (SMPS) (Thermo Systems, Inc. (TSI); Minneap- olis, Minnesota). The CCNR is a flow-through, parallel plate thermal diffusion chamber with a residence time of approxi- mately 1 min (see Ji et al. [1998] for a complete description of the instrument). The aerosol sample is introduced to the cham- ber approximately 1 cm above the bottom plate and is con- strained in this region of maximum supersaturation by filtered sheath air above and below it. Aerosol particles which act as CCN at the supersaturation in the chamber will activate and begin to grow. The residence time in the chamber is long enough such that aerosol particles which do activate fall out of the sample stream. Only particles which do not activate exit the
chamber and are sized and counted by the SMPS. CCN con- centrations below approximately 0.1% are unreliable since sol- uble particles larger than approximately 150 nm can be re- moved as haze droplets (i.e., not activated).
To construct a CCN spectrum, we measure distributions with no supersaturation in the CCNR. These ambient distri-
butions are defined as the reference R. Then, we force a
temperature difference between the two plates by cooling the bottom one. Distributions measured with a temperature dif- ference in the chamber experience some degree of supersatu- ration. These distributions are D(S). The CCN spectrum is defined by
CCN(S) = R - O(S). (1)
Since both the CCN spectrum and aerosol distribution are
known, we can make some inferences about the aerosol chem-
ical composition by comparing the measured CCN spectrum to a CCN spectrum calculated from the ambient aerosol size distribution using K6hler theory and an assumed composition of ammonium sulfate (another readily soluble species such as ammonium bisulfate or sodium chloride would give a similar result). Frequently, there is a significant discrepancy between these two spectra, indicating the presence of an insoluble sub-
stance. The ratio of soluble mass to total mass in the aerosol
particle is the soluble fraction e. We infer e from CCN spectra
calculated from the ambient aerosol number distribution
through the relationship
Sc
=
(2)
where S c is the supersaturation at which an aerosol particle will act as a CCN, D O is the particle's dry diameter, and K is a
constant specific to ammonium sulfate, 1.71 x 10 -• cm 3/2. We
stress that this is an indirect method. The presence of com- pounds which could inhibit the uptake of water by hygroscopic compounds will bias our inferred soluble fractions low.
2.3. Mass of Submicron Aerosol Components
The samplers used for measurements of ambient particulate
mass
of sulfate
(SO42-),
sodium
(Na+), chlorine
(C1-), and
ammonium (NH•-) were, together with samplers for collection
of black carbon and organic carbon (described below), mounted on a 3-m high mast in a forward position perpendic- ular to the deck below the bridge. The height of the collection point above sea level was about 15 m. For sample changes the mast could be tipped backward onto the front deck. A wind sector controlled pollution sensor system was attached to the mast to insure that aerosol particles were sampled with a min- imum of interference from the ship and from the sea surface surrounding the ship.
For collection of the ionic constituents we used two (one serving as a blank) filter pack units (FP), each consisting of one 47-mm Millipore Teflon aerosol particle filter with 1.0-/•m pore size (flow rate 45 standard liters per minute (sLpm)) held in a polyacetal (Deldrina) filter holder. Since cyclones, which eliminated most of the particles with diameters >0.9/•m (50% collection efficiency) were connected to the holders, we col- lected mainly the submicrometer mass fraction.
Prior to sampling, the FP units and cyclones were soaked for
5 hours in 1.2 M hydrochloric acid and rinsed with deionized
water with a conductivity of 18 M fl cm -•. All filter substrate,
CANTRELL ET AL.: AEROSOL AND CCN ON AN INDIAN OCEAN TRANSECT 15,315
(free from particles, ammonia, and sulfur dioxide) both prior to and after collection. Effective collection times ranged from 5 to 12 hours. After exposure, the filter substrates of the FP samplers were extracted (inside the glove box) by wetting with
0.5 mL methanol. After the cruise, 4.5 mL deionized water was added. The extracts were then analyzed for major cations and
anions by ion chromatography (IC) (Dionex DX500 (2 mm)). The analysis of cations was made with Dionex CG12A/ CS12A columns and CRSR-I auto suppressor with external water mode (electrochemical), eluent (isocratic) m2so 4 9 mM, with a flow of 0.25 mL min-•.
The anions were analyzed with Dionex AGll/ASll columns and ASRS-1 autosuppressor with external 25 mM H2SO 4 mode, eluent NaOH 2.5 mM at 0.5 mL min-- • for weak anions, then NaOH 100 mM to elute strongly retained anions. NaOH eluent was prepared with deionized water degassed with 99.995% purified Helium, and a Dionex ATC-1 column is used before the injection valve to trap carbonates and other ionic contaminants. For the analyses of cations a 100/•L sample was injected. The corresponding anion sample volume was 250/•L.
Non-sea-salt (nss) SO•- concentrations were calculated by
using sodium concentrations and seawater composition taken from Stumm and Morgan [1981]. The average particulate blank
concentrations for SO42-, NH•-, and Na+, C1- were <1% and
25% of the sample, respectively. During previous expeditions over remote areas [Leck and Petsson, 1996], duplicate FP sam- ples for all particulates have agreed on average within 15%.
Prewashed quartz fiber filters were used as the collection surface for the determination of the aerosol particulate carbon content. Mean sample duration was about 24 hours (this time interval appeared to be necessary for the clean conditions in the Southern Hemisphere). Analyses were conducted follow- ing the laboratory thermal protocol [Cachier et al., 1989] in- cluding a predecarbonation step. In short, half of each sample is analyzed directly and gives the so-called total carbon con- tent. The second half undergoes a thermal pretreatment (2 hours under pure oxygen flow at 340øC) which allows us to evolve totally the organic fraction, and the carbon remaining is the black carbon component. The organic fraction is calculated
as the difference between total and black carbon. Carbon con-
tents are obtained by a coulometric analyzer. The detection
limit is 3 /•g, but the most important limitation is due to the
filter
blanks
(0.4 _+
0.1 •g C cm
-2 and 1.2 +_
0.5/•g C cm
-2 for
black carbon and organic carbon, respectively). On average, reproducibility is better than 15%.
3. Results and Discussion
3.1. Measured CCN Spectra and CCN Spectra Calculated
From Ambient Aerosol Number Distributions
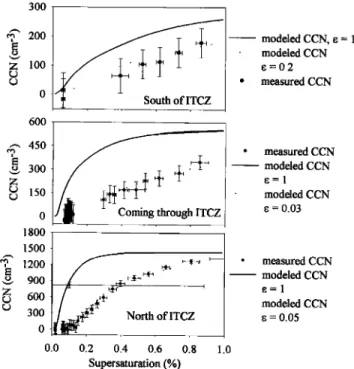
The shape of the CCN spectra and its relationship to the aerosol number distribution showed a substantial change from the Southern to Northern Hemisphere. Figure 2 shows repre- sentative CCN spectra from the "background" air mass in the Southern Hemisphere, the transition air mass in the ITCZ, and the "polluted" air mass of the Northern Hemisphere. Mea-
sured CCN concentrations are shown along with CCN concen-
trations calculated from the ambient aerosol number distribu-
tions, using K6hler theory and assuming a composition of pure ammonium sulfate. We calculate CCN spectra based on an assumed composition of ammonium sulfate to serve as a benchmark since sulfate is frequently assumed to be the dom-
300
i
• 200
.•
... modeled
CCN,
•- 1
õ
• •--'•''
ß
....
modeledCCN
Z 100 .•' '
e=0.2
• ß measured CCN 0 600• 450
ß measured
CCN
õ 300
..•- .'
modeled
CCN
2: •=1 • 150 ... modeled CCN0 • '"' • Coming
through
ITCZ e
= 0.03
18001500
&"
•• 900 4•.•.
1200
/"•-
.•z•. •'".•... ø measured
'
modeled•=
1
CCNCCN
6001
•
'• •+
ß -- modeled
CCN
• 3
00
North
of
ITCZ
e = 0.05
0 , , 0.0 0.2 0.4 0.6 0.8 1.0 Supersaturation (%)Figure 2. Representative CCN spectra, both measured and
calculated from south, in, and north of the ITCZ. Concentra- tions of CCN increase from south to north, while the inferred
aerosol fraction e goes through a minimum at the ITCZ.
inant chemical compound in atmospheric aerosol [Charlson et al., 1992; Pinnick et al., 1987].
In all three instances there is a substantial difference be-
tween calculated and measured CCN spectra. Apparently, the ambient aerosol particles are not activating as efficiently as ammonium sulfate would, indicating the presence of some other chemical compound. To serve as another benchmark, we calculate the CCN spectra again, this time assuming an inter- nally mixed aerosol (every aerosol particle in the distribution has a similar composition to every other one) composed of
ammonium sulfate and an insoluble substance. The insoluble
material contributes only to the size of the aerosol particle. These calculated spectra are shown in Figure 2 as dotted lines. Aerosol soluble fractions (i.e., fraction of ammonium sulfate)
as low as 0.05 to 0.1 were necessary to get agreement between
our measured spectra and those calculated from the aerosol
number distribution.
Measurements made with a Hygroscopic Tandem Differen-
tial Mobility Analyzer have also shown that some portion of
the atmospheric aerosol can have a relatively low e. In most cases, two modes in the solubility are found, designated "more soluble" and "less soluble." In air masses influenced by anthro- pogenic activity the less soluble mode had values of e ranging from 0.02 to 0.14, and constituted up to 60% of the aerosol number concentration [Svenningsson et al., 1994, 1992]. The
more soluble fraction at a site near Frankfurt am Main, Ger-
many, had an e as low as 0.37 [Svenningsson et al., 1994]. Over
the remote Pacific Ocean south of Australia, aerosol soluble
fractions were close to unity, with growth factors less than nss sulfate reported only when sampling anthropogenically influ- enced air masses [Berg et al., 1998]. Other investigators, using
different methods, have found e between 0.15 and 0.5 in mid-
sized towns in the United States [Alofs et al., 1989; Fitzgerald, 1973]. More recently, Wulfmeyer and Feingold [2000] inferred
15,316 CANTRELL ET AL.: AEROSOL AND CCN ON AN INDIAN OCEAN TRANSECT 3000 2500 2000 1500 1000 5OO 0.35
/x oo
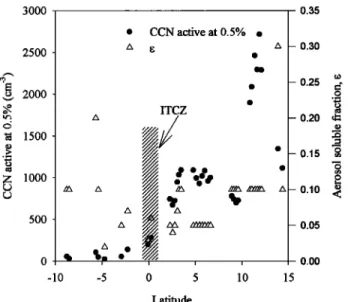
-5 CCN active at 0.5% ß ITCZ i / i i 0 5 10 Latitude 0.30 0.25 cr o .,-• - 0.20 O= -0.15 •o o o- 0.10 .•
- 0.05 0 • o.oo -10 15Figure 3. The south/north variation in CCN active at 0.5%
and in the inferred aerosol soluble fraction e.
aerosol soluble fractions in the range 0.05-0.27 for an air mass
over the Baltic Sea.
In our case, the insoluble mass could be from the mass of
carbon associated with the ammonium and sulfate. Mineral
dust is usually in particles with diameters larger than 1 [Krishnamufti et al., 1998], and so would be a minor component of any insoluble material in the size range (diameter <1 which contributes the majority of the CCN number. Figure 3 shows that the mass of particulate carbon was high in the Northern Hemisphere. Black carbon is only sparingly soluble [Andrews and Larson, 1993], and some of the organic carbon is also insoluble (see section 3.2 for a more complete discussion). Saxena et al. [1995] showed that organic mass in urban air masses can actually inhibit the water uptake of soluble com- pounds, further contributing to the low apparent aerosol sol-
uble fractions we observe.
An alternative explanation of the large discrepancy between the measured CCN spectra and the spectra calculated from aerosol number distributions is the presence of hydrophobic films on the surface of aerosol particles, which could inhibit the transfer of water from the vapor to the liquid phase. Organic films on aerosol particles and hydrometeors are not uncom- mon in the atmosphere [Gill et al., 1983]. In a comparison between measured CCN spectra and CCN spectra calculated from aerosol number distributions, Bigg [1986] concluded that activation of the aerosol particles was inhibited by the presence of some surface-active organic component. Shulman et al. [1996] showed that slightly soluble chemical substances, which include a wide range of organics, can alter droplet growth.
However, recent laboratory results have been ambiguous. In
one study, ammonium sulfate particles coated with dioc- tylphthalate, a nonhygroscopic organic, were not prevented from activating, nor was the activation appreciably delayed [Cruz and Pandis, 1998], while in another study sodium dodecyl sulfate, which was used as a surrogate for atmospheric surfac-
tants, did have a substantial effect on the activation of inor-
ganic salts [Liet al., 1998]. Hansson et al. [1998] concluded that organic compounds which might be found in the atmosphere would not affect the deliquescence and growth of soluble salts.
3.2. Gradient in CCN, e, and Aerosol Mass
We observed an increase of an order of magnitude in the
number concentration of CCN on the south to north transect
through the ITCZ. There was also a change in the apparent aerosol soluble fraction e. The latitudinal dependence in both is shown in Figure 3. South of the ITCZ the CCN concentra-
tions
were 100-200
cm
-3 at 0.5% supersaturation,
comparable
to those measured in clean, "baseline" conditions at Cape Grim, Tasmania [Gras, 1995], the central, South Indian Ocean [Bigg et al., 1995], the remote Atlantic [Hoppel, 1979], and the northwest Pacific Ocean [Matsumoto et al., 1997]. North of the ITCZ, CCN concentrations ranged between 1000 and 2000
cm
-3 at 0.5% supersaturation.
Liu et al. [1996]
report
compa-
rable values during the North Atlantic Regional Experiment for a station frequently impacted by polluted air masses.
The increase in CCN concentration also corresponded to an increase in the aerosol mass loading. The latitudinal variation
in the mass of nss-SO42-, NH•-, Na+, CI-, and the mass of
black and organic carbon is shown in Figure 4. Measurements
made
by Matsumoto
et al. [1998]
of fine mode
(Dp <1.1 /am)
concentrations in the northwest Pacific downwind of pollution sources in Asia show a striking similarity to our measurements. When segregated into continentally influenced and back- ground marine air masses based on the concentration of ozone,
their values for nss-SO42- varied between average concentra- tions of 1.58 and 0.303/xg m -3, and ammonium varied between 0.345 and 0.041 /xg m -3. The concentrations of organic and
black carbon south of the ITCZ are substantially higher than
concentrations measured at Amsterdam Island, a station in the
remote Indian Ocean [Cachier et al., 1996], while concentra- tions of carbon north of the ITCZ are comparable to polluted marine conditions in the Mediterranean Sea [Cachier, 1998].
The concentrations of CCN increased slightly from -3øN to the equator, then increased by a factor of 3 over the next 5 ø of
latitude. Increases in nss-SO42- and NH•- were even more
pronounced, showing a factor of 10 gain from the equator to 5øN. The gradient in the mass or carbon was not as great, but was still significant. Similar latitudinal variations in trace gases and aerosol mass were observed in previous experiments in the
0 -15 -- c1- o Na +
--,-- NH4
+
---v- nss_SO42-
ß black carbon ITCZ • organic carbon 7///• // •
-10 -5 0 5 10 15
Latitude
Figure 4. South/north variation in aerosol mass. The transi-
tion for organic and black carbon upon crossing the ITCZ was not as sharp because of the lower time resolution.
CANTRELL ET AL.: AEROSOL AND CCN ON AN INDIAN OCEAN TRANSECT 15,317
Indian Ocean/Arabian Sea. Jayaraman et al. [1998] detected a drop in the aerosol mass upon entering the ITCZ from the north and a commensurate increase upon crossing the ITCZ coming from the south. Rhoads et al. [1997] report a sharp
increase in the concentrations of carbon monoxide, carbon
dioxide, nitrate, and nss-SO•- upon crossing the ITCZ going
from south to north. Our peak value of approximately 2 /•g
m -3 SO•- is comparable to their average value of 2.96 ___ 1.04
for Northern Hemisphere continental tropical air masses. The concentrations of CCN and mass loading of the ionic compounds (Figures 3 and 4) indicate a distinct transition between the clean air mass of the Southern Hemisphere and the more polluted one of the Northern Hemisphere. This tran- sition corresponded to the position at which we crossed the ITCZ. We cannot infer the existence of such an abrupt change
in the concentration of the carbonaceous aerosol mass because of the coarse time resolution in that measurement.
The ITCZ has conventionally been viewed as an impenetra- ble barrier, preventing air masses from the Northern and Southern Hemisphere from mixing. A more accurate analogy may be that of a sieve since eddies within the ITCZ allow some transport and mixing between the two hemispheres [Krish- namurti et al., 1998; Rhoads et al., 1997]. CCN-rich Northern Hemisphere air can be injected into the clean conditions of the Southern Hemisphere, while air from the Southern Hemi- sphere can be transported to the north. However, only a por- tion of the aerosol loading from the Northern Hemisphere would survive transport through the ITCZ because of the high probability of precipitation there; some fraction of the CCN in Northern Hemisphere air mass would be washed out as they leaked through the ITCZ.
We hypothesize that this mixing process not only would reduce the number of CCN which could be transported to the Southern Hemisphere, but would fractionate them according to solubility. Aerosol particles with the most soluble material, or highest e, are the most likely to be scavenged in precipita- tion because they activate at lower supersaturations. Figure 4 suggests a broad minimum in e around the equator. This lat- itudinal dependence is consistent with aerosol particles with initially low solubilities transported toward the ITCZ from the north, then scavenged in the ITCZ. Rhoads et al. [1997] also concluded that the Northern Hemisphere air masses were sub- stantially depleted in soluble compounds. Different aerosol sources in the Southern and Northern Hemisphere would also
contribute to this minimum.
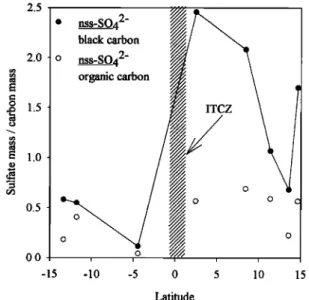
Figure 5, a plot of sulfate to carbon mass ratio, also shows the depletion in soluble compounds. Black carbon is only spar- ingly soluble and so is inefficient as cloud condensation nuclei [Andrews and Larson, 1993]. It can be removed from the at- mosphere through wet deposition processes either by being associated with more soluble compounds which will be more likely to participate in the cloud activation process or by pre- cipitation scavenging. In either case, it will be removed less efficiently than a soluble compound in a similar-sized particle.
In the absence of sources, the ratio of the mass of soluble
compounds to black carbon should show a decrease after pass- ing through a region of frequent precipitation. Figure 5 also indicates that some of the organic carbon mass was sparingly soluble since the ratio of sulfate to the organic carbon also
showed a minimum at the ITCZ.
Though still rather low, the values of 0.3 to 0.2 in e in the Southern Hemisphere reflect the higher background values in relatively unpolluted air masses. The total aerosol distribution
2.5
ß nss.
black carbonSO42-
•/•'x,,•
2.0 o nss.
S042-
• organic carbon.• 1.5
• 1.0 0.5 c 0.0 , ,o , , -15 -10 -5 0 5 10 15 LatitudeFigure 5. Latitudinal dependence of the ratio of sulfate mass
to carbon mass.
will be an external mixture of aerosol particles with a low e, originating in the Northern Hemisphere, and aerosol particles with a higher e, originating in the Southern Hemisphere. Aero- sol particles with low solubilities which "leak" through the ITCZ will contribute to the apparent aerosol soluble fraction
we infer.
Mixing Northern Hemisphere air across the ITCZ could have a substantial impact on cloud optical properties in the Southern Hemisphere. Because the sensitivity of cloud reflec- tance to droplet concentration is inversely proportional to the cloud droplet concentration for a constant liquid water content [Twomey, 1991], the Southern Hemisphere air mass is suscep- tible to modification by injection of aerosol pollutants because of its low CCN concentration. For clouds which already have high droplet concentrations, increasing the CCN concentration has very little effect on the cloud reflectance; however, in clouds with low droplet concentrations, adding as few as one droplet per cubic centimeter can change the reflectance by almost 1% [Twomey, 1991].
Even though the majority of aerosol particles which act efficiently as CCN is likely to be removed in the passage through the ITCZ, those that survive could still have a signif- icant impact on cloud optical properties on the south side of the ITCZ because of the susceptibility argument just outlined. Clouds forming in clean air are likely to experience higher maximum supersaturations [Seinfeld and Pandis, 1998; Cantrell et al., 1999], which could activate even the slightly soluble CCN which are more likely to survive transport through the ITCZ.
3.3. Relationships Among CCN and Chemical Compounds
There is a pronounced gradient evident in the plot of lati-
tude versus CCN, nss-SO42-, NH•-, organic carbon, and black
carbon (see Figures 3 and 4). The concentrations increase by an order of magnitude across the ITCZ from south to north and increase with latitude, indicating a source in the Northern
Hemisphere. Both Na + and C1- show relatively low concen-
trations and had no significant latitudinal gradient. The source of these compounds over the open ocean is sea spray, and wind speeds were relatively low from March 19 to 28, limiting pro- duction of spray.
15,318 CANTRELL ET AL.: AEROSOL AND CCN ON AN INDIAN OCEAN TRANSECT Table 1. INDOEX Correlation Coefficients Between
Parameters Measured on the Cruise Shown With the Number of Observations Used in Each Case
CCN at SO42- NH•- C1- Na + OC BC 0.5% SO•- 0.04 1 15 NH•- 0.02 0.99 1 15 40 C1- 0.001 0.03 0.02 15 40 40 Na + 0.11 0.05 0.06 15 40 40 OC 0.05 0.45 0.42 5 8 8 BC 0.15 0.53 0.53 5 8 8 CCN at 0.04 0.68 0.70 0.5% 34 15 15 1 0.63 1 40 0.001 0.37 1 8 8 0.03 0.29 0.83 1 8 8 8 0.18 0.33 0.70 0.84 15 15 5 5
Table 1 shows correlation coefficients among CCN, e, SO42-, NH•-, Na+, CI-, black carbon, and organic carbon. The highest
correlation
was between
NH•- and SO42-,
not an unexpected
result since ammonium is frequently associated with sulfate. The slope of 0.75 in Figure 6, a plot of sulfate versus ammo- nium, indicates a composition between ammonium bisulfate, NH4HSO4, which is partially neutralized, and ammonium sul- fate, (NH4)2504, which is fully neutralized. Sulfate and am- monium were positively correlated with black and total carbon
with correlation coefficients near 0.50 in all four cases. Since
black carbon can be used as a tracer for pollution, this suggests
that a substantial fraction of the ammonium sulfate mass is
anthropogenic. Black carbon and total carbon were also posi- tively correlated, also suggesting that a significant portion of the total carbon mass was anthropogenic in origin.
Cloud condensation nuclei active at 0.5% supersaturation were significantly correlated with ammonium and sulfate with correlation coefficients of approximately 0.70. Sulfate has been identified as a principal component of CCN in a variety of air masses, but an increase in sulfate does not a priori indicate an
increase in aerosol or CCN number concentration. The in-
creased mass could simply result in larger aerosol particles, not more of them. However, aerosol number distributions clearly show an increased number concentration; the jump in the mass of sulfate and ammonium upon entering the Northern Hemi- sphere corresponds to a jump in the number concentration of
CCN.
The CCN concentrations were also highly correlated with
the mass of carbon with correlation coefficients between 0.70
and 0.85. Though black carbon is not as efficient as CCN, organic carbon has been shown to be a component of CCN. In air masses influenced by anthropogenic sources, organic car- bon was shown to contribute over half of the CCN activity [Rivera-Carpio et al., 1996; Novakov and Penner, 1993]. How-
ever, organic carbon has also been shown to diminish the water
absorption of inorganic compounds in an urban air mass [Sax- ena et al., 1995].
Aerosol soluble fraction e exhibited a latitudinal trend with
a minimum at the ITCZ, but failed to show a significant cor- relation with any of the other measured parameters. The min- imum at the ITCZ is expected since aerosol particles with higher soluble fractions will be more likely to nucleate cloud
droplets and be removed in precipitation. The weak correla- tion between • and CCN shows that • is not the controlling
factor in the determination of the CCN concentrations in this
case, though it may control the fraction of CCN which survive transport through the heavily precipitating region around the ITCZ. The aerosol soluble fraction also failed to show a sig-
nificant correlation with ammonium or sulfate, both of which
are soluble compounds. This is probably because both were
also associated with the mass of carbon, which was shown
above to have a significant insoluble fraction.
4. Conclusions
On a south-north transect of the Indian Ocean we found that
aerosol particles were not activating as efficiently as aerosol particles composed of a simple electrolytic substance like am- monium sulfate. By calculating the CCN spectra from the aerosol number distribution using an assumed composition of ammonium sulfate and an insoluble component, we infer aero- sol soluble fractions as low as 0.05 in the ITCZ, with relatively higher values to the north and south.
The low aerosol soluble fraction may contribute to the trans- port of some portion of the aerosol in the Northern Hemi- sphere air mass through the ITCZ. Despite their low soluble fractions, these aerosol particles could influence cloud prop- erties in the Southern Hemisphere air mass because of the low, "background" concentration of CCN there. The low aerosol soluble fraction will have little impact on cloud properties in the Northern Hemisphere air mass because the CCN concen- tration is already quite high.
We observed a gradient of an order of magnitude in the
concentrations of CCN, sulfate, ammonium, black carbon, and
total carbon. The transition from low to high concentrations was sharp and corresponded to crossing the ITCZ into the Northern Hemisphere air mass. The observed variation is con- sistent with the findings of previous studies [Jayaraman et al., 1998; Rhoads et al., 1997]. The inferred aerosol soluble fraction was low (<0.5) throughout the cruise; it passed through a
minimum at the ITCZ.
Sulfate and ammonium were correlated with the mass of
25 20 + •- 10 0 35 i i i ! • 5 10 15 20 25 30
NH4
+ (nmol/m
3)
Figure 6. Regression of sulfate and ammonium concentra- tion data.
CANTRELL ET AL.: AEROSOL AND CCN ON AN INDIAN OCEAN TRANSECT 15,319
black and total carbon, indicating a common source in the Northern Hemisphere, which trajectories and wind patterns
indicate is the Indian subcontinent. The concentration of CCN
correlated with the mass of ammonium and sulfate, which is
not unexpected since both compounds have been shown to be associated with CCN activity. CCN also correlated with the mass of carbon. This may simply be a result of a common source for carbon, ammonium, and sulfate, or may be because organic carbon is participating in the activation process.
Acknowledgments. We would like to thank the crew of Sagar Kanya for a safe and productive voyage. Thank you to Umesh
Kulshrestha (Indian National Physical Laboratory) for help with sam-
pling of submicron mass, and to Michael Norman (Department of
Meteorology, Stockholm University) for help with the IC analyses. Thanks to T. N. Krishnamurti (Department of Meteorology, Florida State University), who provided trajectories and a meteorological re-
analysis atlas. Thanks also to Hung Nguyen of C4/Scripps Institute. The University of Alaska's contribution was funded by a grant from the
National Science Foundation (ATM 9612889). Funding for MISU was
provided by the Swedish Science Research Council contract G-AA/GU 03922-335. LSCE acknowledges funding from the French national program PNCA/aerosols.
References
Albrecht, B. A., Aerosols, cloud microphysics, and fractional cloudi-
ness, Science, 245, 1227-1230, 1989.
Alofs, D. J., D. E. Hagen, and M. B. Trueblood, Measured spectra of the hygroscopic fraction of atmospheric aerosol particles, J. Appl. Meteorol., 28, 126-136, 1989.
Andrews, E., and S. Larson, Effect of surfactant layers on the size changes of aerosol particles as a function of relative humidity, En-
viron. Sci. Technol., 27, 857-865, 1993.
Berg, O. H., E. Swietlicki, and R. Krejci, Hygroscopic growth of aero- sol particles in the marine boundary layer over the Pacific and Southern Oceans during the First Aerosol Characterization Exper-
iment (ACE 1), J. Geophys. Res., 103, 16,535-16,545, 1998.
Bigg, E. K., Discrepancy between observation and prediction of con-
centrations of cloud condensation nuclei, Atmos. Res., 20, 82-86,
1986.
Bigg, E. K., J. L. Gras, and D. J. C. Mossop, Wind-produced submicron particles in the marine atmosphere, Atmos. Res., 36, 55-68, 1995. Cachier, H., Carbonaceous combustion aerosols, in Atmospheric Par-
ticles, edited by R. M. Harrison and R. E. van Grieken, pp. 295-348, John Wiley, New York, 1998.
Cachier, H., M.P. Br•mond, and P. Buat-M•nard, Determination of atmospheric soot carbon with a simple thermal method, Tellus, Ser.
B, 41, 379-390, 1989.
Cachier, H., C. Liousse, M. H. Pertuisot, A. Gaudichet, F. Echalar, and
J.P. Lacaux, African fire particulate emissions and atmospheric influence, in Biomass Burning and Global Change, edited by J. S. Levine, pp. 428-440, MIT Press, Cambridge, Mass., 1996. Cantrell, W., G. Shaw, and R. Benner, Cloud properties inferred from
bimodal aerosol number distributions, J. Geophys. Res., 104, 27,615-
27,624, 1999.
Charlson, R. J., S. E. Schwartz, J. M. Hales, R. D. Cess, J. A. Coakley Jr., J. E. Hansen, and D. J. Hofman, Climate forcing by anthropo- genic aerosols, Science, 255, 423-430, 1992.
Cruz, C., and S. Pandis, Effect of organic coatings on the cloud con- densation nuclei activation of inorganic atmospheric aerosol, J. Geo- phys. Res., 103, 13,111-13,123, 1998.
Fitzgerald, J. W., Dependence of the supersaturation spectrum of CCN on aerosol size distribution and composition, J. Atmos. Sci., 30,
628-634, 1973.
Gill, P.S., T. E. Graedel, and C. J. Weschler, Organic films on atmo- spheric aerosol particles, fog droplets, cloud droplets, raindrops, and snowflakes, Rev. Geophys., 21, 903-920, 1983.
Gras, J. L., CN, CCN, and particle size in Southern Ocean air at Cape
Grim, Atmos. Res., 35, 233-251, 1995.
Hansson, H.-C., M. J. Rood, S. Koloutsou-Vakakis, K. Hfimeri,
D. Orsini, and A. Wiedensohler, NaC1 aerosol particle hygroscop-
icity dependence on mixing with organic compounds, J. Atmos.
Chem., 31, 321-346, 1998.
Hoppel, W. A., Measurement of the size distribution and CCN super-
saturation spectrum of submicron aerosols over the ocean, J. Atmos.
Sci., 36, 2006-2015, 1979.
Jayaraman, A., D. Lubin, S. Ramachandran, V. Ramanathan, E. Woodbridge, W. D. Collins, and K. S. Zalpuri, Direct observa- tions of aerosol radiative forcing over the tropical Indian Ocean during the January-February 1996 pre-INDOEX cruise, J. Geophys.
Res., 103, 13,827-13,836, 1998.
Ji, Q., G. Shaw, and W. Cantrell, A new instrument for measuring
cloud condensation nuclei: Cloud Condensation Nucleus "Remov-
er," J. Geophys. Res., 103, 28,013-28,019, 1998.
Krishnamurti, T. N., B. Jha, J. M. Prospero, A. Jayaraman, and V. Ramanathan, Aerosol and pollutant transport and their impact
on radiative forcing over the tropical Indian Ocean during the Janu-
ary-February 1996 pre-INDOEX cruise, Tellus, Ser. B, 50, 521-542,
1998.
Leck, C., and C. Persson, Seasonal and short-term variability in dim- ethylsulfide, sulfur dioxide and biogenic sulfur and sea salt aerosol particles in the Arctic marine boundary layer during summer and autumn, Tellus, Ser. B, 48, 272-299, 1996.
Li, Z., A. Williams, and M. J. Rood, Influence of soluble surfactant
properties on the activation of aerosol particles containing inorganic solute, J. Atmos. Sci., 55, 1859-1866, 1998.
Liu, P.S. K., W. R. Leaitch, C. M. Banic, S.-M. Li, D. Ngo, and W. J. Megaw, Aerosol observations at Chebogue Point during the 1993 North Atlantic Regional Experiment: Relationships among cloud condensation nuclei, size distribution, and chemistry, J. Geophys.
Res., 101, 29,971-29,990, 1996.
Matsumoto, K., H. Tanaka, I. Nagao, and Y. Ishizaka, Contribution of particulate sulfate and organic carbon to cloud condensation nuclei in the marine atmosphere, Geophys. Res. Lett., 24, 655-658, 1997. Matsumoto, K., I. Nagao, H. Tanaka, H. Miyaji, T. Iida, and Y. Ikebe,
Seasonal characteristics of organic and inorganic species and their size distributions in atmospheric aerosols over the northwest Pacific Ocean, Atmos. Environ., 32, 1931-1946, 1998.
Meywerk, J., and V. Ramanathan, Observations of the spectral clear-
sky aerosol forcing over the tropical Indian Ocean, J. Geophys. Res.,
104, 24,359-24,370, 1999.
Novakov, T., and J. E. Penner, Large contribution of organic aerosols
to cloud-condensation-nuclei concentrations, Nature, 365, 823-826,
1993.
Pincus, R., and M. B. Baker, Effect of precipitation on the albedo susceptibility of clouds in the marine boundary layer, Nature, 372,
350-352, 1994.
Pinnick, R. G., S. G. Jennings, and G. Fernandez, Volatility of aerosols in the arid southwestern United States, J. Atmos. Sci., 44, 562-576,
1987.
Rhoads, K. P., P. Kelley, R. R. Dickerson, T. P. Carsey, M. Farmer,
D. L. Savoie, and J. M. Prospero, Composition of the troposphere
over the Indian Ocean during the monsoonal transition, J. Geophys.
Res., 102, 18,981-18,995, 1997.
Rivera-Carpio, C. A., C. E. Corrigan, T. Novakov, J. E. Penner, C. F. Rogers, and J. Chow, Derivation of contributions of sulfate and
carbonaceous aerosols to cloud condensation nuclei from mass size
distributions, J. Geophys. Res., 101, 19,483-19,493, 1996.
Saxena, P., L. M. Hildemann, P. H. McMurry, and J. H. Seinfeld, Organics alter hygroscopic behavior of atmospheric particles, J. Geo- phys. Res., 100, 18,755-18,770, 1995.
Seinfeld, J. H., and R. C. Flagan, Aerosol-cloud interactions and in- direct forcing, IGACtiv. Newsl., 17, 9-11, 1999.
Seinfeld, J., and S. Pandis, Atmospheric Chemistry and Physics, 1326 pp., John Wiley, New York, 1998.
Shulman, M., M. C. Jacobsen, R. J. Charlson, R. E. Synovec, and T. E. Young, Dissolution behavior and surface tension effects of organic compounds in nucleating cloud droplets, Geophys. Res. Lett., 23,
277-280, 1996.
Stumm, W., and J. J. Morgan, Aquatic Chemistry, 780 pp., John Wiley,
New York, 1981.
Svenningsson, B., H.-C. Hansson, A. Wiedensohler, J. A. Ogren, K. J.
Noone, A. Hallberg, and R. Colvile, Hygroscopic growth of aerosol
particles in the Po-valley, Tellus, Ser. B, 44. 556-569, 1992. Svenningsson, B., H.-C. Hansson, A. Wiedensohler, K. Noone,
J. Ogren, A. Hallberg, and R. Colvile, Hygroscopic growth of aero- sol particles and its influence on nucleation scavenging in cloud:
15,320 CANTRELL ET AL.: AEROSOL AND CCN ON AN INDIAN OCEAN TRANSECT
Experimental results from Kleiner Feldberg, J. Atmos. Chem., 19,
129-152, 1994.
Twomey, S., Aerosols, clouds and radiation, Atmos. Environ., 11, 2435-
2442, 1991.
Wulfmeyer, V., and G. Feingold, On the relationship between relative humidity and particle backscattering coefficient in the marine
boundary layer determined with differential absorption lidar, J. Geo- phys. Res., 105, 4729-4742, 2000.
H. Cachier, Laboratoire Mime CEA-CNRS, Domaine du CNRS,
Bat 12, Ave de la Terrasse, 91 198-Gif sur Yvette Cedex, France.
W. Cantrell, Department of Chemistry, Indiana University, Bloom-
ington, IN 47405. (wcantrel@indiana.edu)
L. Granat and C. Leck, Department of Meteorology, Stockholm University, S-10691 Stockholm, Sweden.
G. Shaw, Geophysical Institute, University of Alaska Fairbanks,
Fairbanks, AK 99775.
(Received December 30, 1999; revised March 24, 2000; accepted March 31, 2000.)


![Copper‐Rich Thermoelectric Sulfides: Size‐Mismatch Effect and Chemical Disorder in the [TS4]Cu6 Complexes of Cu26T2Ge6S32 (T=Cr, Mo, W) Colusites](data:image/gif;base64,R0lGODlhAQABAIAAAP///wAAACH5BAEAAAAALAAAAAABAAEAAAICRAEAOw==)