HAL Id: hal-01315499
https://hal.archives-ouvertes.fr/hal-01315499
Submitted on 3 May 2018HAL is a multi-disciplinary open access archive for the deposit and dissemination of sci-entific research documents, whether they are pub-lished or not. The documents may come from teaching and research institutions in France or abroad, or from public or private research centers.
L’archive ouverte pluridisciplinaire HAL, est destinée au dépôt et à la diffusion de documents scientifiques de niveau recherche, publiés ou non, émanant des établissements d’enseignement et de recherche français ou étrangers, des laboratoires publics ou privés.
Subsurface Disorder and Electro-Optical Properties of
Proton-Exchanged LiNbO 3 Waveguides Produced by
Different Techniques
Sergey Kostritskii, Yuri Korkishko, V. Fedorov, V. Mitrokhin, O. Sevostyanov,
I. M. Chirkova, O Stepanenko, M de Micheli
To cite this version:
Sergey Kostritskii, Yuri Korkishko, V. Fedorov, V. Mitrokhin, O. Sevostyanov, et al.. Subsurface Disorder and Electro-Optical Properties of Proton-Exchanged LiNbO 3 Waveguides Produced by Different Techniques. Journal of the European Optical Society : Rapid publications, European Optical Society, 2014, J. Europ. Opt. Soc. Rap. Public. 9, 14055 (2014), �10.2971/jeos.2014.14055�. �hal-01315499�
Subsurface Disorder and Electro-Optical Properties of Proton-Exchanged
LiNbO
3Waveguides Produced by Different Techniques
S.M. Kostritskii1, Yu.N. Korkishko1, V.A. Fedorov1, V.P. Mitrokhin1, O.G. Sevostyanov2, I.M. Chirkova2, O. Stepanenko3*, M. De Micheli3
1RPC Optolink Ltd, 124489, Zelenograd, Russia,
2Phys. Dept., Kemerovo State University, 650043, Kemerovo, Russia, 3LPMC, University Nice Sophia-Antipolis, 06100 Nice Cedex, France,
*Present address : MPQ, University Paris Diderot,2, Place Jussieu, 75251 Cedex 05 Paris
skostritskii@optolink.ru
It has been established, that proton-exchanged LiNbO3 waveguides have a marked subsurface layer with structural disorder inducing degradation of electro-optical properties of these waveguides. At the same time, such a subsurface disorder is found to be less pronounced in soft proton-exchanged (SPE) waveguides in comparison with annealed proton-exchanged (APE) ones. The experimental samples of phase modulators fabricated by SPE technique exhibit a better electro-optical efficiency compared to the LiNbO3 modulators produced by the standard and improved APE techniques.
Keywords: optical waveguides, electro-optic effect, lithium niobate, proton exchange
1. INTRODUCTION
Annealed proton exchange (APE) is now an established technique for fabricating integrated optical devices in LiNbO3, as it allows obtaining low-loss waveguides with good electro-optical (EO) performances [1]-[4]. Note that a significant degradation (more than one order of magnitude) of the EO coefficients occurs immediately after the proton exchange process [1, 2]. However, after an appropriate annealing in order to obtain LiNbO3 waveguides in the so-called α-phase [2]-[4], the EO coefficients have almost recovered their initial values. Nevertheless, EO coefficients cannot be completely restored even after a long annealing, when the initial proton exchange has been performed using conditions that are in common use today [1]-[4]. It was shown [5] that an extended annealing in dry air at T ≥ 320 oC, leads to the precipitation of disordered phases in a subsurface layer (depth ≤ 0.5 µm), causing undesirable degradation of the EO properties of the waveguide. Such degradation could be interpreted as the field-screening effect in the highly structurally disordered parts of the proton exchanged regions below the surface. Besides, it was recently reported [6] that this subsurface disorder provides some marked level of propagation loss related mainly to guided mode scattering within inhomogeneous near-surface part of the waveguide,and also, significant loss of optical nonlinearity [7]. It has been established [5] that the loss of water during annealing is a major contributor to the formation of crystalline disorder and, therefore, annealing under a high pressure of water vapour prevents such a disorder to appear. However, using this
method only a partial suppression of the subsurface disorder and the related degradation of waveguide properties were obtained [8]. In this paper we show that, using the soft proton exchange (SPE) process
[9,10, 11] recognised as allowing the fabrication of low loss and highly efficient nonlinear components, we obtain waveguides in the α-phase [12, 13] and free from any water loss [6, 8, 14], andtherefore, we avoid completely these undesirable effects.
2. EXPERIMENT
We started by fabricating a set of planar waveguides on Z-cut LiNbO3. The study of these test samples allowed us to determine the fabrication parameters, to use in order to get a low-loss single mode channel waveguide, operating at a chosen wavelength. We choose to optimize our procedure to operate between 1530 and 1560 nm, as the fabrication of EO modulators, operating in the third telecommunication window, has already been developed. The fabrication parameters were chosen in order to obtain a waveguide composed quasi exclusively of a homogeneous α-phase layer. To determine the phase composition of the exchanged layer, we used the structural phase diagram of HxLi1-xNbO3 solid solution
[8, 14].
The APE waveguides were fabricated with standard APE technique (APE1 sample was annealed in dry air at 360 °C) [2] and improved APE technique (APE2 sample was annealed in wet air at 360 °C) [5, 8]. The initial proton exchange of these samples was performed in pure benzoic acid at 175 °C for 6 hours. Parameters of such an as-exchanged sample (denoted as PE) were measured in order to have reference data. Sequent annealing was made for 7 hours. SPE waveguide was fabricated in sealed ampoule [9, 10]
and with a benzoic acid melt containing 2.9% of lithium benzoate (LB).
Fig. 1. Schematic draw of subsurface layer study with specular IR reflection. d is thickness of the subsurface disordered part of a proton-exchanged LiNbO3 waveguiding layer. Photometered depth, dp,
at IR reflection measurements is limited by penetration depth of IR radiation in near-surface layer at glancing incidence. Hence dp ≤ 1 µm that is about d.
Subsurface disorder was studied with micro-Raman and IR-reflection spectroscopy technique, as broadening of Raman phonon bands and decrease of reflectivity are well-established clear indications of a marked structural disorder in LiNbO3 [8, 15]. Raman spectroscopy was performed on planar and channel waveguides with the aid of a Jobin-Yvon LabRam HR800 spectrometer operating at excitation wavelength of 632.8 nm. Spectra were measured in the autofocus operation mode of the spectrometer, using a ×100 objective and a confocal hole of width = 50 µm. The IR-reflection spectra with the incidence angle Θ varying from 20 to 80° (Figure 1) were measured with an IR-spectrophotometer “Bruker VERTEX 80v”.
Transmission spectra in the visible and near-UV ranges were taken with a Shimadzu UV- 3101PC spectrophotometer. The optical absorption spectroscopy data in the visible and the near UV ranges can be used to evaluate the electro-optical r13 coefficients of the proton-exchanged waveguides in LiNbO3 crystal. Indeed, the shift of fundamental absorption edge, i.e. the reduction of the band-gap energy ΔEg, has been related to the decrease of spontaneous polarization P and, therefore, of the electro-optic coefficient r13[16, 17].
For direct measurement of the EO effect in the different HxLi1-xNbO3 phases, we fabricated several phase modulators consisting in a channel APE waveguide in a 0.5-mm-thick z-cut LiNbO3 substrate surrounded by two coplanar electrodes. The EO efficiencies of the modulators were measured using a super luminescent diode (central wavelength ~1550 nm and a bandwidth of 50 nm) and a Sagnac fibre interferometer. Therefore, the phase modulator was pigtailed by PM fibre at both ends input and output.
3. RESULTS AND DISCUSSION
Our data give the direct evidence of high structural disorder, as the strong broadening of the Raman lines (see Figure 2) shows clearly an increase of the phonon damping (related to crystalline disorder [14]) in the PE and APE waveguides with any HxLi1-xNbO3 phase, even α-phase with low x. The proton exchange degree, x, has been determined using its well known relations with the exchange-induced refractive index change Δn(e) , determined from dark m-lines spectroscopy data and from Raman data on phonon frequencies [8, 14, 18].
The region of Raman spectra ranging from 550 cm-1 to 900 cm-1 have been studied in details (Figure 2 and Table 1), as important information on the structural disordercan be obtained from Raman data of this range [8]. In particular the A1(LO)-phonon mode was established to be a good marker of structural disorder [8, 20]. It has been demonstrated that the shape of the related Raman band is markedly affected by the presence of structural disorder. According to the significant difference in FHWM of this Raman band between waveguides studied, it’s evident that subsurface disorder in SPE waveguides fabricated at appropriate conditions, e.g. SPE sample, is much smaller than in any APE samples. The clear broadening of the A1(LO) mode peak in APE waveguides is accompanied by an increase of the signal in the extra band cantered at about 660 - 690 cm-1. Such an extra band has been attributed to structural disorder in Nb-O ferroelectric chains [20]. In this energy region the fitting procedure is more difficult due to the superposition of different modes. Nevertheless, the comparative study of the structural disorder in the
different waveguides is possible and, thus, one can observe that for the SPE waveguides this extra band is much smaller, demonstrating a less disordered structure, if compared with APE waveguides.
Fig. 2. Raman spectra of the subsurface part of the different samples: PE, APE1, APE2, SPE and z0 (notation meaning is given in Table 1). This samples order corresponds to spectra sequence from bottom
to top at 871 cm-1 (the wavenumber of A
1(LO)-phonon band).
Table 1
sample
IR
F
Raman
Δν
1/2, cm
-1Raman
I
LO/I
TORaman
I
extra/I
TOUV-absorption
ΔЕ
g,S(o), eV
r
S(loc)/r
0z0,
pure
LN
0
29.7
3.5
0
0
1
SPE
0.05
35.3
3.2
0.14
-0.010
0.93
APE2
0.082
40.5
3.1
0.18
-0.013
0.90
APE1
0.095
44.1
3.0
0.24
-0.016
0.88
PE
(no
annealing)
0.298
37.8
1.5
2.6
-0.119
0.19
Table 1. Sample notation, F is the disorder factor, Δν1/2 is the FWHM of the Raman A1(LO)-phonon band at 871 cm-1, ILO and Iextra are the Raman intensities of the A1(LO)-phonon band and extra band,
ΔЕg,S(o) is the band-gap shift for the ordinary polarization and rS(loc)/r0 is the normalized values of local electro-optic coefficient r13.
Besides, Raman intensity of this band was measured focusing the laser beam at different depth in the waveguides. The surface Raman intensity of this extra band is much higher than that obtained when the laser spot is at depth greater than 1.5 µm for any APE waveguide fabricated. For the SPE waveguide it is evident that the damaged surface layer is less pronounced and thinner than that of the “best” APE
waveguide, as the extra band intensity at the surface is always smaller and decreases more rapidly with depth, reaching the bulk value at a depth as small as 1.0 µm.
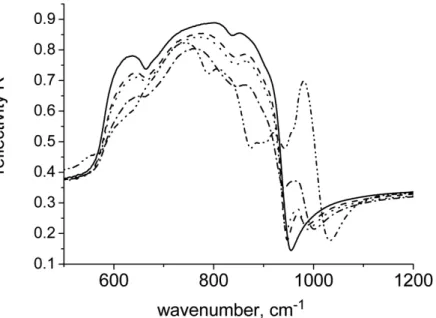
This result is confirmed by the measurement of the glancing IR-reflection. In this experiment, an attenuation of the reflectivity R within wavenumbers ν range 580 to 880 cm-1 (Figure 3) is an indication of structural disorder. The disorder factor F = 1 – Rs/R0, with Rs and R0 being the IR-reflection coefficients measured at Θ = 80° in a sample with a HxLi1-xNbO3 waveguide and a pure LiNbO3, respectively can be evaluated from these data [8, 15]. According to the data on vibrational spectra of disordered solids [15], such an attenuation of R could be interpreted as phonon scattering effects in the highly structurally disordered parts of the proton exchanged regions. Note, that the photometered depth of near-surface area at reflectivity maximum (i.e., within range of the so-called residual rays [15]) is about 1 µm for glancing incidence of IR-radiation (i.e., when reflection angle Θ ≥ 70°), Figure 1. Indeed, the photometered depth becomes much more significant at reflection angles that are far from glancing reflection and closer to the normal incidence [12]. Our data for all the studied APE and SPE waveguides show, that a relative attenuation of R (normalized to reflectivity value measured in virgin LiNbO3 at a given Θ) tends to 0 at such a decrease of Θ. Thus IR-reflection factor F is a well adapted parameter to study the subsurface part of the waveguides.
Fig. 3. IR-reflection spectra of the different samples measured at glancing incidence (incidence angle Θ=80°): PE, APE1, APE2, SPE and z0. This samples order corresponds to spectra sequence from bottom
to top at 871 cm-1. Incident IR light was s-polarized (i.e., it was polarized perpendicular to plane of
incidence (Fig. 1)).
It is well known that proton exchange waveguides present a drastic decrease of the spontaneous polarization P0 [8, 15] and polarizability [7]. This variation of P0 is related to the shift of the absorption edge [16, 17], i.e. the change of the band gap energy ΔEg:
ΔEg ≈ aΔP0P0 (1) with a = - 0.35 eV m4/C2 [8]
Since linear EO effect is basically a quadratic effect biased by the P0, we can write:
r13,S/r13,0 = (η0/ηS)3×{1 + (ΔEg,s)/(aP0)2} (2) where η is the packing density, subscripts s and 0 indicate values for HxLi1-xNbO3 waveguide and virgin LiNbO3 crystals, respectively. Note, that the values of ΔEg,s= Еg,s – Еg,0 have a negative sign in all the
waveguides studied, as we observe a red-shift of the absorption edge in HxLi1-xNbO3 waveguide compared to virgin LiNbO3 (Figure 4). Band-gap energy Eg,s can be estimated from data on the apparent fundamental absorption edge Es(m) in the studied sample [8] with the following equation :
Еg,s = Еs(m) + {(Еg,0 - Еs(m))2 + (γ/2)2 ln(hD0)/LDs)}1/2 (3) where, Еn(m) is the measured energy of the absorption edge, h is the thickness of the waveguiding layer, γ is the damping coefficient of the electronic oscillator, D0 is the optical density in pure LiNbO3 at Еs(m), Ds = Ds(m) – D0 is the optical density of the PE layer, Ds(m) is the optical density at Еs(m), L is the sample thickness. The values of γ are different for ordinary and extraordinary polarization: γ(o) = 0.547 eV and γ(e) = 0.702 eV [8].
By using the data on the band-gap shift, the so-called local (microscopic) values of the EO coefficient r13 were evaluated by Eq.(1) for all the fabricated samples, Table 1. The results obtained demonstrate a significant dependence of the microscopic EO susceptibility on the phase composition of the APE and SPE waveguides. To determine phase composition of SPE and APE waveguides, we use Raman and IR-reflection spectroscopy, as each HxLi1-xNbO3 phase has a specific phonon spectrum [6, 8, 19].
Fig. 4. Optical absorption spectra of the different samples: z0, SPE, APE1 and PE. This samples order corresponds to spectra sequence from left to right side at D = 2. Absorption spectrum of z-cut wafer of a pure congruent LiNbO3 crystal (sample z0) is given as reference data for evaluation of band-gap energy
For direct measurement of EO effect in the different HxLi1-xNbO3waveguides, we fabricated the EO phase modulators based on channel APE waveguides in a 0.5-mm-thick x-cut LiNbO3 substrate. The electrode structure consists in two electrodes coplanar with the waveguide. In our case of Z-cut, Y-propagating geometry of single-mode APE and SPE LiNbO3 waveguides, the effective value of electro-optic coefficient r13(eff) is inversely proportional to the half-wave voltage V of a phase modulator :
r13(eff) = (λG/n3eVπOL), (4)
where L is the length of the electrodes in each arm, G is the gap width between the electrodes, O is the overlap factor between the field created by the electrodes and the optical mode, λ is the wavelength of the guided light (central wavelength of SLD used is 1534 nm), ne is the effective refractive index of the TM0 mode.
The local values of r13 evaluated from ΔEg,s are larger than the effective values derived from the direct measurement of the EO efficiency of the phase modulators (Table 2) that can be related to the field-screening effect in a disordered subsurface part of the waveguide. This degradation of the effective values of the EO coefficient r13(eff) correlates with the IR-reflection data on structural disorder at subsurface area of waveguides:
r13(eff) ~ r13(loc)[1 - CF] (5)
Table 2
sample
APE1 [1]
APE1 our
APE2
SPE
PE**
r
13’(loc)
~0.85*
0.88
0.90
0.93
0.19
r
13’(eff)
0.69
0.80
0.85
0.90
≤ 0.1
F
~0.12*
0.095
0.082
0.05
0.22
*- values evaluated by us for test samples fabricated by technique reported in Ref.[1]
**- values for a sample proton-exchanged in pure benzoic acid at 175 °C for 6 hours.
Table 2. The normalized values of local and effective electro-optic coefficient r13ʹ′ = r13,S/r13,0 , where r13,S and r13,0 are values for a sample S studied and pure LiNbO3. Ratio between r13’(eff) and
r13’(loc) correlates with actual value of disorder factor F.
Broadening of Raman band correlates with the variation of the disorder factor F, and, therefore, Raman data may be used for the evaluation of the disorder-induced reduction of the effective electro-optic coefficient. To reach easy possibility of such evaluation, we obtain experimental calibration curve for F vs Δν1/2 (it’s a FWHM of A1(LO)-phonon band), Figure 5. It should be noted, that micro-Raman spectroscopy can be used for study of channel waveguides in contrast to IR-reflection spectroscopy that requires the preparation of planar waveguides.
Considering that electro-optic susceptibility is directly related to Raman scattering cross-section [8, 21],
micro-Raman measurements were performed to detect any change in the Raman active phonon modes. It is also known that the contribution of the Nb-O bond to the linear and nonlinear susceptibility is larger
than the contributions of the Li-O bond. Mode at 870 cm-1, associated with the Nb-O6 octahedron belongs to the dominant contributors to the EO effect [19, 20]. Therefore, a simple correlation between the related Raman intensities and the electro-optic coefficients can be found. In fact, recent findings show that attenuation of Raman intensity (ILO) of the LO-phonon band at 871 cm-1 are related to the decrease of the local electro-optic response [8, 21]. Moreover, measurement of Raman intensities of certain phonon bands allows for rough estimation of local values of electro-optic coefficients in waveguides in different areas of any proton-exchanged LiNbO3 channel waveguide.
Fig. 5. Correlation between disorder factor F determined from IR-reflection data and broadening of the Raman band at 871 cm-1. Δν1/2 is the change of FWHM of this Raman band measured in subsurface area
with confocal micro-Raman spectroscopy. 4. CONCLUSION
In this paper we first describe new simple methods to estimate the disorder and the reduction of the EO coefficients induced in LiNbO3 by the different kind of known proton exchange processes. The experimental characterizations of a set of planar waveguides fabricated by different PE techniques show that the SPE process allows preparing devices with the smaller degradation of the crystalline quality of the subsurface layer and the smaller reduction of the effective electro-optic coefficient. This is confirmed by the characterization of a set of phase modulators prepared by the standard and the improved APE techniques as well as by SPE. SPE devices exhibit the higher electro-optical efficiency and the lower propagation losses. We can also expect that the SPE modulators will present a low drift of the DC bias, as subsurface disorder was previously identified as a key source of such a drift.
References
1. M. Rottschalk, A. Rasch, and W. Karthe, “Electrooptic behaviour of proton-exchanged LiNbO3 optical waveguides,” J. Opt. Commun. 9, 19-23 (1988).
2. A. Loni, R.M. De La Rue, and J.M. Winfield, “Very low-loss proton-exchanged waveguides with a substantially restored electro-optic effect,” Topical Meeting on Integrated and Guided Wave Optics, Paper MD3-1, Houston, TX, 1989.
3. T.T. Lay, Y. Kondo, and Y. Fujii, “Effect of annealing on electrooptic constant of undoped and the MgO-doped lithium niobate optical waveguides,” IEICE Transactions E 74, 3870-3872 (1991). 4. R. Narayan, “Electrooptic coefficient variation in proton-exchanged and annealed lithium niobate
samples,” IEEE. J. of Selected Topics in Quantum Electron. 3, 796-807 (1997).
5. H.G. Muller, A.D. Stapleton, B.J. Foran, G. Radhakrishnan, H.I. Kim, P.M. Adams, R.A. Lipeles, and P. Herman, “Reduction of lattice defects in proton-exchanged lithium niobate waveguides,” J. Appl. Phys. 110, 033539 (2011).
6. S.M. Kostritskii, Y.N. Korkishko, V.A. Fedorov, A.N. Alkaev, V. Kritzak, P. Moretti, S. Tascu, and B. Jacquier, “Leakage of a guided mode caused by static and light-induced inhomogeneities in channel HTPE-LiNbO3 waveguides”, Proc. SPIE. 4944, 346-352 (2003).
7. F. Laurell, M. G. Roelofs and H. Hsiung “Loss of optical nonlinearity in proton-‐exchanged LiNbO3 waveguides”, Appl. Phys. Lett. 60, 301-303 (1992).
8. S.M. Kostritskii, S.V. Rodnov, Yu.N. Korkishko, V.A. Fedorov, and O.G. Sevostyanov, “Electro-Optical Properties of Different HxLi1-xNbO3 Phases in Proton-Exchanged LiNbO3 Waveguides”, Ferroelectrics 440, 47-56 (2012).
9. L. Chanvillard, P. Aschieri, P. Baldi, D.B. Ostrowsky and M. De Micheli; L. Huang and D.J. Bamford, " Soft Proton Exchange on PPLN: a simple waveguide fabrication process for highly efficient nonlinear interactions" Applied Physics Letters Vol. 76(9), p.1089 (Fev. 2000)
10. D. Castaldini, P. Bassi, S. Tascu, P. Aschieri, M.P. De Micheli, and P. Baldi,””Soft proton exchange tapers for low-insertion loss LiNbO3 devices”, J. Lightwave Technol. 25, 1588-1593 (2007).
11. MP De Micheli, " Fabrication and Characterization of Proton Exchanged Waveguides in Periodically Poled Congruent Lithium Niobate", Ferroelectrics, 340:49–62, 2006
12. M. De Micheli, D. Ostrowsky, J. Barety, C. Canali, A. Carnera, G. Mazzi, and M. Papuchon, “Crystalline and optical quality of proton exchanged waveguides,” J. Lightwave Technol. 4, 743 – 745 (1986).
13. Yu. N. Korkishko, V.A. Fedorov, M. De Micheli, K. El Hadi, P. Baldi, A. Leycuras. “Relationships between structural and optical properties of proton-exchanged waveguides on Z-cut lithium niobate." Applied Optics (Dec. 1996), Vol. 35, N° 36, pp. 7056-7060
14. Y.N. Korkishko, V.A. Fedorov, E.A. Baranov, M.V. Proyaeva, T.V. Morozova, F. Caccavale, F. Segato, C. Sada, and S.M. Kostritskii, “Characterization of α-phase soft proton-exchanged LiNbO3 optical waveguides”, J. Opt. Soc. Am. A. 18, 1186-1191 (2001).
15. A.S. Barker, and A.J. Sievers, “Optical studies of the vibrational properties of disordered solids”, Rev. Modern Phys. 47, 1-179 (1975).
16. H. Ahlfeldt, J. Webjorn, P.A. Thomas, and S.J. Teat, “Structural and optical properties of annealed proton-exchanged waveguides in z-cut LiTaO3,” J. Appl. Phys. 77, 4467-4476 (1995).
17. S.H. Wemple, M. Di Domenico, and I. Camlibel, “Relationship between linear and quadratic electro-optic coefficients in LiNbO3,”Appl. Phys. Lett. 12, 209 –212 (1968).
18. M. Di Domenico, and S.H. Wemple, “Oxygen-octahedra ferroelectrics. I. Theory of electro-optical and nonlinear optical effects,” J. Appl. Phys. 40, 720-732 (1969).
19. M. Kuneva, and S. Tonchev, “Spectroscopy of optical waveguiding layers”, Bulgarian Chemical Communications 43, 276–287 (2011).
20. G.R. Paz-Pujalt, D.D. Tuschel, G. Braunstein, T. Blanton, S. Tong Lee, and L.M. Salter, “Characterization of Proton-Exchange Lithium-Niobate Wave-Guides,” J. Appl. Phys. 76, 3981-3987 (1994).
21. I.P. Kaminow, and W.D. Johnston, “Quantitative Determination of Sources of electro-optic effect in LiNbO3 and LiTaO3,” Phys. Rev. 160, 519-522 (1967).