HAL Id: hal-02307079
https://hal-univ-rennes1.archives-ouvertes.fr/hal-02307079
Submitted on 19 Nov 2019
HAL is a multi-disciplinary open access
archive for the deposit and dissemination of sci-entific research documents, whether they are pub-lished or not. The documents may come from teaching and research institutions in France or abroad, or from public or private research centers.
L’archive ouverte pluridisciplinaire HAL, est destinée au dépôt et à la diffusion de documents scientifiques de niveau recherche, publiés ou non, émanant des établissements d’enseignement et de recherche français ou étrangers, des laboratoires publics ou privés.
Complexes of Cu26T2Ge6S32 (T=Cr, Mo, W) Colusites
Ventrapati Pavan Kumar, Gabin Guélou, Pierric Lemoine, Bernard Raveau,
Andrew R Supka, Rabih Al Rahal Al Orabi, Marco Fornari, Koichiro Suekuni,
Emmanuel Guilmeau
To cite this version:
Ventrapati Pavan Kumar, Gabin Guélou, Pierric Lemoine, Bernard Raveau, Andrew R Supka, et al.. Copper-Rich Thermoelectric Sulfides: Size-Mismatch Effect and Chemical Disorder in the [TS4]Cu6 Complexes of Cu26T2Ge6S32 (T=Cr, Mo, W) Colusites. Angewandte Chemie International Edition, Wiley-VCH Verlag, 2019, 58 (43), pp.15455-15463. �10.1002/anie.201908579�. �hal-02307079�
Copper-rich thermoelectric sulfides: size mismatch effect and chemical disorder in the
[TS4]Cu6 complexes of Cu26T2Ge6S32 (T = Cr, Mo, W) colusites
Ventrapati Pavan Kumar,# Gabin Guélou,# Pierric Lemoine, Bernard Raveau, Andrew Supka,
Rabih Al Rahal Al Orabi,* Marco Fornari,* Koichiro Suekuni, Emmanuel Guilmeau*
Dr. V. Pavan Kumar, Dr. G. Guélou, Prof. B. Raveau, Dr. E. Guilmeau
CRISMAT, CNRS, Normandie Univ, ENSICAEN, UNICAEN, 14000 Caen, France Email: emmanuel.guilmeau@ensicaen.fr
Dr. P. Lemoine
Univ Rennes, CNRS, ISCR – UMR 6226, F-35000 Rennes, France Dr. A. R. Supka, Dr. R. Al Rahal Al Orabi, Prof. M. Fornari
Department of Physics and Science of Advanced Materials Program, Central Michigan University, Mt. Pleasant, MI 48859, USA
Email: forna1m@cmich.edu
Dr. K. Suekuni
Department of Applied Science for Electronics and Materials, Interdisciplinary Graduate School of Engineering Sciences, Kyushu University, Kasuga, Fukuoka 816-8580, Japan Dr. R. Al Rahal Al Orabi
Solvay, Design and Development of Functional Materials Department, Axel’One, 87 avenue des Frères Perret, 69192 Saint Fons, Cedex, France
Email: rabih.orabi@solvay.com
Keywords: thermoelectric; sulfide; colusite; conductive network; size mismatch
Accepted
Abstract
In the present study, we investigate the Mo and W for Cr substitution in the synthetic mineral colusite, Cu26Cr2Ge6S32. Primarily, we elucidate the origin of extremely low electrical resistivity which does not compromise the Seebeck coefficient and leads to outstanding power factors of 1.94 mW m-1 K-2 at 700 K in Cu
26Cr2Ge6S32. We demonstrate that the abnormally long iono-covalent T-S bonds competing with short metallic Cu-T interactions govern the electronic transport properties of the conductive “Cu26S32” framework. Additionally, we address the key role of the cationic size-mismatch at the core of the mixed tetrahedral-octahedral complex, illustrated by the cation-size variance, σ2, over the transport properties. Using a combination of experimental and theoretical tools, the explanation for the remarkable electrical and thermal transport properties of the Cu26Cr2-xMoxGe6S32 and Cu26Cr2-xWxGe6S32 solid solutions is discussed. In-depth structural analysis using Rietveld refinements of XRPD data reveals two essential effects caused by the substitution of Cr in the solid solutions: (1) Only the tetrahedra that are directly bonded to the [TS4]Cu6 complex are significantly distorted upon substitution and (2) the major contribution to the disorder is localized at the central position of the mixed tetrahedral-octahedral complex, and is maximized for x = 1, i.e. for the highest cationic size-variance, σ2. We investigated the low- (5 ≤ T / K ≤ 300) and high- (300 ≤ T / K ≤ 700) temperature electrical and thermal transport properties, including electrical resistivity, Seebeck coefficient, thermal conductivity, and Hall effect (low temperature only) measurements and linked the structural/chemical disorder to the radically different conduction
mechanisms in the Cu26Cr2-xMoxGe6S32 and Cu26Cr2-xWxGe6S32 solid solutions.
Accepted
1. Introduction
Interest for thermoelectric (TE) technology has been continuously growing in the last decade due to the needs to produce ecofriendly materials at low cost for conversion of waste heat into electricity. A host of materials has been investigated in the past,[1–3] often neglecting the need to reconcile efficiency with environment and cost constraints both from a composition and/or a processing perspective. For instance, telluride based materials exhibit good performances,[4–12] but are of value only for niche applications due to the escalating prize of tellurium. Therefore, other less costly compositions are more attractive, provided that the synthesis approaches are scalable to industrial settings.
In this respect, recent investigations on copper-rich sulfides reveal that these materials form a large class of p-type thermoelectrics with promising properties. Many thermoelectric copper based sulfides have indeed been synthesized by several groups: bornite Cu5FeS4,[13–15] germanite derivative Cu22Fe8Ge4S32,[16] stannoidite Cu8.5Fe2.5Sn2S12,[17] colusites Cu26T2M6S32 (T = V, Nb, Ta; M = Sn, Ge),[18–23] Cu2SnS3[24] and kesterite Cu2ZnSnS4,[25,26] and tetrahedrites Cu12-xTxSb4S13,[27–33] (T = Mn, Fe, Ni, Zn). Among these compounds, the colusites exhibit a quite attractive figure of merit ZT = S2T/ρκ (T being the absolute temperature, S the Seebeck
coefficient, ρ the electrical resistivity, and κ the thermal conductivity), i.e. ~ 0.93 at 675 K.[23] Recently, we showed that the introduction of hexavalent T6+ cations in colusites Cu
26T2Ge6S32 (T = Cr, Mo, W) allows to reach the highest power factors PF (=S2/ρ) among iono-covalent
sulfides, ranging from 1.15 mW m-1 K-2 at 700 K for W to a value of 1.94 mW m-1 K-2 for Cr without changing significantly the thermal conductivity κ.[34] We explained the exceptional transport properties of these sulfides by the presence of interstitial T cations forming mixed tetrahedral-octahedral [TS4]Cu6 complexes which influence the geometry of the conductive “Cu26S32” framework inducing, in this way, various structural distortions. This model was
Accepted
supported by first principles electronic structure and transport calculations bearing in mind that the size and electronegativity of the T cations may play a key role in those properties.
In order to shed light on the interplay between the chemical bonding and the transport properties of these materials, we have embarked on the study of the substitution of molybdenum and tungsten for chromium in the sulfide Cu26Cr2Ge6S32 which exhibitsoutstanding thermoelectric properties. We show, herein, that the transport properties of the solid solutions Cu26Cr
2-xMoxGe6S32 and Cu26Cr2-xWxGe6S32 are closely correlated to the evolution of the chemical bonding in the conductive “Cu26S32” framework and to the cationic disorder, and are clearly governed by the size of the T cations and the size mismatch, σ2, at the T site in the [TS4]Cu6 complexes (T = Cr, Mo, W). We rely on the unique transport properties of the solid solutions in order to understand the origin of the outstanding thermoelectric performances of Cu26Cr2Ge6S32.
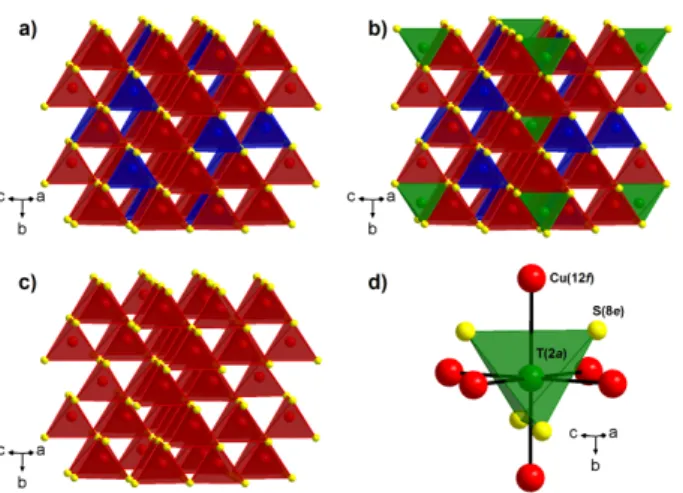
Figure 1. View of the (a) ordered sphalerite framework “Cu26Ge6S32” resulting from the
omission of T(2a) atoms, (b) Cu26T2Ge6S32 colusite structure, (c) conductive “Cu26S32” framework and (d) mixed tetrahedral–octahedral complex [TS4]Cu6. Cu, Ge and T cations are depicted in red, blue and green respectively, S anions are shown in yellow.
2. Results and discussions
Accepted
2.1. Structural evolution of the solid solutions Cu26Cr2-xMoxGe6S32 and Cu26Cr2-xWxGe6S32
First reported for the mineral Cu24+xV2(As,Sb)6-x(Sn,Ge)xS32 (x ≤ 2),[35,36] the colusite crystallizes in the cubic 𝑃4#3𝑛 space group (No. 218) with a unit cell parameter a ranging between 10.54 and 10.62 Å. The analysis of this structure shows that it derives from the sphalerite ZnS (𝐹4#3𝑚, No. 216, a ~ 5.4 Å) cubic structure, where Zn atoms are replaced by Ge
and Cu atoms, in an ordered way, leading to a doubling of the cell parameter in the three directions. Thus, the Cu26T2Ge6S32 colusites consist of an ordered, but distorted “Cu26Ge6S32” sphalerite framework (Fig. 1a) built up of corner-sharing GeS4 and CuS4 tetrahedra. The latter displays tetrahedral cavities where “interstitial” T cations are located, TS4 tetrahedra sharing their edges with CuS4 tetrahedra (Fig. 1b). Bearing in mind that the Ge and T cations cannot participate directly to the electronic transport, this leads us to the concept of conductive “Cu26S32” framework (Fig. 1c) which is deduced from the ordered sphalerite arrangement by simply omitting the Ge atoms (6c site). Importantly, our previous study on colusites (with T = Cr, Mo, W)[34] showed that the interstitial T atoms (2a site) form mixed tetrahedral–octahedral complexes [TS4]Cu6 (Fig. 1d) with the S atoms (8e site) and the Cu atoms (12f site). In those complexes, abnormally long iono-covalent T-S bonds compete with short metallic Cu-T interactions and govern the electronic transport properties of the conductive “Cu26S32” framework mainly formed by univalent copper (6d, 12f, 8e sites) and sulfur (8e, 24i sites) atoms.
Rietveld refinements of the XRPD data recorded at room temperature were conducted for the solid solutions Cu26Cr2-xMoxGe6S32 and Cu26Cr2-xWxGe6S32. We considered the structural model used in our previous study on the Cu26T2Ge6S32 (T = Cr, Mo, W) colusites.[34] Cu atoms fully occupy the 6d, 8e and 12f sites, Ge atoms occupy the 6c site, while the “interstitial” 2a site is shared by either Cr and Mo atoms or Cr and W atoms (Table S1). The crystal structure
Accepted
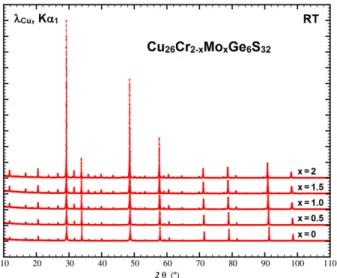
of colusite is completed by the sulfur framework, characterized by the full occupancy of two crystallographic sites: 8e and 24i (Table S1). A careful analysis of the XRPD patterns (See Fig.
2 for Mo-series and Fig. S1 for W-series) shows that all the samples are highly pure. Only traces
of WS2 were found in W-substituted samples and of Cu8GeS6 and Cu1.8S (< 1 wt.%) in the x = 2 samples. The Rietveld refinements of the XRPD patterns are displayed in Fig. S2, S3 and S4. Crystallographic parameters and interatomic distances calculated from these refinements are shown in Table S2 and Table S3, respectively.
Figure 2. XRPD patterns recorded at room temperature for the Cu26Cr2-xMoxGe6S32 series. For
better clarity, Rietveld refinements of the XRPD patterns are displayed in Fig. S2 and S3.
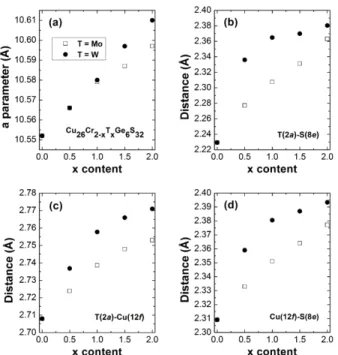
The evolution of the cubic cell parameter of the solid solutions Cu26Cr2-xMoxGe6S32 and Cu26Cr2-xWxGe6S32 as a function of x (Fig. 3a) shows a continuous increase as Cr is substituted by Mo or W in agreement with the ionic radii[41] of these elements, considered as being hexavalent in a pure iono-covalent bonding scenario (ionic radii of Mo6+ and W6+ are ~0.41 and 0.42 Å, respectively, whereas Cr6+ is significantly smaller ~0.26 Å).
Accepted
Figure 3. Variation of the (a) cell parameter a, (b) T(2a)-S(8e) distance, (c) T(2a)-Cu(12f)
distance and (d) Cu(12f)-S(8e) distance, with x in the Cu26Cr2-xTxGe6S32 (T = Mo, W) solid solutions. Error bars are within the symbols.
Rietveld refinements of XRPD patterns reveal that, in both series of samples, only the x coordinates of the Cu(12f), Cu(8e) and S(8e) atoms and the y coordinate of the S(24i) atoms evidence a significant evolution with the Mo for Cr or W for Cr substitutions; the x and z fractional coordinates of the S(24i) atoms being almost constant: 0.370(1) and 0.120(1), respectively. A detailed analysis of the refined atomic coordinates and of the corresponding isotropic thermal displacements is given in the supplementary information (Table S2, Fig. S5).
The evolution of the interatomic T(2a)-S(8e) and T(2a)-Cu(12f) distances (Table S3) which form the mixed tetrahedral–octahedral complexes [TS4]Cu6 (Fig. 1d) clearly shows that the latter vary significantly with the W or Mo for Cr substitution and indirectly influence the geometry of the “Cu26S32” conductive network. The comparison of the T-S distances vs. x in
Accepted
these complexes (Fig. 3b, Table S3) shows a different behavior for the W- and Mo-solid solutions, indicating that the pure ionic model cannot be applied. Indeed, the W-solid solution exhibits an abrupt increase of the T-S distances followed by a plateau as x increases, whereas, in contrast, the T-S distances in the Mo-solid solution increase almost linearly. The interatomic
T-S distances of the W-solid solutions are significantly larger than the ones of Mo-solid
solutions but the difference goes through a maximum as x increases. The presence of abnormally long iono-covalent T-S bonds is confirmed by bond valence sum (BVS) calculations.[37–39] One indeed observes for the T cation an oxidation state much smaller than the expected one of six, like that previously reported for related mineral sulfides characterized by [TS4]Cu6 complexes as for the sulvanite-type structure[35], catamarcaite[40] and germanite.[36] This shows clearly a significant under-bonding of the interstitial T(2a) cations to the S(8e) within the TS4 tetrahedra of these complexes. The weakening of the T-S bonds in those complexes is explained by the fact that the same interstitial T cation is also surrounded by six copper atoms forming a TCu6 octahedron indicating the existence of short T-Cu distances , i.e. metal-metal interactions in the [TS4]Cu6 complexes. Then, the observation in those [TS4]Cu6 complexes of short T(2a)-Cu(12f) distances (Table S3) ranging from 2.708 Å for T = Cr to 2.753 Å for T = Mo (+1.66%) and to 2.771 Å for T = W (+2.33%) suggests that the metal-metal interactions compete with iono-covalent T-S bonds. The evolution of these distances vs. x (Fig.
3c) indicates that they increase continuously with x in a similar manner for Mo and W, showing
that the metal-metal interaction increases as the size of the T cation decreases down to that of the pure Cr-phase.
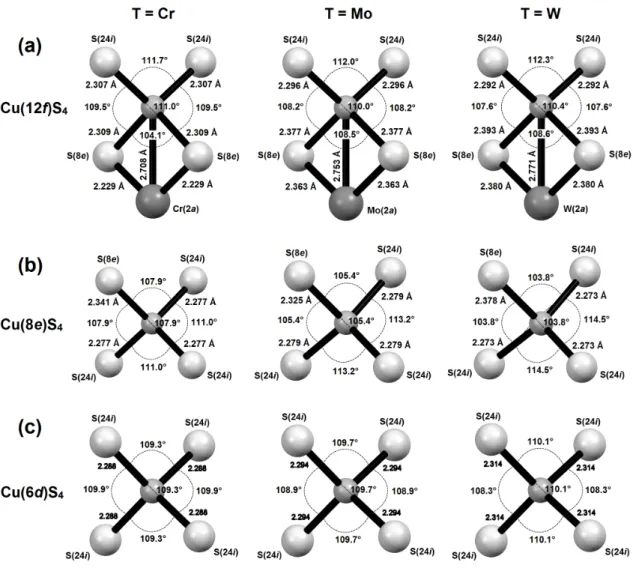
The evolution of the Cu-S distances in the CuS4 tetrahedra vs x (Fig. 3d, Fig. S6, Table S3) shows that the distortion of the “Cu26S32” conductive network is strongly influenced by the nature of the [TS4]Cu6 complexes. This is especially the case of the Cu(12f)S4 tetrahedron (Fig.
4) whose copper atom belongs to the complex and exhibits two equivalent Cu(12f)–S(8e)
Accepted
distances with the S(8e) atoms of the same complex and two other equivalent Cu(12f)–S(24i) distances with other S atoms located on 24i site. Quite remarkably, the Cu(12f)–S(8e) distances increase continuously with x, i.e. with the Mo and W (Fig. 3d) content from 2.309 Å for the pure Cr-phase (x = 0) to 2.377 Å and 2.393 Å for the pure Mo- and W-phases (x = 2), respectively (Table S3). In contrast, the two other Cu(12f)–S(24i) distances of the tetrahedron remain practically constant whatever x, ranging from 2.307 Å for the pure Cr-phase to 2.296 and 2.292 Å for the pure Mo- and W-phases, respectively (Table S3, Fig. S6). Nevertheless, the analysis of the S-Cu(12f)-S angles (Fig. 4) shows that the evolution of the distortion of the Cu(12f)S4 tetrahedron is complex. The larger deviation from the ideal geometry is observed for the Cr-phase, with S-Cu(12f)-S angles ranging from 104.1° to 111.7° against angle values ranging from 108.2° to 112.0° and 107.6° to 112.3° for Mo and W-phases respectively (Table
S4).
The Cu(8e)S4 tetrahedron (Fig. 4) which shares one S(8e) apex with the [TS4]Cu6 complex exhibits also a significant variation of its Cu(8e)-S(8e) bond vs. x from 2.265 to 2.378 Å (Fig.
S6, Table S3), though not continuous and rather different for Mo and W substitutions. Similarly
to Cu(12f)S4 tetrahedron, its three other Cu(8e)-S(24i) distances do not vary significantly with x, ranging from 2.272 to 2.279 Å (Fig. S6, Table S3). Thus it appears that the [TS4]Cu6 complex affects also the distortion of the Cu(8e)S4 tetrahedron. This is shown by the evolution of the S-Cu(8e)-S angles (Fig. 4, Table S4), which are ranging from 107.9° to 111.0° for Cr, from 105.4° to 113.2° for Mo and from 103.8° to 114.5° for W.
Finally, the Cu(6d)S4 tetrahedron (Fig. 4) whose copper atom is only linked to S(24i) atoms is practically regular with S-Cu(6d)-S angles ranging from 108.3° to 110.1° (Table S4) and four equal Cu(6d)-S(24i) distances which do not vary significantly with x, ranging from 2.279 to 2.314 Å (Fig. S6, Table S3). This strongly suggests that the higher symmetry of the Cu(6d)S4 tetrahedron may be due to its absence of connection with the [TS4]Cu6 complexes. Note that
Accepted
similarly to the Cu(6d)S4 tetrahedron, the Ge(6c)S4 one exhibits a high symmetry (four equal Ge(6c)-S(24i) distances which do not vary significantly with x, ranging from 2.203 to 2.232 Å (Fig. S6, Table S3), which should also be related to the absence of direct connection with the [TS4]Cu6 complexes.
Figure 4. Interatomic distances and bond angles as measured at room temperature in (a)
Cu(12f)S4, (b) Cu(8e)S4 and (c) Cu(6d)S4 tetrahedra encountered in the Cu26T2Ge6S32 (T = Cr, Mo and W) compounds
Accepted
This structural analysis highlights the strong influence of the Mo for Cr and W for Cr substitutions on the continuous evolution of the T(2a)-S(8e), Cu(12f)-S(8e) and T(2a)-Cu(12f) interatomic distances and on the distortion of the Cu(12f)S4 and Cu(8e)S4 tetrahedra. In contrast, the Cu(6d)S4 and Ge(6c)S4 tetrahedra are not significantly modified. This emphasizes the prominent influence of the mixed tetrahedral-octahedral complexes [TS4]Cu6 on the surrounding CuS4 tetrahedra, as well as the competition between the iono-covalent and the metal-metal interactions occurring in these complexes, which are responsible for the under-bonding of the interstitial T(2a) cations to the S(8e) anions. Thus, the strong increase of the
T(2a)-S(8e) and T(2a)-Cu(12f) distances, in comparison to the unit cell expansion, when Cr
atoms are substituted by either Mo or W atoms, confirms the major role played by the nature of the “interstitial” T cation on the crystal chemistry of the complexes [TS4]Cu6 and more generally on the structural distortion of the conductive network of colusite.
2.2. Electrical and thermal properties
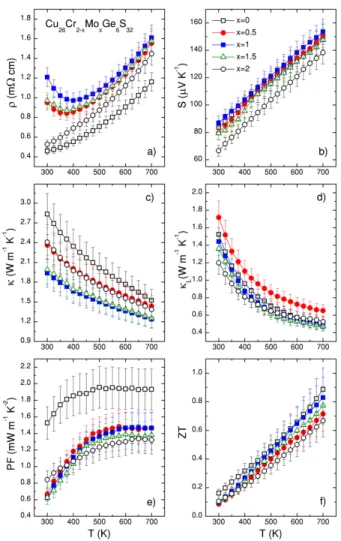
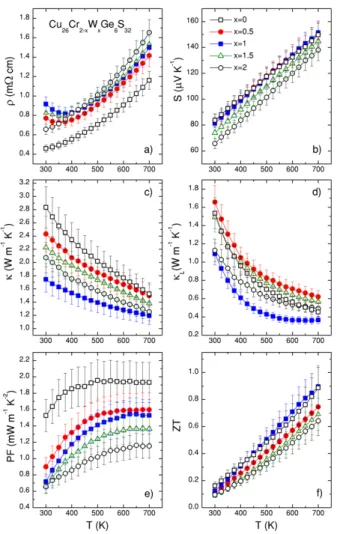
Figures 5 and 6 display the thermoelectric properties in the Cu26Cr2-xMoxGe6S32 andCu26Cr
2-xWxGe6S32 series, respectively. The temperature dependences of the electrical resistivity in both series are displayed in Figure 5a and 6a, respectively. The difference in the magnitude of the electrical resistivity, which is observed between the pure Cr-sample (x = 0) and the pure Mo- and W-samples (x = 2), has been discussed previously: in the pure Cr-sample, the smaller size and the lower electronegativity of Cr, compared to Mo and W, introduce effects leading to extremely low electrical resistivity and outstanding power factor values of 1.53 mW m-1 K-2 at RT and 1.94 mW m-1 K-2 at 700 K.[34]
In contrast, the temperature dependence of the electrical resistivity for Mo- and W-solid solutions (0.5 £ x £ 1.5) is strikingly different from that of the three limit samples (x = 0 and 2).
Accepted
An upturn of the electrical resistivity leading to a semiconducting behavior (dr/dT < 0) is observed below 375 K for all Mo- and W-solid solutions. We underline that no segregation was observed in the solid solutions within the precision of X-ray diffraction analysis. From our theoretical calculations, within the constant relaxation time approximation, the changes in band dispersion do not account properly for the temperature dependence of the electrical resistivity, especially for the up-turn observed in Fig. 5a and Fig. 6a (Fig. S7, S8, S9, S10). We assume that such effects are associated with the changes in the transport mechanism and relaxation time with temperature. Indeed, when a comparison between experimental and theoretical resistivity data is used to monitor the variation of the relaxation time with temperature (within the constant relaxation time, Fig. S11 and S12). We found that, in pure systems, t decreases linearly with temperature and it is larger when T = Cr. For the solid solutions, the values for t are consistent with what is observed for the pure systems for temperatures above 400 K but are, indeed, shortening at temperatures below 400 K.
The magnitude of the Seebeck coefficient for both series (Fig. 5b and 6b) remains between 65 µV K-1 and 85 µV K-1 at room temperature. Considering that Cr, Mo and W are in +6 oxidation state, the larger value observed in Cu26Cr2Ge6S32 as compared to Cu26Mo2Ge6S32 and Cu26W2Ge6S32 has been previously correlated to minor variation of the band structure.[34] In both series of solid solutions, for 0.5 £ x £ 1.5, the Seebeck coefficient moves closer towards the value for Cu26Cr2Ge6S32 overthe full temperature range, which indicates that Cr in the T site strongly affects the electronic transport properties, due to the particular chemical bonding in the [TS4]Cu6 complexes, as discussed above. The linear trend observed for all the samples points to the usual degenerated semiconductor behavior.
Accepted
Figure 5. Temperature dependence of the (a) electrical resistivity (r), (b) Seebeck coefficient (S), (c) thermal conductivity (k), (d) lattice thermal conductivity (kL), (e) power factor (PF),
and (f) figure of merit ZT in the Cu26Cr2-xMoxGe6S32 series.
Accepted
Figure 6. Temperature dependence of the (a) electrical resistivity (r), (b) Seebeck coefficient (S), (c) thermal conductivity (k), (d) lattice thermal conductivity (kL), (e) power factor (PF),
and (f) figure of merit ZT in the Cu26Cr2-xWxGe6S32 series.
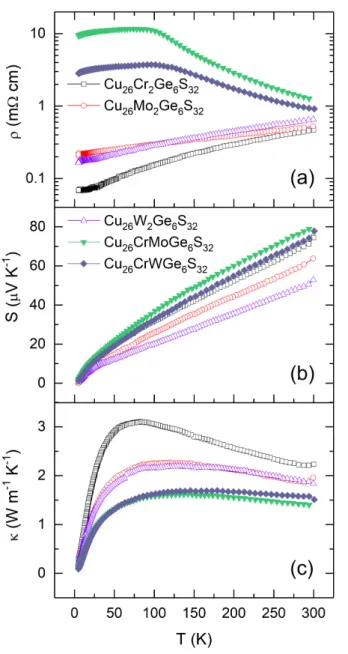
In order to shed some light on the conduction mechanisms involved, transport properties at low temperature (Fig. 7) have been investigated for Cu26Cr2-xTxGe6S32 (T = Mo, W, x = 0, 1, 2) samples. The low temperature electrical properties confirm the p-type character of all samples down to the lowest investigated temperature, 5 K. The Seebeck coefficient dependence on T appears unaltered by the formation of solid solutions and only harbors a mild reduction when substituting Cr by Mo or W in agreement with the aforementioned high temperature data. This is consistent with samples retaining a similar charge carrier concentration (Fig. S13). Therefore, the striking differences observed in the behavior of the electrical resistivity between solid
Accepted
solutions and pristine phases cannot be attributed to a change of carrier concentration or to the generation of bipolar conduction.
Figure 7. Temperature dependence of the (a) electrical resistivity (r), (b) Seebeck coefficient
(S), and (c) thermal conductivity (k) in the Cu26Cr2-xMoxGe6S32 and Cu26Cr2-xWxGe6S32 series (x = 0, 1, 2) from 5 K to 300 K. Error bars for the electrical transport properties are within the symbols and are omitted for clarity for the thermal conductivity.
Accepted
We have investigated the temperature dependence of the resistivity between 100 K and 300 K in terms of hopping phenomena comparing simple thermal activation (~ exp(-T0/T)) and variable range hopping (VRH) conduction (~ Ts×exp[(T0/T)p])[42] as well as linear dependence possibly due to strong disorder[43] and/or chemical localization.[44] Hopping transport was observed before in sulfides[27,45,46] and probably originates from the interplay between soft bonds and chemical disorder. A linear model with a negative temperature coefficient of resistance (Fig. S14 and S15) fits well the data in Fig. 7a from the onset of the resistivity drop (near 100 K) until VRH conductivity à la Mott (s ~ p ~ 0.25)[42] starts (near 150 K and 180 K with T = Mo or W, respectively). At about 300 K the resistivity begins to increase following the typical metallic behavior.
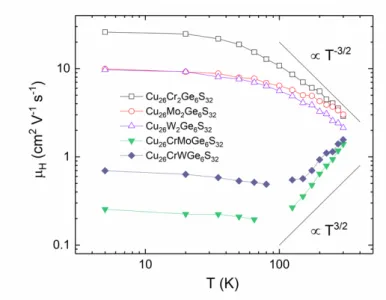
The temperature dependence of the Hall mobility is shown in Fig. 8, where distinctly different temperature dependences can be observed between pristine samples (x = 0 and 2) and Cr-Mo and Cr-W solid solutions. A decrease in the mobility from 120 K to 300 K for the pristine samples is the signature of acoustic phonon scattering (µ T-3/2), whereas an increase in the mobility for the solid solutions likely originates from phenomena associated with the chemical disorder, chemical localization, and/or VRH conductivity. The trends mimics what is observed when ionized impurity scattering is present (µ T3/2). The larger magnitude of the electrical resistivity at room temperature (Fig. 5a and 6a) in the two intermediate compositions (x = 1), compared with those of the other solid solutions (x = 0.5 and 1.5), underlines that the higher chemical disorder induced by the mixed occupancy of the T site drastically disturbs the conductive network. The disordered distribution of cations with different sizes and electronegativity over the same crystallographic site, despite being inherent to almost all solid solutions, influences on the thermoelectric properties but it has been seldom investigated. In the present study, while Cr, Mo and W cations have the same +6 oxidation state in the Cu26Cr
2-xTxGe6S32 solid solutions, their significantly different ionic radii may lead to size differences at
Accepted
the local scale between the TS4 tetrahedra, which can significantly affect the electrical properties. To quantify the former size-mismatch effect, L. M. Rodriguez and J. P. Attfield[47] have introduced the variance (second moment) of the T-cation distribution, 𝜎*. For two or more T-site species with fractional occupancies, 𝑦, (∑ 𝑦, = 1), the variance of the ionic radii 𝑟, about
the mean 〈𝑟4〉 is 𝜎* = ∑ 𝑦,𝑟,*− 〈𝑟4〉*. Standard ionic radii with values of 0.26 Å, 0.41 Å and
0.42 Å for Cr6+, Mo6+ and W6+, respectively, were used to calculate 〈𝑟
4〉 and 𝜎*.[41] The values
reported in Figure 9 (and Table S5) show that a maximum of 𝜎* is reached for x = 1 in both
solid solutions, corresponding to maxima of the electrical resistivity at 300 K. Interestingly, such maxima correspond to minima of refined Biso values for solid solutions (0.5 £ x £ 1.5),
induced by structural disordering in the T(2a) site, as addressed in the structural analysis section. The size-mismatch effect, illustrated by the variance, directly reflects the cationic disorder and is maximized for solid solutions with x = 1. These results show that both the ionic radii in pristine samples and the sizemismatchin solid solutions containing two T-site species are key chemical parameters that can strongly modify the electrical properties of colusites.
It is interesting to remark that, in the solid solutions when x = 1, the slope of dr/dT turns from negative to positive at around 100 K (Fig. 7a). This suggests that the change in scattering mechanism induced by the mixed occupancies on the T site lead to an intermediate state between an insulating and metallic regime. This behavior is usually observed in compositionally controlled metal-nonmetal transition in disordered/doped semiconductors (Si, GaAs)).[48]
Accepted
Figure 8. Temperature dependence of the Hall mobility in the Cu26Cr2-xMoxGe6S32 and Cu26Cr
2-xWxGe6S32 series (x = 0, 1, 2).
Figure 9. The calculated mean ionic radius <rA> (in black) and cation-size variance s2 (in blue)
of the T-site species are shown as solid and dashed lines for Cu26Cr2-xMoxGe6S32 and Cu26Cr
2-xWxGe6S32 series, respectively. The electrical resistivities at 300 K (open symbols) are given to illustrate the dependence of the transport properties on the cation-size variance in both series.
The increase in the electrical resistivity in Mo- and W-substituted Cu26Cr2-xTxGe6S32 series leads to a substantial decrease of the power factor on the full temperature range (Fig. 5e and
Accepted
6e). At 700 K, the power factor decreases continuously with x from 1.94 mW m-1 K-2 for Cu26Cr2Ge6S32 to 1.30 mW m-1 K-2 for Cu26Mo2Ge6S32 and 1.17 mW m-1 K-2 for Cu26W2Ge6S32. This demonstrates that the electrical performances in such colusite system are highly sensitive to the chemical composition of the [TS4]Cu6 complex. The increased chemical disorder leads to a minor decrease of the electronic mobility in solid solutions (0.5 £ x £ 1.5). In contrast, the changes in the T–Cu(12f) interactions, especially the continuous increase of the T(2a)-S(8e), Cu(12f)-S(8e) and T(2a)-Cu(12f) distances as the size of T cation increases (Fig. 3 and Table
S3), associated with the distortion of Cu(12f)S4 and Cu(8e)S4 tetrahedra, appear to dramatically
affectthe transport properties. As pointed out in our previous study, the small T-cation size in the pure Cr-phase seems essential to avoid perturbing the “Cu26S32” conductive network and in fine to produce outstanding power factors.
The thermal conductivity at high temperature in both series of samples (Fig. 5c and 6c) significantly decreases over the full temperature range when Cr is substituted by Mo or W. This is in a large extent attributed to the increase in electrical resistivity and the subsequently lower electronic contribution to the thermal conductivity. Overall, solid solutions with an equal occupancy of Cr and Mo/W (x = 1) exhibit the lowest thermal conductivity, especially for Cu26CrWGe6S32, consistent with its higher cation-size variance. However, the lattice component to the thermal conductivity does not harbor a systematic behavior as expected from mass fluctuations but rather appears to be the result of a combination of effects. Beside, these substitution levels remain fairly low (1 in 34 cations for the lowest κ) and the Mo-substituted series does not show any reduction in the lattice thermal conductivity. To better understand the effects at play, the low-temperature thermal conductivity data, in particular the lattice contribution, were investigated for pristine samples and solid solutions with x = 1 (Fig. 7c). The initial T3 dependence of the lattice contribution below 10 K does not vary significantly across the samples, consistent with a constant contribution from boundary scattering across all samples
Accepted
(Fig. S16). At temperatures beyond 10 K, we observe a reduction in the amplitude of the total and lattice contribution to the thermal conductivity in these pristine samples when T varies from Cr to Mo/W. The latter translates into a small decrease over the whole temperature range. While it is tempting to attribute this trend to enhanced mass fluctuation caused by the heavier Mo and W atoms, it does not suffice to explain the further reduction observed for the solid solutions with x = 1. Indeed, the behavior of solid solution samples differs greatly from that of the pristine phases and the variation of the thermal conductivity with x is non-linear and consistent with the cation-size variance (Figure 9 and Table S5). Moreover, we can observe a change in the temperature dependence and a large reduction in the “crystalline” peak of the thermal conductivity for the solid solutions which point towards enhanced point defect scattering mainly from strain-field fluctuation as opposed to mass fluctuation.[49,50] The fact that the lowest thermal conductivity is achieved when x = 1 is consistent with strain-field fluctuations as the predominant scattering mechanism. In terms of structure-property relationship, this scattering mechanism is consistent with the size-mismatch between CrS4 and TS4 (T = Mo, W) tetrahedra, maximized for the highest cation-size variance when x = 1 and T = W. This is also corroborated by the electrical transport property behavior, where the dramatic changes in the conduction mechanism are associated with cationic disorder and consequently size mismatch effect, modifying the chemical bonding of the [TS4]Cu6 complex and leading to a subsequent disruption in the Cu-S conductive network.
Finally, the significant decrease in thermal conductivity for the solid solutions with x = 1 allows to compensate for the decrease of the power factor and leadsto ZT values around 0.9 at 700 K
(Fig. 5f and 6f), comparable to the performance of the pristine sample, Cu26Cr2Ge6S32.
Accepted
3. Conclusion
The direct relationship between size-mismatch effect, structural disorder in the [TS4]Cu6 complex and chemical bonding in the conductive “Cu26S32” framework has been established and correlated with the electrical and thermal transport properties of Cu26Cr2-xMoxGe6S32 and Cu26Cr2-xWxGe6S32 solid solutions. Indeed, careful structural analysis revealed that the cationic disorder is localized, and governed by the size-mismatch, at the central position of the mixed tetrahedral-octahedral complex. We proposed to use the cation-size variance, σ2, to reflect the level of disorder and we successfully correlated it to the dramatic changes in transport properties with the substitution of Cr. The disruption of the conductive network via isovalent partial substitution on the T site, has led to a change from metallic to semiconducting behavior (below
ca. 375 K) and a change of conduction mechanism, including variable range hopping, in the
solid solutions.
Supporting Information
Supporting information and the ORCID identification number(s) for the author(s) of this article can be found under:
https://doi.org/
Author Information
#
V.P.K and G.G. contributed equally to this work.
Acknowledgements
The authors would like to thank Christelle Bilot and Jerôme Lecourt for technical support and the financial support of the French Agence Nationale de la Recherche (ANR), through the program Energy Challenge for Secure, Clean and Efficient Energy (Challenge 2, 2015, ANR-15-CE05-0027). K.S. thanks the International Joint Research Program for Innovative Energy
Accepted
Technology funded by the Ministry of Economy, Trade and Industry (METI), Japan. M.F. and A.R.S. acknowledge collaboration with the AFLOW Consortium (http://www.aflow.org) under the sponsorship of DOD-ONR (Grants N000141310635 and N000141512266).
Conflict of interest
The authors declare no conflict of interest
Accepted
References:
[1] G. J. Snyder, E. S. Toberer, Nat. Mater. 2008, 7, 105–114.
[2] K. Koumoto, T. Mori, Thermoelectric Nanomaterials, Springer: New York, 2013. [3] G. Tan, L. D. Zhao, M. G. Kanatzidis, Chem. Rev. 2016, 116, 12123–12149.
[4] Y. Pei, X. Shi, A. LaLonde, H. Wang, L. Chen, G. J. Snyder, Nature 2011, 473, 66–69. [5] J. R. Sootsman, D. Y. Chung, M. G. Kanatzidis, Angew. Chemie - Int. Ed. 2009, 48,
8616–8639.
[6] K. F. Hsu, S. Loo, F. Guo, W. Chen, J. S. Dyck, C. Uher, T. Hogan, E. K. Polychroniadis, M. G. Kanatzidis, Science 2004, 303, 818–821.
[7] X. Hu, P. Jood, M. Ohta, M. Kunii, K. Nagase, H. Nishiate, M. G. Kanatzidis, A. Yamamoto, Energy Environ. Sci. 2016, 9, 517–529.
[8] K. Biswas, J. He, I. D. Blum, C.-I. Wu, T. P. Hogan, D. N. Seidman, V. P. Dravid, M. G. Kanatzidis, Nature 2012, 489, 414–418.
[9] K. Biswas, J. He, Q. Zhang, G. Wang, C. Uher, V. P. Dravid, M. G. Kanatzidis, Nat.
Chem. 2011, 3, 160–166.
[10] Y. Gelbstein, J. Davidow, S. N. Girard, D. Y. Chung, M. Kanatzidis, Adv. Energy
Mater. 2013, 3, 815–820.
[11] R. Al Rahal Al Orabi, N. A. Mecholsky, J. Hwang, W. Kim, J. S. Rhyee, D. Wee, M. Fornari, Chem. Mater. 2016, 28, 376–384.
[12] R. Al Rahal Al Orabi, J. Hwang, C. C. Lin, R. Gautier, B. Fontaine, W. Kim, J. S. Rhyee, D. Wee, M. Fornari, Chem. Mater. 2017, 29, 612–620.
[13] P. Qiu, T. Zhang, Y. Qiu, X. Shi, L. Chen, Energy Environ. Sci. 2014, 7, 4000. [14] G. Guélou, A. V. Powell, P. Vaqueiro, J. Mater. Chem. C 2015, 3, 10624–10629. [15] V. Pavan Kumar, T. Barbier, P. Lemoine, B. Raveau, V. Nassif, E. Guilmeau, Dalt.
Trans. 2017, 46, 2174.
Accepted
[16] V. Pavan Kumar, L. Paradis-Fortin, P. Lemoine, V. Caignaert, B. Raveau, B. Malaman, G. Le Caër, S. Cordier, E. Guilmeau, Inorg. Chem. 2017, 56, 13376–13381.
[17] V. Pavan Kumar, T. Barbier, V. Caignaert, B. Raveau, R. Daou, B. Malaman, G. Le Caër, P. Lemoine, E. Guilmeau, J. Phys. Chem. C 2017, 121, 16454–16461.
[18] K. Suekuni, F. S. Kim, H. Nishiate, M. Ohta, H. I. Tanaka, T. Takabatake, Appl. Phys.
Lett. 2014, 105, 132107.
[19] K. Suekuni, F. S. Kim, T. Takabatake, J. Appl. Phys. 2014, 116, 063706.
[20] C. Bourgès, M. Gilmas, P. Lemoine, N. Mordvinova, O. I. Lebedev, E. Hug, V. M. Nassif, B. Malaman, R. Daou, E. Guilmeau, J. Mater. Chem. C 2016, 4, 7455–7463. [21] Y. Kikuchi, Y. Bouyrie, M. Ohta, K. Suekuni, M. Aihara, T. Takabatake, J. Mater.
Chem. A 2016, 4, 15207–15214.
[22] Y. Bouyrie, V. Ohorodniichuk, S. Sassi, P. Masschelein, A. Dauscher, C. Candolfi, B. Lenoir, J. Electron. Mater. 2017, 46, 2684–2690.
[23] C. Bourgès, Y. Bouyrie, A. R. Supka, R. Al Rahal Al Orabi, P. Lemoine, O. I. Lebedev, M. Ohta, K. Suekuni, V. Nassif, V. Hardy, et al., J. Am. Chem. Soc. 2018,
140, 2186–2195.
[24] Y. Shen, C. Li, R. Huang, R. Tian, Y. Ye, L. Pan, K. Koumoto, R. Zhang, C. Wan, Y. Wang, Sci. Rep. 2016, 6, 32501.
[25] M. L. Liu, F. Q. Huang, L. D. Chen, I. W. Chen, Appl. Phys. Lett. 2009, 94, 202103. [26] H. Yang, L. A. Jauregui, G. Zhang, Y. P. Chen, Y. Wu, Nano Lett. 2012, 12, 540–545. [27] X. Lu, D. T. Morelli, Y. Xia, F. Zhou, V. Ozolins, H. Chi, X. Zhou, C. Uher, Adv.
Energy Mater. 2013, 3, 342–348.
[28] K. Suekuni, K. Tsuruta, T. Ariga, M. Koyano, Appl. Phys. Express 2012, 5, 051201. [29] K. Suekuni, K. Tsuruta, M. Kunii, H. Nishiate, E. Nishibori, S. Maki, M. Ohta, A.
Yamamoto, M. Koyano, J. Appl. Phys. 2013, 113, 043712.
Accepted
[30] Y. Bouyrie, C. Candolfi, V. Ohorodniichuk, B. Malaman, A. Dauscher, J. Tobola, B. Lenoir, J. Mater. Chem. C 2015, 3, 10476–10487.
[31] R. Chetty, A. Bali, R. C. Mallik, J. Mater. Chem. C 2015, 3, 12364–12378.
[32] T. Barbier, P. Lemoine, S. Gascoin, O. I. Lebedev, A. Kaltzoglou, P. Vaqueiro, A. V. Powell, R. I. Smith, E. Guilmeau, J. Alloys Compd. 2015, 634, 253–262.
[33] T. Barbier, S. Rollin-Martinet, P. Lemoine, F. Gascoin, A. Kaltzoglou, P. Vaqueiro, A. V. Powell, E. Guilmeau, J. Am. Ceram. Soc. 2016, 99, 51–56.
[34] V. Pavan Kumar, A. R. Supka, P. Lemoine, O. I. Lebedev, B. Raveau, K. Suekuni, V. Nassif, R. Al Rahal Al Orabi, M. Fornari, E. Guilmeau, Adv. Energy Mater. 2019, 9, 1803249.
[35] P. G. Spry, S. Merlino, Su Wang, Xiaomao Zhang, P. R. Buseck, Am. Mineral. 1994,
79, 750–762.
[36] O. V Frank-Kamenetskaya, I. V Rozhdestvenskaya, L. A. Yanulova, J. Struct. Chem.
2002, 43, 89–100.
[37] I. D. Brown, Chem. Soc. Rev. 1978, 7, 359–376.
[38] D. Altermatt, I. D. Brown, Acta Crystallogr. Sect. B 1985, 41, 240–244. [39] N. E. Brese, M. O’Keeffe, Acta Crystallogr. Sect. B 1991, 47, 192–197.
[40] H. Putz, W. H. Paar, D. Topa, E. Makovicky, A. C. Roberts, Can. Mineral. 2006, 44, 1481–1497.
[41] R. D. Shannon, Acta Crystallogr. 1976, A32, 751–767.
[42] V. F. Gantmakher, Electrons and Disorder in Solids, chap. 4, 2005. [43] V. F. Gantmakher, Electrons and Disorder in Solids, chap. 1, 2005. [44] V. F. Gantmakher, Electrons and Disorder in Solids, chap. 7, 2005. [45] M. Z. Ansari, N. Khare, J. Appl. Crystallogr. 2015, 117, 025706.
[46] E. Lähderanta, E. Hajdeu-chicarosh, M. Guc, M. A. Shakhov, I. Zakharchuk, I. V
Accepted
Bodnar, E. Arushanov, K. G. Lisunov, Sci. Rep. 2018, 8, 17507. [47] L. M. Rodriguez-Martinez, J. P. Attfield, 1996, 54, 622–625.
[48] A. Ferreira da Silva, B. E. Sernelius, J. P. de Souza, H. Boudinov, H. Zheng, M. P. Sarachik, Phys. Rev. B 1999, 60, 15824–15828.
[49] E. J. Skoug, J. D. Cain, D. T. Morelli, M. Kirkham, P. Majsztrik, E. Lara-curzio, J.
Appl. Phys. 2011, 110, 023501.
[50] Y. Li, T. Zhang, Y. Qin, T. Day, G. J. Snyder, X. Shi, L. Chen, J. Appl. Phys. 2014,
116, 203705.
Accepted
Graphical Abstract
Cation-size mismatch inside mixed octahedral-tetrahedral
complexes disturbs the electrical transport properties of colusites. The direct relationship between size-mismatch effect, structural disorder and chemical bonding in the conductive “Cu26S32” framework has been established and correlated with the thermoelectric properties. Our conclusions are based on a synergistic approach which combines synthesis, characterization, and first principles modeling.