HAL Id: hal-00304728
https://hal.archives-ouvertes.fr/hal-00304728
Submitted on 1 Jan 2002HAL is a multi-disciplinary open access archive for the deposit and dissemination of sci-entific research documents, whether they are pub-lished or not. The documents may come from teaching and research institutions in France or abroad, or from public or private research centers.
L’archive ouverte pluridisciplinaire HAL, est destinée au dépôt et à la diffusion de documents scientifiques de niveau recherche, publiés ou non, émanant des établissements d’enseignement et de recherche français ou étrangers, des laboratoires publics ou privés.
a boreal headwater catchment, northwestern Ontario,
Canada
B. A. Branfireun, N. T. Roulet
To cite this version:
B. A. Branfireun, N. T. Roulet. Controls on the fate and transport of methylmercury in a boreal head-water catchment, northwestern Ontario, Canada. Hydrology and Earth System Sciences Discussions, European Geosciences Union, 2002, 6 (4), pp.785-794. �hal-00304728�
Controls on the fate and transport of methylmercury in a boreal
headwater catchment, northwestern Ontario, Canada
B.A. Branfireun
1and N.T. Roulet
21Department of Geography, University of Toronto at Mississauga, 3359 Mississauga Road North, Mississauga, Ontario, Canada L5L 1C6
2Department of Geography and Centre for Climate and Global Change Research, McGill University, 805 Sherbrooke Street West, Montréal, Québec, Canada H3A 2K6
Email for corresponding author: brian.branfireun@utoronto.ca
Abstract
The fate and transport of methylmercury (MeHg) were studied in a small boreal catchment. Hydrological processes largely govern the magnitude of the flux of MeHg. Seasonal and inter-annual variability in hydrology produce variable source strengths of MeHg throughout the catchment. The mass flux of MeHg within, and from the catchment is dependent on the mass flux of water and the relative placement of landscape units in the catchment hydrological cascade. Hydrology also governs the maintenance of the methylating environments in the catchment. Specifically, hydrological processes maintain zones of anoxia in both the catchment uplands and peatlands that support obligate anaerobic sulphate-reducing bacteria. In addition, groundwater flow paths are an essential control on the delivery of sulphate to these bacteria that facilitate in situ mercury methylation.
Keywords: methylmercury, methylation, hydrology, boreal catchment, peatland, Ontario, Canada
Introduction
Methylmercury (MeHg) is a global pollutant that demands attention as an environmental toxin. Significant progress has been made in the understanding of methylating and demethylating bacteria (e.g. Marvin-DiPasquale et al., 2000; Benoit et al., 2001) and the MeHg dynamics of perturbed ecosystems (e.g. Kelly et al., 1997). Ecosystem-scale investigations on undisturbed systems have been less common and the majority of these have focused on lakes, or geographic regions of concern such as the Florida Everglades (Gilmour et al., 1998). Studies focusing on whole system MeHg dynamics in non-point source impacted boreal/temperate catchments are few (exceptions include Krabbenhoft et al., 1995; St. Louis et al., 1996; Driscoll et al., 1998) and these studies, although largely ‘black-box’ investigations of MeHg budgets for different types of catchments, have provided insight into the role of the catchment in MeHg cycling, particularly with respect to wetlands. St. Louis et al. (1994) demonstrated a clear
relationship between the presence of wetlands and increased MeHg yield from boreal catchments. Hurley et al. (1995) inferred a positive relationship between percent wetland coverage and MeHg yield. St. Louis et al. (1994) and Hurley et al. (1995) associated elevated catchment yields of Hg methylation with wetlands but did not examine the distribution of MeHg within the catchment, nor the mechanisms by which the MeHg moves through the landscape. Modelling suggests that catchment-scale black-box investigations may fail to describe important internal cycles that are crucial to a fuller understanding of MeHg in the environment (Branfireun et al., 1998) and that relative size of the different catchment landscape units may influence, strongly, the magnitude of MeHg flux. This research is motivated by the increasingly evident need to link catchment-scale hydrological and biogeochemical processes when assessing MeHg cycling. Previous research in this catchment (Branfireun et al., 1996; Branfireun and Roulet, 1998) was concerned primarily with the
process-level understanding of the hydrology and methylmercury dynamics of the small peatland in this catchment. This peatland had ‘hot spots’ of appreciably higher pore water MeHg concentrations than surrounding areas related, apparently, to the nature of the hydrological coupling of the peatland soils with the upland terrain, although no definitive hydrological or biogeochemical controls had been identified at that time. This earlier work was undertaken as part of the Experimental Lakes Area Reservoir Project (ELARP) (Kelly et al., 1997), which sought to elucidate the impacts of peatland flooding on hydroelectric carbon and mercury dynamics. The present research goes beyond the margins of the peatland; the overarching objective is to couple the dynamics of water exchange with the fate and transport of MeHg among landscape units across the entire catchment.
Methods
SITE DESCRIPTION
This study was conducted between spring 1995 and autumn 1996 in a small (41.6 ha) Precambrian Shield headwater catchment (Basin 632) located in the Experimental Lakes Area (ELA) (49°40’ N, 93°43’ W) near Kenora, Ontario, Canada (Fig. 1). The ELA, a research station operated by the Department of Fisheries and Oceans of the Government of Canada, is located in a pristine area of the low boreal forest in northwestern Ontario. In operation for over 30 years, the ELA comprises a fully equipped base camp with modern research laboratories, accommodation and staff-operated food and support services despite its remote location. Of particular value is the long-term database of
Upland Weir
Poor Fen Raised Bog
Inflow Stream 0 100 200m
N
Catchment Outflow Upland Wetland Peatland Pond South Inflow North Ridge South Ridge North Subcatchment West Subcatchment South Subcatchment 0 200m N Catchment Outflow PeatlandCANADA
Experimental Lakes AreaFig. 1. Top Left: Location of the Experimental Lakes Area in northwestern Ontario, Canada. Top Right: Map of the
632 Catchment in the Experimental Lakes Area. Bottom: Map of the sampling locations in the 632 Catchment that are discussed in the text. Shaded areas indicate wetlands.
climatological and water quality information that is available. The hallmarks of the ELA are: (1) long-term monitoring of the physical and biological variables of numerous lakes, permitting the assessment of long-term, subtle effects such as climate change (Schindler, 1997), and; (2) whole-ecosystem experimentation, allowing for the comprehensive study of complex environmental problems such as eutrophication (Schindler, 1980), surface water acidification (Donahue et al., 1998) and reservoir creation (Kelly et al., 1997).
Average monthly air temperatures based on data from 1969–1989 ranged from –16.5°C for January to 20.1°C for July and total annual precipitation was 690.6 mm, 27% of which fell as snow (M. Lyng and K. Beaty, ELA unpublished report).
Based on topography, the study catchment was divided into three subcatchments: the north subcatchment (7.0 ha) dominated by an exposed bedrock ridge; the west subcatchment (15.4 ha) which is the major contributing area to catchment runoff, and; the south subcatchment (13.5 ha), which delivers runoff primarily to the outflow zone of the peatland (Fig. 1). The lowest elevation of the catchment is occupied by a small peatland (4.7 ha) with a central pond (1.0 ha). The bedrock geology, typical of the Precambrian Shield, is largely unfractured granite. Soils in the upland portion of the catchment are dominated by silty-loams of glacio-lacustrine origin. Below the peatland, the bedrock is overlain by well-sorted sands and gravels over 1m thick in the inflow area, and fine silts and clay in the deep central depression. Above the inorganic sediments lies a peat accumulation which varies in depth from 7 m, near the margin of the pond, to less than 1 m at the hillslope-peatland interface; the average depth is about 2 m. The peatland overstorey is sparse and is composed of almost entirely black spruce (Picea mariana) with scattered tamarack (Larix laricina). Upland vegetation is an overstorey of jackpine (Pinus banksiana) and black spruce (Picea mariana) with scattered paper birch (Betula papyrifera). Bedrock outcrops are colonised by lichens (both foliose and fruticose forms), juniper (Juniperus virginiana) and mosses (Racomitrium spp.). Peatland surface vegetation is dominated by Sphagnum spp. (S. angustifolium; S. fuscum; S. magellanicum) with shrubs such as Labrador tea (Ledum groenlandicum) and leatherleaf (Chamedaphne calyculata) in the more ombrotrophic area, and grasses and sedges (Oligosperma spp. and Carex spp.) in the more mineral-poor fen zones around seeps and streams. Major sampling sites shown in Fig. 1 include four sites routinely sampled for surface water MeHg (upland weir, inflow stream, pond, catchment outflow), and others where pore water chemistry was sampled (upland wetland, poor fen and raised bog).
The poor fen is fed by precipitation and is a zone of groundwater discharge from the adjacent uplands, while the raised bog is a zone of groundwater recharge supplied only by precipitation (Branfireun and Roulet, 1998).
HYDROLOGY
Water table elevations and streamflow were monitored from spring to fall in both 1995 and 1996; however, the data presented here represent the length of the shortest record for the purposes of inter-year comparison (May 10 [Day 130] to Sept. 7 [Day 250]). Water table elevation in the upland hillslopes and the peatland was monitored continuously via a series of wells constructed of PVC pipes 10 cm in diameter and ~1 m long, perforated along their entire length. Water levels in the wells were monitored with electronic float gauges with measurements recorded on Campbell Scientific® CR-10 dataloggers. Episodic overland flow generated in the upland was gauged at a 90° V-notch weir (‘Upland Weir’) installed in a small wooden retaining structure built on the exposed bedrock. Height of water in the V-notch was measured continuously using the same installation as the water table wells and converted to discharge with a stage-discharge equation. Surface streamflow on the peatland was measured in a continuously recording flume, with stage related to discharge using the velocity-area method (Branfireun and Roulet, 1998). Catchment outflow was gauged continuously at a 90° V-notch weir monitored by ELA staff.
Patterns of groundwater flow were measured in piezometers installed in two perpendicular transects in the inflow zone of the peatland. Piezometers ranged in depth from 0.5 m to 3 m below the surface, and were constructed from 2 cm inside diameter PVC pipe with a 20cm screened slotted well head. The peatland installation was installed in a previous study by Branfireun and Roulet (1998). Two upland piezometer nests were installed in the more mineral-rich soils of the transition zone immediately upslope of the peatland.
SOIL AND WATER CHEMISTRY
Both soil and pore water samples were taken for MeHg analysis in 1995 and 1996 to characterise the spatial distribution and temporal variability of MeHg concentrations within the catchment. Pore water samples were limited to one profile each from the poor fen and bog areas in both 1995 and 1996 due to limited availability of sampling bottles and analytical time. The peatland in this catchment had been identified as a locus of MeHg production (Branfireun et al., 1996; Branfireun et al., 1998), and the sampling presented here was undertaken to describe the controls on the MeHg
concentration profiles seen previously. Although efforts were made to acquire samples more frequently during storm events, upland soil water was more difficult to obtain due to the extremely episodic development of upland water tables and sampling was limited, temporally, to late summer 1996. Ceramic tension lysimeters were not used for MeHg sampling in the upland soils due to the high susceptibility of Hg samples to contamination. Upland soil samples for solid phase MeHg analysis were taken from the surficial organic and sand-silt horizons of the dominant upland humo-ferric podsols and from the thin peat layer of the small upland wetland. To provide a reasonable estimate of mass transport and to capture seasonal variability, surface waters were sampled at the upland weir when runoff was occurring there, in the peatland inflow stream, the central pond and at the catchment outflow on a weekly basis in 1995 and slightly less frequently in 1996.
Ultra-clean trace metal protocols were used at all times for the preparation of sampling equipment and for MeHg sampling in the field. All sampling equipment was Teflon®, cleaned in warm (60°C) concentrated (70%) reagent-grade HNO3, triple-rinsed in distilled water, filled with 1% reagent-grade HCl, heated at 60°C for 8 hours, triple-rinsed again and stored filled with fresh 1% reagent-grade HCl. MeHg samples were handled and processed in different ways, depending on location. Surface water samples were taken by completely submerging the bottle and rinsing three times before the sample was taken. Pore water samples were drawn from PVC piezometers or a Teflon ‘sipper’ attached to a Teflon sampling tube, then pumped into a Teflon transfer container using a peristaltic pump. Sample bottles were protected by double polyethylene bags, and were stored in a dark cooler in the field until they could be returned to the laboratory for processing (no more than 2 hours). Surface water samples were not filtered though samples with visible particles were rejected, assuming that the dissolved and small particulate phase comprised the whole water flux. Pore water samples were passed through a sterile 0.45 mm nitrocellulose-acetate filter rinsed with reagent-grade 1% HCl immediately upon return to the lab. Sediments were collected as grab samples and were stored in double polyethylene bags. All samples for MeHg analyses were frozen until analyses could be performed. MeHganalyses were performed using a cold vapour atomic fluorescence technique modified from Bloom and Fitzgerald (1988) and Horvat et al. (1993) (Branfireun et al., 1996). Sediment samples being analyzed for MeHg were subjected to an overnight digestion, where a small mass of sample (1 g or less) was immersed in 35 ml of distilled, deionized water combined with 1 ml of 48% high-purity H2SO4. This digestate was then distilled as per the methods referenced
above. Total Hg concentrations were not measured as part of this study since the focus was on the more toxic MeHg. Sulphate was measured using suppressed ion chromatography at the Department of Fisheries and Oceans-Freshwater Institute Laboratories, Winnipeg.
Results
CATCHMENT-SCALE HYDROLOGY AND METHYLMERCURY TRANSPORT
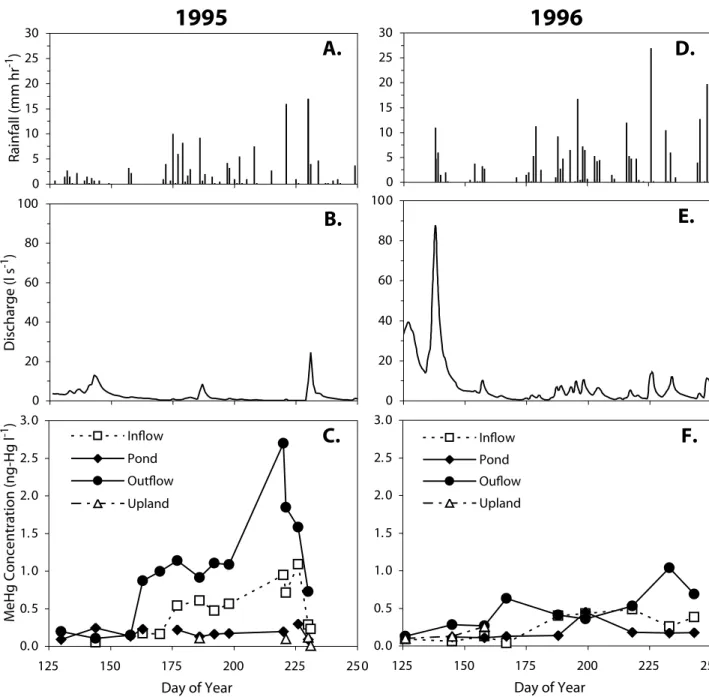
Samples taken from surface waters throughout the catchment over the two study years show marked within-year spatial variability and between-year temporal variability in MeHg concentrations, particularly in the inflow and outflow streams (Fig. 2); only the outflow stream hydrograph is presented (b,e) to illustrate the considerable inter-annual variability in total and peak discharges. Other station hydrographs exhibited a similar pattern. In 1995 (a drier, low flow year), flow from the upland weir was extremely episodic and MeHg concentrations were always less than 0.12 ng-Hg l–1 (Fig. 2c). When no values for the upland weir are reported in Fig. 2, there was no flow over the weir at that sampling time. The peatland inflow stream had MeHg concentrations of less than 0.2 ng-Hg l–1 until June 26, 1995 (Day 177) when concentrations began to increase, reaching a maximum of 1.1 ng-Hg l–1 by August 14, 1995 (Day 226). A similar pattern is seen in the catchment outflow data where after June 9, 1995 (Day 160), MeHg concentration begin increasing markedly until August 8, 1995 (Day 220), when it reached a maximum of 2.7 ng-Hg l–1, the highest concentration recorded at this site. In comparison to the concentrations in the inflow and outflow streams, pond concentrations varied little, from 0.09 to 0.30 ng-Hg l–1. In 1995, the concentration of MeHg was measured in runoff from the south sub-catchment at the point where it enters the peatland (south inflow) (Fig. 1). This water was not in contact with any wetland soils before reaching the peatland. Water flowed over exposed bedrock and through a steep forested hillslope soil before reaching the margin of the peatland as overland flow and then infiltrating to the peatland subsurface flow system. MeHg concentrations in these waters were below the level of detection (0.01 ng-Hg l–1) on all occasions in 1995, and therefore were considered a negligible input. This station was not monitored in 1996.
In 1996 (a wet, high flow year), surface water MeHg concentration trends were quite different from those in 1995 (Fig. 2f). A more sustained late spring runoff resulted in a longer period of discharge from the upland weir that was accompanied by slightly higher MeHg concentrations than in 1995 (up to 0.26 ng-Hg l–1). MeHg concentrations in the
inflow stream were lower than in 1995, never exceeding 0.49 ng-Hg l–1. MeHg concentrations at the catchment outflow saw a small increase in concentration until mid-June as in 1995. The maximum MeHg concentrations near the end of the summer (August 20, 1996 (Day 232) [1.04 ng-Hg l–1]) never approached the values measured in 1995. Pond MeHg concentrations in 1996 were similar to those in 1995, although a mid-season increase to 0.45 ng-Hg l–1 (July 17, 1996; Day 198) above the mean of the rest of the season of 0.15 ng-Hg l–1 was noted.
Bivariate regressions were undertaken on the inflow, pond and outflow MeHg concentration data for both years to assess the throughput of MeHg from the different landscape units. Insufficient data exist from the upland weir to include it in these analyses. A weak positive correlation exists between the inflow stream and pond MeHg concentrations in 1996 (r2 = 0.27; P=0.186; N=8), but not in 1995. There was no significant relationship between pond and outflow concentrations for either year. Inflow and outflow stream concentrations show a strong correspondence in 1995 0 20 40 60 80 100 Discharge (l s -1 ) 0 20 40 60 80 100 0 5 10 15 20 25 30 0 5 10 15 20 25 30 Rainfall (mm hr -1 ) 0. 0 0. 5 1. 0 1. 5 2. 0 2. 5 3. 0 125 150 175 200 225 250 Day of Year MeHg Concentration (ng-Hg l -1 ) Inflow Pond Outflow Upland 0. 0 0. 5 1. 0 1. 5 2. 0 2. 5 3. 0 125 150 175 200 225 250 Day of Year Inflow Pond Ouflow Upland
1995
1996
A.
B.
C.
D.
E.
F.
Fig. 2. Rainfall, outflow stream discharge and methylmercury concentrations in surface waters at the upland weir, inflow stream,
pond and catchment outflow for 1995 (A-C) and 1996 (D-F). Total rainfall during the study period (Day 130-250) was 349 mm in 1995 (A) and 496 mm in 1996 (D).
(r2=0.76; P<0.001; N=14), but no relationship in 1996. Attempts were made to assess if a lag effect was present in the MeHg concentration data but no better relationships were discerned.
Fluxes (export) for the inflow and outflow streams were determined using concentration-discharge curves (Fig. 3a,b). MeHg shows a negative power relationship with instantaneous discharge for the inflow stream in both 1995 and 1996. The form of this relationship was quite different in the two years, reflecting the inter-annual variability in the hydrological regime. The goodness-of-fit may be compromised by the small sample size (N=11, 1995; N=6, 1996), and both years suffer from a lack of data at the extremes of the distribution. The best fit for all of the inflow data had somewhat less explanatory power (r2=0.35; P=0.013; N=17), given the inter-year variability. The catchment outflow stream MeHg-discharge relationship is much stronger, even though the hydrological years were quite different. The mean best fit for all data had an r2 = 0.47 (P<0.001; N=27) and a form close to those of the individual years, suggesting that more data could produce a relationship with significant predictive power for the catchment outflow.
MeHg flux for the inflow stream and catchment outflow for the 1995 and 1996 seasons show marked between-year variation. Mass fluxes for the study period (Day 130–250) were calculated by multiplying the measured daily discharge by the concentration of MeHg determined from the concentration-discharge curves discussed above. For the inflow stream, 1995 total discharge over the study period (Day 130–250) was 10 440 m3, which transported a calculated total of 3.35 mg of MeHg. In 1996, total discharge was nearly five-fold greater than in 1995 (50 543 m3) with a calculated total mass flux of MeHg of 7.03 mg, slightly
greater than twice that of 1995. For the catchment outflow, total discharge over the study period in 1995 was also low (24 304 m3), with a total MeHg mass flux of 8.65 mg. Total discharge for the catchment outflow in 1996 was 75 384 m3. The calculated MeHg flux of 25.8 mg was approximately three times that in 1995.
For a very rough estimate of total annual MeHg yield, the mean daily yields for the two streams were multiplied by the number of ice free days (assumed to be 214 days) to give a total flux of MeHg from the inflow stream to the pond of 6.0 and 12.6 mg for 1995 and 1996 respectively. Total flux for the catchment outflow would be 15.4 and 46.0 mg for 1995 and 1996 respectively.
METHYLMERCURY IN CATCHMENT PORE WATERS AND SOILS
Concentrations of MeHg in upland soil and pore water samples varied with soil organic content and site wetness. In the upper hillslope, the transition from saturated to unsaturated was so rapid that no gravity water samples were extracted from wells installed to bedrock. Pore water MeHg concentrations in the small ‘upland wetland’ organic sediments averaged 0.28 ng-Hg l–1, which is within the range of concentrations found in other wetlands (Krabbenhoft et al., 1995; Branfireun et al., 1996). The MeHg concentrations in the upland wetland were lower than surface and near-surface MeHg concentrations in the valley bottom peatland. In the lower hillslope, water samples extracted from piezometers in the mineral soil had a mean concentration of 0.11 ng-Hg l–1. This site tended to be wetter with some surficial Sphagnum growth on top of approximately 1 m of mineral soils.
Solid-phase MeHg concentrations of upland soil varied
0.0 0.5 1.0 1.5 0 200 400 600 Discharge (m3 d-1) [MeHg] (ng-Hg l -1 ) 0.0 1.0 2.0 3.0 0 1000 2000 3000
A) INFLOW STREAM B) OUTFLOW STREAM
1995: y=117.83x-1.329 r2=0.52; P=0.012; N=11 1996: y=11200x-1.931 r2=0.37; P=0.194; N=6 ALL: y=11.496.x-0.7617 r2=0.35; P=0.013; N=17 1995: y=8.2827x-0.5606 r2=0.51; P=0.0008; N=18 1996: y=18.174x-0.5914 r2=0.73; P=0.0035; N=9 ALL: y=6.2677.x-0.4743 r2=0.47; P<0.0001; N=27 [MeHg] (ng-Hg l -1 ) Discharge (m3 d-1)
Fig. 3. Relationships between daily discharge and methylmercury concentrations for the A) inflow and
over two orders of magnitude, with the highest found in the upland peat (mean 6.99 ng-Hg g–1 dry weight). The dry upland humo-ferric podsols showed a clear discontinuity in MeHg concentration between the predominantly organic surficial horizon (mean 0.23 ng-Hg g–1 d.w.) and the lower sand-silt horizon (mean 0.04 ng-Hg g–1 d.w. or 17% that of the organic horizon).
MeHg concentration profiles in the main peatland illustrate the spatial and vertical variability in MeHg concentrations (Fig. 4a,b). The dominant direction of groundwater flow is indicated on the diagram, determined from measurements of hydraulic head over the study period.
On all sampling occasions, the concentration profiles in the poor fen exhibited a maximum concentration at or near the water table and decreased sharply with depth (Fig. 4a). In the poor fen, which is dominated hydrologically by upwelling groundwater, concentrations ranged from a maximum of 2.42 ng-Hg l–1 at the water table to a minimum of 0.22 ng-Hg l–1 at –100 cm. The near-surface values are not as high as those reported for the same location in a previous study (up to 7 ng-Hg l–1; Branfireun et al., 1996) demonstrating that there is substantial inter-annual variability in MeHg pore water concentrations. MeHg concentrations in the raised bog profile that is precipitation
-150 -100 -5
0
0 1 2 3 4
[MeHg] (ng-Hg l-1) and [Suphate] (mg l-1)
MeHg (1/8/95) MeHg (5/28/1996) Sulphate 1/8/95 ) -200 -150 -100 -5 0 0 1 2 3 4
Depth Below Water Table (cm)
MeHg (1/8/95) MeHg (5/28/96) Sulphate (1/8/95) -150 -100 -50 0 8.2 Hydraulic Head (m) -200 -150 -100 -5 0 8.1 Hydraulic Head (m)
A) POOR FEN
B) RAISED BOG
8.3 8.4 8.3 8.2[MeHg] (ng-Hg l-1) and [Suphate] (mg l-1)
Depth Below Water Table (cm)
Fig. 4. Peat pore water methylmercury and sulphate concentration profiles in the a) poor fen and b) raised bog locations,
dominated show similar patterns to those in the poor fen but the maximum concentrations are lower (Fig. 4b). The lowest concentration, observed at –100 cm, was below the limit of detection (<0.01 ng-Hg l–1).
The relationship between MeHg and sulphate concentrations is of interest, given the role of sulphate-reducing bacteria in the methylation of Hg and the differences in the abilities of these bacteria to methylate Hg under varying sulphate concentrations (e.g. Gilmour et al., 1998, Benoit et al., 1999, 2001). In August, 1995, sulphate in pore water was measured with MeHg in an attempt to discern geochemical differences between MeHg ‘hot spots’ in the poor fen and lower MeHg sites in the raised bog found in a previous study (Branfireun et al., 1996). Profiles taken in three piezometer nests show considerable variability in sulphate concentrations with depth (Fig. 4a,b). In the poor fen, concentrations of sulphate show are slightly higher at the water table (0.32 to 0.58 mg-SO42+ l–1), minima of 0.15 –0.22 mg-SO42+ l–1 between –25 and –75 cm, and then a significant increase in concentrations to 3.29–3.63 mg-SO42+ l–1 between –100 and –200 cm. The highest concentrations of sulphate occur at the interface between the underlying sand unit and the peat strata where groundwater is moving vertically upwards into the peat (Branfireun et al., 1996; Branfireun and Roulet, 1998). Sulphate concentrations in the raised bog are extremely low throughout the profile, decreasing with depth from a maximum of 0.25 mg-SO42+ l–1 at the water table to a minimum of 0.08 mg-SO
42+ l–1 at –100 cm (Fig. 4b).
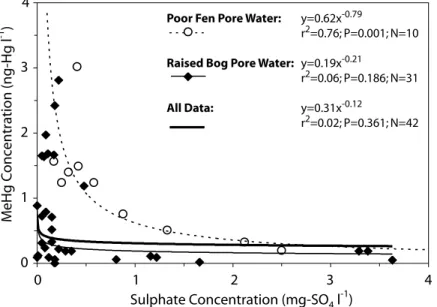
For the poor fen peat pore waters in this catchment, there is a non-linear, negative relationship (r2 = 0.76; P=0.001;
N=10) between MeHg and sulphate concentrations in surface water throughout the catchment and over the study period (Fig. 5). This relationship breaks down (r2 = 0.02; P=0.361; N=42) when samples from the raised bog are included where both sulphate and MeHg concentrations are low. A summary of the aqueous and solid phase concentrations of MeHg and sulphate in the various catchment units is provided in Table1.
Discussion
CATCHMENT-SCALE HYDROLOGY AND METHYLMERCURY TRANSPORT
Surface water MeHg concentrations at the peatland inflow stream and catchment outflow were highest during the dry, low flow year of 1995. Pond MeHg concentrations were not markedly higher in 1995 than in 1996. With a pond volume estimated to be 10 000 m3 (1 ha × 1 m deep on average), the water residence time would have been approximately the length of the study period, as compared to one-fifth that over the same time period in 1996. The low mass flux of peatland water also resulted in noticeably greater clarity and light penetration in this normally ‘brown water’ pond in 1995, potentially promoting greater photodegradation of MeHg and thus increasing the size of the pond sink (Sellers et al., 1996; Krabbenhoft et al., 1998). A weak positive correlation between the inflow stream and pond MeHg concentrations in 1996 but not in 1995 suggests that the inflow stream influences pond MeHg concentrations only under high flow regimes, whereas in low flow years,
Sulphate Concentration (mg-SO4 l -1
)
MeHg Concentration (ng-Hg l
-1 )
Poor Fen Pore Water: y=0.62x-0.79
r2=0.76; P=0.001; N=10
Raised Bog Pore Water: y=0.19x-0.21
r2=0.06; P=0.186; N=31
All Data: y=0.31x-0.12
r2=0.02; P=0.361; N=42 0 1 2 3 4 0 1 2 3 4
Fig. 5. Sulphate versus methylmercury concentrations in poor fen and raised bog peat
within-pond processes probably dominate the pond MeHg cycle. Importantly, the lack of any statistical relationship between pond and outflow concentrations indicates that the pond is largely decoupled from the whole catchment export. Inflow and outflow stream concentrations were more strongly correlated in the low flow year than the high flow year. This must be due to a similarity of process rather than physical connection because of the lack of a statistical relationship between the outflow and the intervening pond. Low stream flows would permit greater peatland-stream interaction, strengthening the peatland influence on stream MeHg concentrations. With high flows, the peatland influence on the inflow stream would be dampened by the decreased residence time of stream water, the dilution of the inflow stream by upland runoff, and a confounding, but not significant dilution of the outflow stream by pond water. The overall negative relationship between MeHg concentration and discharge contrasts with Branfireun et al. (1996) who found no dilution of MeHg in peatland inflow stream water after a summer storm. However, the correlation for 1996 is weaker than that of 1995; in fact, it shows a slight positive relationship between daily discharges of 200 and 300 m3 (Fig. 3a). Such relationships with biologically-mediated chemical species such as MeHg are difficult to interpret, as stream water concentrations are not dependent solely on discharge. Also the peak discharges in most years occur in the spring due to snowmelt, likely the time of the lowest rates of biological activity (methylation), while the highest rates of methylation (and highest stream concentrations) occur in the mid to late summer period at
the time of lowest stream flow. Thus, the apparent dilution effect may result from the asynchrony between the annual pattern of biologically-mediated Hg methylation and the transport of water through the catchment.
Inflow stream fluxes calculated as part of this study for both 1995 and 1996 were substantially less than the total flux reported by Branfireun et al. (1996) for this same stream in 1993 (24.1 mg of MeHg total flux, calculated using the same method as in this study). Catchment outflow concentrations were much higher in 1995 than in 1996, while the total MeHg mass flux was extremely low compared to that of 1996 and other studies (St. Louis et al., 1996), indicating the importance of hydrological variability in controlling the flux of MeHg from this catchment. Measured catchment outflow MeHg concentrations were on average 2.5 times higher in 1995 than in 1996, yet the 1996 MeHg yield over the study period was three times higher than in 1995, largely due to the three times greater total discharge in 1996 than in 1995. These findings indicate that flux of MeHg is discharge-limited as St. Louis et al. (1996) and Branfireun et al., (1998) suggest.
Catchment MeHg yields in µg ha–1 d–1 were calculated by dividing the total flux by the contributing area in hectares and the number of days over which the total flux was determined. Yields for the years reported here are similar to those reported elsewhere in the literature (see Table 2, adapted from Driscoll et al., 1998), and to yields reported for the same catchment in a previous study for the years 1990–1993 (St. Louis et al., 1996) (Table 2).
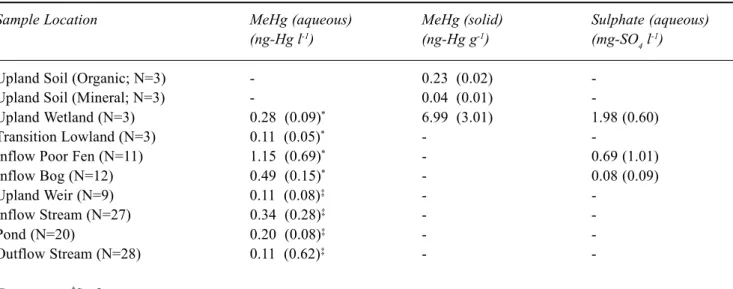
Table 1. Concentrations of aqueous and solid phase methylmercury and aqueous sulphate in various catchment units. Concentrations are given as the mean of all measured values with the standard deviation about the mean in brackets. A dash indicates that no data are available for the determinand in question in that catchment unit.
Sample Location MeHg (aqueous) MeHg (solid) Sulphate (aqueous)
(ng-Hg l-1) (ng-Hg g-1) (mg-SO
4 l -1)
Upland Soil (Organic; N=3) - 0.23 (0.02)
-Upland Soil (Mineral; N=3) - 0.04 (0.01)
-Upland Wetland (N=3) 0.28 (0.09)* 6.99 (3.01) 1.98 (0.60)
Transition Lowland (N=3) 0.11 (0.05)* -
-Inflow Poor Fen (N=11) 1.15 (0.69)* - 0.69 (1.01)
Inflow Bog (N=12) 0.49 (0.15)* - 0.08 (0.09)
Upland Weir (N=9) 0.11 (0.08)‡ -
-Inflow Stream (N=27) 0.34 (0.28)‡ -
-Pond (N=20) 0.20 (0.08)‡ -
-Outflow Stream (N=28) 0.11 (0.62)‡ -
METHYLMERCURY IN CATCHMENT PORE WATERS AND SOILS
On the upland hillslopes, solid phase MeHg concentrations in the organic soil horizon and in ‘upland wetland’ sediments are higher than elsewhere in the upland portion of the catchment. Similarly, the pore water concentrations are elevated in the upland wetland. The presence of elevated MeHg concentrations in the O-horizon may indicate a combination of the direct accumulation of atmospherically-deposited MeHg (St. Louis et al., 1996), the deposition of MeHg in leaf litter (St. Louis et al., 2001) and potentially in situ methylation during wet conditions. Certainly the high MeHg concentrations in the small ‘upland wetland’ area indicates a similarity of process to the larger valley bottom peatland; more persistent anoxic conditions favourable for sulphate reduction and in situ methylation.
In the valley bottom peatland, MeHg concentrations are variable across the landscape and are related in part to recharge-discharge function. This study confirms earlier findings (Branfireun et al., 1996) that MeHg concentrations are elevated at the surface (up to 3 ng l–1) and decrease sharply with depth in areas of groundwater discharge (poor fen). In the area of groundwater recharge (raised bog), MeHg concentrations are not as high and lack the distinctive maxima in the near surface zone. When the poor fen and raised bog are exhibiting their expected discharge and recharge pattern (e.g. July, 1996), peak MeHg concentrations are at the water table in the poor fen (upward mass flux), and at –30 cm below in the raised bog (downward mass
flux). During a dry summer when this discharge and recharge pattern breaks down (e.g. August 1, 1995), the maximum MeHg concentrations remain similar but are now located below the water table in the poor fen coinciding with a reversal in groundwater flow direction (Devito et al., 1997; Branfireun and Roulet, 1998). For the dry summer, the concentration in the raised bog is not affected.
This peatland distribution of MeHg is related to the delivery of sulphate via a groundwater flow path in the poor fen zone (Fig. 4a). Higher concentrations of sulphate are seen at depth in the poor fen and, in conjunction with vertical transport via groundwater upwelling, supply the near surface peat and pore water with the sulphate required for Hg methylation. Recent experiments have demonstrated that an increased supply of sulphate to a methylating environment increases ambient pore water MeHg concentrations (Branfireun et al., 1999; 2001). The near-surface pore water sulphate concentrations are similar at the fen and the bog due to delivery from atmospheric deposition and more oxic conditions. It is reasonable to surmise that there is a larger and more reliable supply of sulphate to the peat profile in the fen due to its groundwater-fed character. Moreover, the fen water table is consistently closer to the wetland surface, allowing for a more direct input of sulphate and labile forms of DOC to the zone of methylation than in the bog.
Sulphate and MeHg concentrations are significantly and negatively related in (near) surface waters throughout the catchment (Fig. 5), consistent with other evidence that sulphate reduction is a mechanism by which MeHg is Table 2. Comparison of catchment MeHg yields from this study with others reported in the literature.
Adapted from Driscoll, et al., 1998.
Location MeHg Yield (µg-1 ha-1 ) Reference
Southern Sweden 3.3 Lee and Hultberg (1990)
Northern Sweden (Wetland) 2.2 - 4.4 Lee et al. (1995)
Wisconsin (Wetland Area Only) 6.0 - 15.0 Krabbenhoft et al. (1995)
Ontario (Upland) 0.2 St. Louis et al., (1996)
Ontario (Riverine Wetland) 0.3 - 0.9 St. Louis et al. (1996)
Ontario (Valley Bottom Wetland) 0. 7 - 2.5 St. Louis et al. (1996)
Ontario (Basin Wetland)1 3.6 - 6.8 St. Louis et al. (1996)
New York (Wetland) 4.7 Driscoll et al. (1998)
Ontario (Whole Catchment) 1.7 - 5.2 This study
Ontario (Wetland; OutflowArea Only)2 29 - 86 This study
1Yields from the “Ontario Basin Wetland” from St. Louis et al. (1996) are for the same catchment as studied here,
with yields cited being the range reported over 1990-1993.
2 Yield calculated per unit area of contributing area of the post-pond peatland only (2.5 ha) as per method of
produced, and that the highest MeHg concentrations are found where sulphate is present, but limited (e.g. Gilmour et al., 1998). This relationship breaks down for subsurface waters where MeHg and sulphate concentrations are both in strongly anaerobic conditions such as the deeper peat in the raised bog profile.
THE ROLE OF THE CATCHMENT HYDROLOGICAL CASCADE
The main peatland in this catchment is the dominant control on the supply of MeHg. The lack of a statistically significant relationship between pond and catchment outflow MeHg concentrations in both study years indicates that it is only the approximately 300 m of peatland over which the outflow stream flows that controls the supply of MeHg to the outflow and governs catchment MeHg yield. Recalculating the catchment MeHg yields assuming that the entire 2.5 ha of post-pond peatland is the sole MeHg contributor to the catchment outflow gives a value of 29–86 mg ha–1 d–1, over the ice-free season (May-October) (Table 2). This range of values is an order of magnitude larger than the whole catchment yields calculated here and in other studies, and certainly brings into question the utility of calculating catchment-scale yields of MeHg or any other solute when the source area of that solute is ill defined.
These findings indicate strongly that the order of the different landscape types along the catchment hydrological cascade determines whether or not a catchment will be a net exporter of MeHg. In this case, a number of landscape units are net sources of MeHg, including the upland wetland and the inflow portion of the peatland. However, between these landscape units and the downstream system, intervening landscape units negate the influence of these zones of MeHg production at the catchment scale. In the case of the upland wetland, a portion of mineral hillslope binds/demethylates MeHg, and in the case of the inflow peatland, an open water body mutes the peatland’s influence through in-lake MeHg cycling (Sellers et al., 1996). Thus, it is only the outflow peatland, which, given its place in the landscape, exerts the dominant influence over the yield of MeHg from this headwater catchment to the downstream system.
Conclusion
Catchment hydrology is a strong control on the MeHg dynamics of this boreal headwater catchment, and accounts for the differences in MeHg burdens between upland mineral and peat soils, the form of MeHg profiles in the different peatland sub-types and the yield of MeHg from the
catchment. The water-borne flux of important nutrients such as sulphate via surface and subsurface pathways influences in situ Hg methylation processes and requires an understanding of the hydrological interaction between the landscape units (i.e. upland hillslopes and peatlands). The characterisation of intra- and inter-annual variability in catchment hydrological response and water yield and the evaluation of the importance of the order of the catchment landscape units in the hydrological cascade are important steps towards understanding catchment MeHg dynamics. Future work in this area must include more efforts on the in situ geochemical and biological controls on Hg methylation and demethylation. In addition, an evaluation of the relative importance of the different MeHg contributing areas by evaluating the magnitude of MeHg sources and sinks, and the hydrological connectivity of catchment compartments are critical if the relationships between MeHg production, hydrological flowpaths and catchment MeHg yield are to be revealed.
Acknowledgements
The authors thank A. Heyes, M. Branfireun, V. St. Louis, N. Comer and B. Stevenson for their assistance in the laboratory and field. The staff of the Experimental Lakes Area provided important logistical support and data, with specific thanks to K. Beaty and M. Lyng. M. Waddington, A. Heyes, M. Branfireun, C. Mitchell, A. James, M. Loomis and an anonymous reviewer are thanked for their helpful comments on previous versions of the manuscript. This research was supported by a NSERC grant to N. Roulet, and a NSERC Scholarship and a McGill Major Fellowship to B. Branfireun.
References
Benoit, J.M., Gilmour ,C.C. and Mason, R.P., 1999. Estimation of mercury-sulfide speciation in sediment pore waters using octanol-water partitioning and implications for availability to methylating bacteria. Environ. Toxicol. Chem., 18, 2138–2141. Benoit, J.M., Gilmour ,C.C. and Mason, R.P., 2001. Aspects of bioavailability of mercury for methylation in pure cultures of Desulfobulbus propionicus (1pr3). Appl. Environ. Microbiol.,
67, 51–58.
Bloom, N.S. and Fitzgerald, W.F., 1988. Determination of volatile mercury species at the picogram level by low temperature gas chromatography with cold-vapor atomic fluorescence detection.
Anal. Chim. Acta, 208, 151–161.
Branfireun, B.A.and Roulet, N.T.,1998. The baseflow and storm flow hydrology of a Precambrian Shield headwater peatland.
Hydrol. Process., 12, 57–72.
Branfireun, B.A., Heyes, A. and Roulet, N.T., 1996. The hydrology and methylmercury dynamics of a Precambrian Shield headwater peatland. Water Resour. Res., 32, 1785-1974.
Branfireun, B.A., Hilbert, D. and Roulet, N.T., 1998. Sinks and sources of methylmercury in a boreal catchment. Biogeochem.,
41, 277–291.
Branfireun, B.A., Roulet, N.T., Kelly, C. and Rudd, J.W.M., 1999. Sulphate stimulation of mercury methylation in a boreal peatland: Toward a link between acid rain and the mercury cycle.
Global Biogeochem. Cycle, 13, 743–750.
Branfireun, B.A., Bishop, K., Roulet, N.T., Granberg, G. and Nilsson, M., 2001. Mercury cycling in boreal ecosystems: the long-term effect of acid rain constituents on peatland pore water methylmercury concentrations, Geophys. Res. Let., 28, 1227– 1230.
Devito, K.J., Waddington, M.J. and Branfireun, B.A., 1997. Flow reversals in peatlands influenced by local groundwater systems,
Hydrol. Process., 11, 103–110.
Donahue, W.F., Schindler, D.W., Page, S.J. and Stainton, M.P., 1998. Acid-induced changes in DOC quality in an experimental whole-lake manipulation. Environ. Sci. Technol., 32, 2954– 2960.
Driscoll, C.T., Holsapple, J., Schofield, C.L. and Munson, R., 1998. The chemistry and transport of mercury in a small wetland in the Adirondack region of New York, USA. Biogeochem., 40, 137–146.
Gilmour C.C., Riedel, G.S., Ederington, M.C., Bell, J.T., Benoit, J.M., Gill, G.A. and Stordal, M.C., 1998. Methylmercury concentrations and production rates across a trophic gradient in the northern Everglades. Biogeochem., 40, 327–345.
Horvat, M., Bloom, N.S. and Liang, L., 1993. Comparison of distillation with other current isolation methods for the determination of methyl mercury compounds in low level environmental samples. Part 1. Sediments. Anal. Chim. Acta,
281, 135–152.
Hurley, J.P., Benoit, J.M., Babiarz, C.L., Shafer, M.M., Andren, A.W., Sullivan, J.R., Hammond, R. and Webb, D.A., 1995. Influences of watershed characteristics on mercury levels in Wisconsin rivers, Environ. Sci. Technol., 29, 1867–1875. Kelly, C.A., Rudd, J.W.M., Bodaly, R.A., Roulet, N.T., St. Louis,
V.L., Heyes, A., Moore, T.R., Schiff, S., Aravena, R., Scott, K.J., Dyck, B., Harris, R., Warner, B. and Edwards, G., 1997. Increases in fluxes of greenhouse gases and methyl mercury following flooding of an experimental reservoir. Environ. Sci.
Technol., 31, 1334–1344.
Krabbenhoft, D.P., Benoit, J.M., Babiarz, C.L., Hurley, J.P. and Andren, A.W., 1995. Mercury cycling in the Allequash Creek watershed, northern Wisconsin. Water Air Soil Pollut., 80, 425– 433.
Krabbenhoft, D.P., Hurley, J.P., Olson, M.L. and Cleckner, L.B., 1998. Diel variability of mercury phase and species distributions in the Florida Everglades. Biogeochem., 40, 311–325. Lee, Y.-H. and Hultberg, H., 1990. Methylmercury in some
Swedish surface waters. Environ. Toxicol. Chem., 9, 833-841. Lee, Y.H., Bishop, K., Petterson, C., Iverfelt, Å. and Allard, B., 1995. Subcatchment output of mercury and methylmercury at Svartberget in Northern Sweden. Water Air Soil Pollut., 80, 455– Marvin-DiPasquale, M., Agee, J., McGowan, C., Oremland, R. S., Thomas, M., Krabbenhoft, D. and Gilmour, C.C., 2000. Methyl-mercury degradation pathways: A comparison among three mercury-impacted ecosystems. Environ. Sci. Technol., 34, 4908–4916.
Schindler, D.W., 1980. The effect of fertilization with phosphorus and nitrogen versus phosphorus alone on eutrophication of experimental lakes. Limnol. Oceanogr., 25, 1149-1152. Schindler, D.W., 1997. Widespread effects of climate warming
on freshwater ecosystems in North America. Hydrol. Process.,
28, 350–355.
St. Louis, V.L., Rudd, J.W.M., Kelly, C.A., Beaty, K.G., Bloom, N.S. and Flett, R.J., 1994. Importance of wetlands as sources of methyl mercury to boreal forest ecosystems. Can. J. Fish.
Aquat. Sci., 51, 1065–1076.
St. Louis, V.L., Rudd, J.W.M., Kelly, C.A., Beaty, K.G., Flett, R.J. and Roulet, N.T., 1996. Production and loss of methylmercury and loss of total mercury from boreal forest catchments containing different types of wetlands. Environ. Sci.
Technol., 30, 2719–2729.
St Louis, V.L., Rudd, J.W.M., Kelly, C.A., Hall, B.D., Rolfhus, K.R., Scott, K.J., Lindberg, S.E. and Dong, W., 2001. Importance of the forest canopy to fluxes of methyl mercury and total mercury to boreal ecosystems. Environ. Sci. Technol.,
35, 3089–3098.
Sellers, P., Rudd, J.W.M., Kelly, C.A. and Machutcheon, A., 1996. Photodegradation of methylmercury in lakes. Nature, 380, 694– 697.