HAL Id: ineris-01863835
https://hal-ineris.archives-ouvertes.fr/ineris-01863835
Submitted on 29 Aug 2018HAL is a multi-disciplinary open access archive for the deposit and dissemination of sci-entific research documents, whether they are pub-lished or not. The documents may come from teaching and research institutions in France or abroad, or from public or private research centers.
L’archive ouverte pluridisciplinaire HAL, est destinée au dépôt et à la diffusion de documents scientifiques de niveau recherche, publiés ou non, émanant des établissements d’enseignement et de recherche français ou étrangers, des laboratoires publics ou privés.
Jannes Kinscher, Simone Cesca, Pascal Bernard, Isabelle Contrucci, Anne
Mangeney, Jack-Pierre Piguet, Pascal Bigarre
To cite this version:
Jannes Kinscher, Simone Cesca, Pascal Bernard, Isabelle Contrucci, Anne Mangeney, et al.. Re-solving source mechanisms of microseismic swarms induced by solution mining. Geophysical Jour-nal InternatioJour-nal, Oxford University Press (OUP), 2016, 206 (1), pp.696-715. �10.1093/gji/ggw163�. �ineris-01863835�
Resolving source mechanisms of microseismic swarms induced by solution mining
J. Kinscher1*, S. Cesca2, P. Bernard3, I. Contrucci1, A. Mangeney3,4, J.P. Piguet5, and P.Bigarré1
1
L’Institut National de l’Environnement Industriel et des Risques INERIS, Nancy, France
2
GFZ German Research Centre for Geosciences, Potsdam, Germany
3
Institut de Physique du Globe de Paris IPGP, Sorbonne Paris Cité, UMR 7154 CNRS, Paris, France
4
University Paris Diderot, Paris and ANGE Team, INRIA, CETMEF, J.-Louis Lions, Paris, France
5
Université de Lorraine, GeoRessources lab.,campus Artem, Nancy, F54042, France
*Corresponding Author: J. Kinscher [email protected]
INERIS Nancy
c/o École des Mines de Nancy Campus ARTEM CS 14234, F-54042 Nancy Cedex Telephone : (+33)3 55 66 28 81 3 4 5 6 7 8 9 10 11 12 13 14 15 16 17 18 19 20 21 22 23 24 25 26 27 28 29 30 31 32 33 34 35 36 37 38 39 40 41 42 43 44 45 46 47 48 49 50 51 52 53 54 55 56 57 58 59
Abstract
In order to improve our understanding of hazardous underground cavities, the development and collapse of a ~200 m wide salt solution mining cavity was seismically monitored in the Lorraine basin in northeastern France. The microseismic events show a swarm-like behaviour, with clustering sequences lasting from seconds to days, and distinct spatiotemporal migration. Observed microseismic signals are interpreted as the result of detachment and block breakage processes occurring at the cavity roof. Body wave amplitude patterns indicated the presence of relatively stable source mechanisms, either associated with dip-slip and/or tensile faulting. Signal overlaps during swarm activity due to short inter-event times, the high frequency geophone recordings, and the limited network station coverage often limit the application of classical source analysis techniques. To overcome these shortcomings, we investigated the source mechanisms through different procedures including modelling of observed and synthetic waveforms and amplitude spectra of some well located events, as well as modelling of peak-to-peak amplitude ratios for the majority of the detected events. We extended the latter approach to infer the average source mechanism of many swarming events at once, using multiple events recorded at a single three component station. This methodology is applied here for the first time and represents an useful tool for source studies of seismic swarms and seismicity clusters. The results obtained with different methods are consistent and indicate that the source mechanisms for at least 50% of the microseismic events are remarkably stable, with a predominant thrust faulting regime with faults similarly oriented, striking NW-SE and dipping around 35-55°. This dominance of consistent source mechanisms might be related to the presence of a preferential direction of pre-existing crack or fault structures. As an interesting by-product, we demonstrate, for the first time directly on seismic data, that the source radiation pattern significantly controls the detection capability of a seismic station and network.
3 4 5 6 7 8 9 10 11 12 13 14 15 16 17 18 19 20 21 22 23 24 25 26 27 28 29 30 31 32 33 34 35 36 37 38 39 40 41 42 43 44 45 46 47 48 49 50 51 52 53 54 55 56 57 58 59
1. INTRODUCTION
A series of catastrophic subsidence and ground failure events occurred in the 1990’s in the iron-ore basin of the Lorraine region in northeastern France. Decades of intensive excavation mining activity have left vast underground rooms and pillars beneath urban areas some of which have collapsed (e.g. Didier 2008). To prevent these disasters in the Lorraine region and other post-mining districts, current research aims to better understand the governing failure mechanisms and dynamics and to improve the efficiency of local microseismic and geodetic monitoring, which represents a major instrument of the French post-mining risk management (e.g. Contrucci et al. 2010; Couffin et al. 2003; Didier 2008).
In this context, the "Cerville-Buissoncourt" multiparameter research project was carried out by the research Group for the Impact and Safety Of underground workS (GISOS,
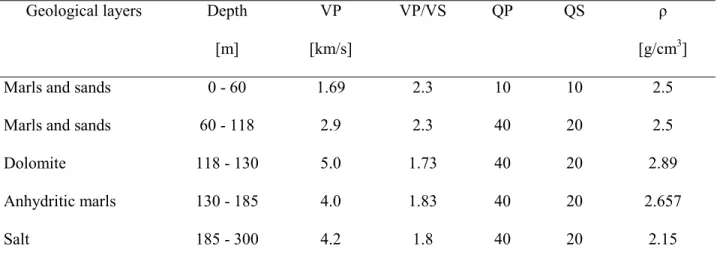
http://gisos.ensg.inplnancy.fr/gisos-info-en/gisos-info-en/) in the Lorraine basin. During the period 2004-2009, an evolving, ~200 m wide salt solution mining cavity initiated by brine pumping (Fig. 1) was monitored until its final, controlled collapse in February 2009 (Contrucci et al. 2011; Kinscher et al. 2015; Klein et al. 2008; Jousset & Rohmer 2012; Lebert et al. 2011; Mercerat et al. 2010). The salt deposit was exploited by solution mining using the channel and drilling technique along two exploitation profiles A and B (Fig. 1). The local geology is part of the Triassic salt formation of the Paris Basin, which consists of subhorizontal submarine sediments, including a thin and stiff Dolomite layer at 119 to 127.5 m depth (Fig. 1, Table 1), which is supposed to significantly control the mechanical stability of the salt cavity (Daupley et al. 2005; Mercerat 2007). During the project period, a huge microseismic dataset of about 50,000 triggered event files, was recorded by a microseismic network containing nine 40 Hz geophones (Contrucci et al. 2011) mainly installed in boreholes (Fig. 1).
Understanding the source mechanisms associated with the microseismic data is of particular interest to evaluate existing mechanical models and to understand the governing ground failure dynamics. However, the application of adequate, full-waveform based source analysis tools, like automatic moment tensor inversion approaches (e.g. Dahm et al. 1999; Sen et al. 2013), is challenging and limited for the Cerville dataset. The microseismic events appear preliminary in the form of swarms (~ 80 %), where individual
3 4 5 6 7 8 9 10 11 12 13 14 15 16 17 18 19 20 21 22 23 24 25 26 27 28 29 30 31 32 33 34 35 36 37 38 39 40 41 42 43 44 45 46 47 48 49 50 51 52 53 54 55 56 57 58 59
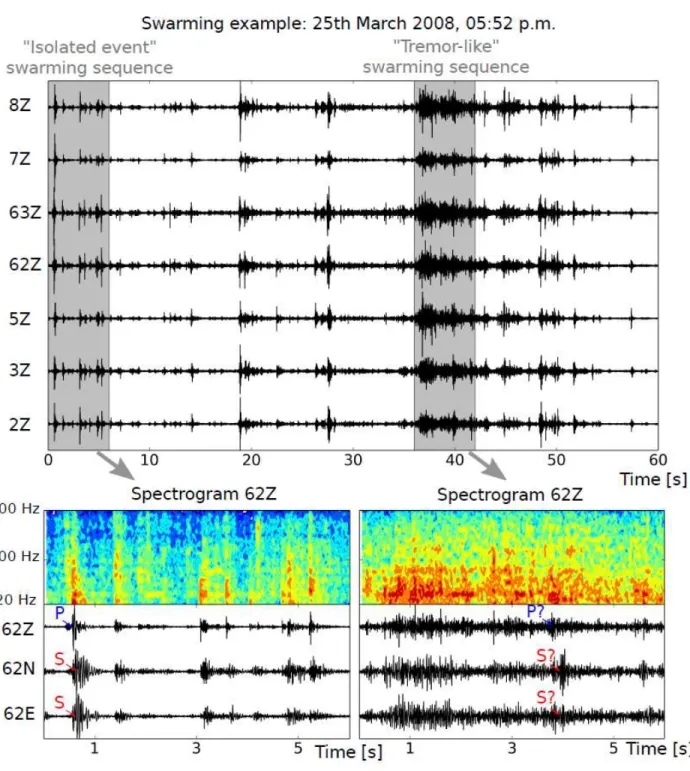
events often cannot be clearly isolated from each other (Fig. 2) (Kinscher et al. 2015). Moreover, the high frequency data show the presence of strong propagation effects, in particular strong refractions at the Dolomite layer (Kinscher 2015; Kinscher et al. 2015), which are difficult to model with sufficient accuracy, and thus strongly affect the robustness of such inversion approaches. In addition, a stable source inversion is hindered by the limited number and azimuthal coverage of three component stations (Fig. 1). We present a comprehensive and unconventional source analysis study constraining the governing source mechanisms for almost the entire microseismic dataset. The analysis is a continuation of Kinscher et al. (2015), who addressed the detection and location problem of microseismic swarms at Cerville. Kinscher et al. (2015) analyzed a dataset corresponding to a microseismic crisis lasting from March to May 2008, which was related to a significant upward migration of the cavity roof by about 50 m. The location results showed that microseismic swarms represent systematic epicentre migration sequences (lasting from seconds to days), which were interpreted as dynamic detachment and block breakage processes at the cavity roof. In addition, they reported an apparent systematic source effect on the body wave amplitude pattern, documenting an apparent similarity in source mechanisms for most recorded events, whose detailed analysis is the main interest of this study.
The paper is organized as follows: first, we present the main features of the microseismic records, some previous source analysis attempts, and the characteristics of the observed systematic source effect (Section 2). Section 3 introduces the different used datasets. Section 4 provides details of the adopted source inversion approach, and the inversion results. The multiple source inversion results are discussed in Section 5, where we propose a preliminary model to explain the apparent stability in source mechanisms.
2. PREVIOUS SOURCE STUDIES AND INDICATIONS FOR A SYSTEMATIC SOURCE EFFECT
At the Cerville-Buissoncourt study site, microseismic swarming events have been classified in two major event groups (Fig. 2): (i) isolated events, where single events are distinguishable and (ii) tremor-like
3 4 5 6 7 8 9 10 11 12 13 14 15 16 17 18 19 20 21 22 23 24 25 26 27 28 29 30 31 32 33 34 35 36 37 38 39 40 41 42 43 44 45 46 47 48 49 50 51 52 53 54 55 56 57 58 59
events, which represent quasi-continuous signals formed by interlaced seismic events (Mercerat et al. 2010; Kinscher et al. 2015). Despite this formal difference in the signal appearance, the event location results suggested that the two microseismic event types represent fracturing and breakage processes at the cavity roof (Kinscher et al. 2015). Moreover, no differences in the spectral characteristics could be observed among the two families of signals from the recordings of high frequency instruments. The spectral content for both event types is dominated by frequencies in the range 10-150 Hz (Fig. 2), which agrees with the expected range for shearing and detachment cracking at the cavity roof (Malovichko et al. 2010; Wust-Bloch & Joswig 2006).
Mercerat et al. (2010) studied the source spectra of eight events occurring in both isolated and tremor-like swarming sequences in the project period 2005-2007, without finding any significant difference in source parameters. Using an omega-squared (ω2) model (Aki 1967) and Brune's scaling approach for S wave spectra (Brune 1970), the authors found moment magnitudes in the range Mw -2 to 0, source radii of a few to several tens of meters (6 - 31 m) and relatively low stress drops compared to natural earthquakes ranging from 10-3 to 10-2 MPa. Furthermore, the authors suggested the presence of tensile source components indicated by low S/P wave displacement spectral plateau ratios ΩS/ΩP of < 4, which are
inconsistent with the radiation pattern of a pure shear crack model (Walter & Brune 1993). In addition, laboratory tests indicated extremely low tensile strengths with respect to some Marl samples, located at the cavity roof (Mercerat et al. 2010; Souley et al. 2008).
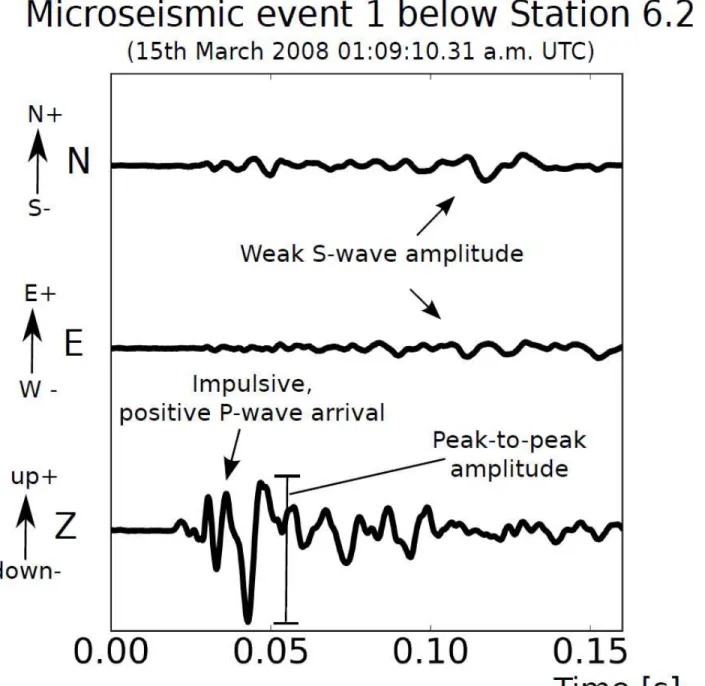
Recently, Kinscher et al. (2015) suggested the presence of an apparent source effect by means of S/P wave amplitude ratio inspection of 54 selected events of the 2008 crisis. They observed that S/P wave amplitude ratios became systematically smaller for smaller station incidence angles, so that one observes comparatively very strong P compared to S waves when the receiver is located directly above the event. Here, we confirm this tendency for 20 more selected events of the 2008 crisis (Appendix A), all located below stations 6.1-3 (Fig. 1a). The waveform example of “event 1” in Figure 3 shows a dominant P wave amplitude on the vertical component, while significantly smaller S waves barely can be seen on the horizontal components. 3 4 5 6 7 8 9 10 11 12 13 14 15 16 17 18 19 20 21 22 23 24 25 26 27 28 29 30 31 32 33 34 35 36 37 38 39 40 41 42 43 44 45 46 47 48 49 50 51 52 53 54 55 56 57 58 59
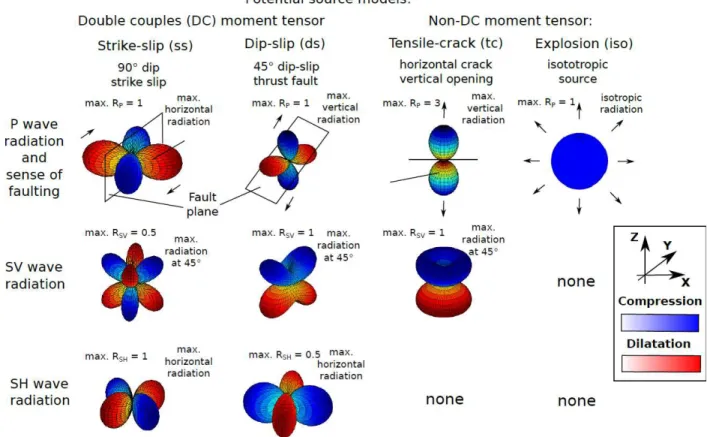
This consistent finding suggests that analyzed events had very similar source mechanisms, which are in agreement with a source model of predominant tensile faulting with a horizontal plane, with dominant P wave upward and dominant SV-wave radiation at 45° (Kinscher et al. 2015) (Fig. 4). However, Kinscher et al. (2015) found also a clear evidence for the presence of significant SH wave energy, supporting the presence of shearing mechanisms, i.e. dip-slip faulting (Fig. 4). Most of the visually inspected events, including the 54 events of the training set (Kinscher et al. 2015) and the 20 events below stations 6.1-3 (Appendix A), demonstrated clearly positive upward P wave polarities as shown for event 1 (Fig. 3). No event with clear negative P polarity was observed, which is consistent with the tensile source model with horizontal plane, but also fitting with a dip-slip mechanisms associated with thrust faulting. Consequently, when referring to a dip-slip mechanism, we generally refer to a pure thrust fault mechanism.
3. DATA
The microseismic event catalogue used in this study was generated by using the swarming adapted detection and location approaches of Kinscher et al. (2015). Automatic detection was performed by using a polarization approach providing P wave phase arrival detection and P wave polarization angles, i.e. incidence and backazimuth angle. The polarization approach is only applied to three component stations 3, 5 and 6.2. Locations were then obtained by using the polarization angles and an amplitude based location approach (Fig. 1). While epicentre locations are well resolved, source depth estimations remain uncertain.
In total, the catalogue considered here contains ~35,000 events. Around 23,000 events have been detected in 2008 with ~15,000 events during the March to May microseismic crisis and ~8,000 events during the subsequent aftershock sequence lasting until the end of December 2008. From January 2009 to February 12, 2009, 10:00 a.m., we detected further ~13,000 events which correspond to the initial phase of the induced cavity collapse and the failure of the stiff Dolomite layer in the overburden (Contrucci et al. 2011; Jousset & Rohmer 2012; Lebert et al. 2010).
3 4 5 6 7 8 9 10 11 12 13 14 15 16 17 18 19 20 21 22 23 24 25 26 27 28 29 30 31 32 33 34 35 36 37 38 39 40 41 42 43 44 45 46 47 48 49 50 51 52 53 54 55 56 57 58 59
We selected four different event datasets from this event catalogue, which were chosen for specific reasons associated with the performed source analysis (Fig. 1). Dataset 1 represents the 74 classically located events which have more reliable source depth estimations (Fig. 1a,b). Dataset 2 contains ~6,000 events of the microseismic crisis in 2008 and the subsequent aftershock sequence. This dataset includes the strongest events of this period and include those events detected by all three component stations 3, 5, and 6.2 and thus where P wave polarization angle could be determined (Fig. 1). Dataset 3 and 4 represent those events detected by station 6.2 in 2008 and 2009. Dataset 3 contains ~15,000 events detected during the crisis and the aftershock sequence in 2008 (~ 66% of all events in 2008). Dataset 4 contains all events of dataset 3 plus ~7,500 events detected during the initial collapsing phase in 2009 (~ 57% of all events in 2008 and 2009). Incidence angles measured at station 6.2 for dataset 4 are in average higher as compared to dataset 3 as probably due to the increasing microseismic activity in the overburden at shallower source depth. Datasets 2-4 sample both isolated and tremor-like event types (Fig. 2).
4. SOURCE ANALYSIS AND RESULTS
We present a comprehensive source analysis, constraining the source mechanisms for the 2008 data. Our analysis is based on (i) qualitative observations (Section 4.2 and 4.5) and (ii) quantitative source inversions (Section 4.3 and 4.4) based on specific datasets (Section 3).
In Section 4.2, we constrain the origin of the observed systematic source effect (Kinscher et al. 2015) by using different observed and synthetic peak-to-peak body wave amplitude ratios. We examine T/ZR ratios to assess the relative SH-wave energy compared to P and SV waves, which provides an appropriate criterion to distinguish between shear source, i.e. a double couple (DC) model, and non shear models, such as a tensile crack model or an isotropic source (Fig. 4). At vertical ray incidence, SH wave energy is zero for the tensile crack model and the dip-slip DC model, however it increases for the latter model for more horizontal incidence angles. For this reason, we analyze T/ZR ratios as a function of incidence angles. For this analysis we consider dataset 1, because the incidence angles for all three component stations are relatively well known from reliable source depth. Then, we discuss the distribution of T/ZR
3 4 5 6 7 8 9 10 11 12 13 14 15 16 17 18 19 20 21 22 23 24 25 26 27 28 29 30 31 32 33 34 35 36 37 38 39 40 41 42 43 44 45 46 47 48 49 50 51 52 53 54 55 56 57 58 59
ratios for dataset 2, where it is assumed that locations are homogenously distributed over the cavity zone. Another important reason for the choice of T/ZR instead of S/P ratios is that no incidence angle are required for its calculation, which are uncertain for station 3, 5, and 63 (Kinscher et al. 2015).
As shown by Figure 4, P, SV and SH wave radiations are radially symmetric for the tensile crack model; they change significantly for the dip-slip model, where they depend on the fault orientation. This distinction provides another criterion to discriminate among these models. To this goal, we analyze SV/P and SH/SV amplitude ratios at station 6.2 using dataset 3. Station 6.2 is the most appropriate for this analysis, since it provides the full range of backazimuth angles (0-360°) and refracted signals are less pronounced, so that estimated incidence angles approximate relatively well the true source-receiver direction (Kinscher et al. 2015).
The quantitative source analysis relies on two inversion approaches. The first approach (Section 4.3) models observed amplitude spectra at different stations to resolve the best source model. The inversion is performed for a single, selected event (event 1, Fig. 3) of dataset 1, located directly below stations 6.1-6.3 (Fig. 1). It is then examined if the observed dominant vertical P wave radiation observed for low incidence angles can be explained by one of the two source models, either DC or tensile crack. Our results show that, in the given monitoring conditions, this approach is not robust and therefore not appropriate to analyze source mechanisms for several events. Robustness and results stability are generally limited by the poor azimuthal coverage of three component stations (Fig. 1), the fit of high frequency data (> 20 Hz) and the presence of strong refraction effects (Kinscher et al. 2015).
A more convenient source inversion approach, used for ~66% of the entire 2008 catalogue, is provided by
inversion 2 (Section 4.4), where peak-to-peak amplitude ratios of station 6.2 for dataset 3 are modelled as
a function of backazimuth and incidence angles. The approach assumes that the source mechanism remains constant for all considered events, which is supported by the systematic source effects observed by Kinscher et al. (2015) for the March-May 2008 activity, and interpreted in terms of focal mechanism similarity. We will show that, if this assumption holds, it is then theoretically feasible to use the microseismic data of several events observed at one single station to constrain a common source
3 4 5 6 7 8 9 10 11 12 13 14 15 16 17 18 19 20 21 22 23 24 25 26 27 28 29 30 31 32 33 34 35 36 37 38 39 40 41 42 43 44 45 46 47 48 49 50 51 52 53 54 55 56 57 58 59
mechanism. This technique will provide the statistically dominant mechanism, if the latter is not the same for all events.
Finally, we investigated the ability of using the single station P-wave detection capability to determine the predominant source mechanism (Section 4.5). For this analysis station 6.2 and dataset 4 were used. The inclusion of the data of the collapsing period in 2009 improves the resolution of the detection performance for high incidence angles.
4.1 Velocity model and synthetic seismogram calculation
Prior to our inversion attempts, Green's functions and synthetic seismograms were calculated using the QSEIS code (Wang 1999). To get reliable source mechanisms from the comparison of observed and synthetic data, it is important to use a well constrained 1-D velocity model. Inclusion of signals strongly affected by 3-D propagation effects, such as scattering, and multipathing at the 3-D cavity structure should be avoided. We used the velocity model shown in Table 1, which is based on the Mercerat et al. (2010) model and includes improved shallow structure estimation due to inclusion of new, precise estimates of P and S wave velocities and Q factors for the sedimentary units located between stations 6.1-3 (Fig. 1). The elastic parameters (VP, VS, QP and QS) were estimated using a cross-correlation and
spectral amplitude ratio approach for the 20 events from dataset 1 located below receivers 6.1-3 (Fig. 1a). S wave velocities and Q factors have only been determined for the sedimentary layer between station 6.2 and 6.3. Resulting VP/VS and QP/QS ratios have then been used to determine S wave parameters for the
shallower layers between station 6.1 and 6.2. Elastic parameters for the Dolomite layer and deeper sedimentary units have been adapted from the model of Mercerat et al. (2010). Details of this procedure can be found in Appendix A.
As shown below, observed and synthetic waveforms, amplitude spectra and peak-to-peak amplitudes are systematically compared for each station. In this context, a Green's function database computed using the Kiwi tools (Heimann 2011; Heimann et al. 2014) allowed a quick computation of synthetic seismograms for different receiver depths (Fig. 1).
3 4 5 6 7 8 9 10 11 12 13 14 15 16 17 18 19 20 21 22 23 24 25 26 27 28 29 30 31 32 33 34 35 36 37 38 39 40 41 42 43 44 45 46 47 48 49 50 51 52 53 54 55 56 57 58 59
4.2 Constrains from peak-to-peak amplitude ratios
Previous studies showed that the fit of body wave amplitude ratios is an appropriate method to determine source parameters of weak and moderate earthquakes associated with short source durations (e.g. Hardebeck & Shearer 2003; Julian & Foulger 1996; Kisslinger 1980; Rau et al. 1996). This approach was already applied to microseismicity related to solution mining (Godano et al. 2012). We used the amplitude ratios to investigate the apparent consistency among source mechanisms by examining the four elementary source models shown in Figure 4.
Peak-to-peak amplitudes (Fig. 3) were measured for a fixed frequency range of 30 - 90 Hz, where signals are most energetic (Fig. 2), and in accordance with the frequency range proposed by Malovichko et al. (2010). Synthetic peak-to-peak amplitudes were estimated from full wave form synthetic seismogram for the same frequency band. T/ZR amplitude ratios were calculated from horizontally rotated seismograms (RTZ radial-coordinate system). SH amplitudes are estimated from the T components. P and SV amplitudes are contained in the R and Z components. P/SV and SV/SH ratios were calculated by full ray oriented component rotation into the LQT coordinate system (e.g. Plesinger et al. 1986).
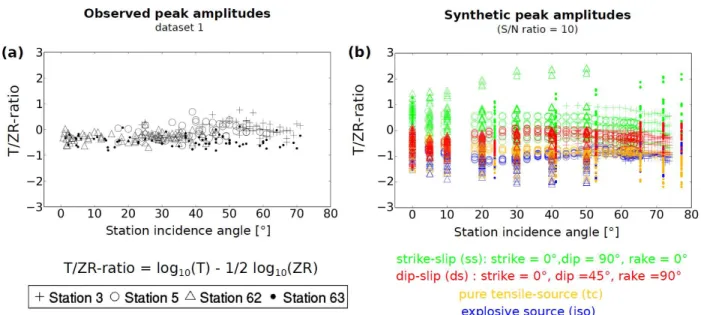
The synthetic T/ZR ratios were calculated for four elementary source models (Fig. 4 and 5b): a strike-slip fault (ss), a dip-slip fault (ds), a tensile source (tc) with horizontal crack geometry, and an explosion (iso). Before ratio calculation we added Gaussian noise to the synthetic seismograms to simulate a S/N-ratio equal to ten, which correspond to the minimum S/N-ratio observed for dataset 1 and 2 (Fig.5). As a result, for source models where SH wave energy is zero (generally for tc, iso but also in some cases for ds and ss), the T component peak-to-peak amplitude is not exactly zero, but equal to the level of background noise.
For each of the four source models and each three component station the synthetic T/ZR ratios were calculated for a 20 m grid of epicentre source locations covering homogeneously the entire cavity zone, while keeping the source depth fixed at 150 m (Fig. 5). In this way, synthetic ratios can be consistently compared to both datasets 1 and 2. Strike for the ds and ss model was assumed to be constant at 0° (Fig.
3 4 5 6 7 8 9 10 11 12 13 14 15 16 17 18 19 20 21 22 23 24 25 26 27 28 29 30 31 32 33 34 35 36 37 38 39 40 41 42 43 44 45 46 47 48 49 50 51 52 53 54 55 56 57 58 59
5). The influence of constant strike on the results is negligible for stations 6.2 and 6.3, where backazimuth angle range from 0-360° for each considered incidence angle. Results for stations 3 and 5 are more sensitive to the choice of strike, since only a limited backazimuth angle range of < 90° is provided for each incidence angle. Nonetheless, using a strike of 0°, synthetic T/ZR ratio generally provide the maximum expected SH wave radiation compared to P and SV waves at both stations for the ss and the ds model, being at a backazimuth of 135° at station 3 and at 305° at station 5 (e.g. Fig. 4).
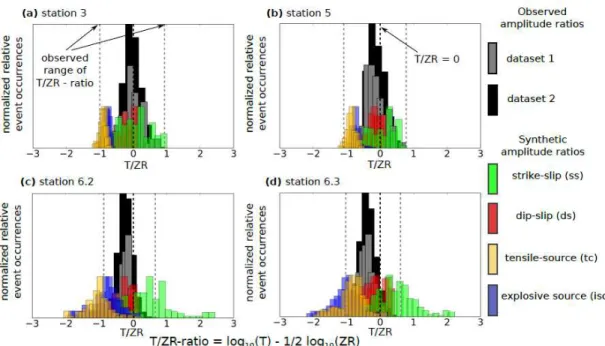
Figure 5 shows the observed and synthetic T/ZR ratios for dataset 1 (Fig. 1). The observed T/ZR-ratios are relatively stable with values between -1 and 1 over the entire range of station incidence angles (Fig. 5a). The comparison with the synthetics shows that the ds model reproduces best the observed amplitude ratio distribution. To show that these results are also valid for the strongest events in 2008, Figure 6 shows the T/ZR ratios for the dataset 2. Figure 6a-d shows that the range of T/ZR ratios for all events also falls in the range from -1 to 1. Again, the comparison to the synthetic T/ZR ratios for the four investigated source models supports a simple ds DC source model. The tc and iso source models only explain some of the lowest observed T/ZR ratios, but do not explain well the majority of observed events. The ss model agrees well with T/ZR ratios for stations 3 and 5, but most of the T/ZR ratios observed at stations 6.2 and 6.3 cannot be explained by this model.
Further evidence for a ds mechanism comes from an increase in the averaged T/ZR ratio with increasing average incidence angles (Fig. 6e,f), as partially observed by Kinscher et al. (2015) for dataset 1. A relative increase of SH wave energy with increasing incidence angle indicates a ds mechanism, as shown by the relation of source radiation coefficients RP,SV,SH (e.g. Boore & Boatwright 1984) for P, SV, SH
waves in Figure 6f. For smaller incidence angles, the wave-field is dominated by P and SV waves, while SH wave energy becomes more important for higher incidence angles as it is mainly radiated in the horizontal plane, where SV wave radiation is smallest (Fig. 4).
The highest average T/ZR amplitude ratio is observed for station 3, for which the average incidence angle is larger than for the other three component stations (Fig. 6e,f). Conversely, the lowest average T/ZR ratio is observed for station 6.2, where the average incidence angle is smallest (Fig. 6e,f), since it is located
3 4 5 6 7 8 9 10 11 12 13 14 15 16 17 18 19 20 21 22 23 24 25 26 27 28 29 30 31 32 33 34 35 36 37 38 39 40 41 42 43 44 45 46 47 48 49 50 51 52 53 54 55 56 57 58 59
right above the centre of the cavity structure (Fig. 1a). We note that the absolute incidence angles in Figure 6e,f may have large uncertainties because the estimated source depths are highly uncertain (e.g. Kinscher et al. 2015). Nonetheless, the relative difference of the average incidence angles observed at each station is likely to be well represented by the distributions shown in Figure 6e.
In contrast to stations 3, 5 and 6.2, observations from station 6.3 deviate from this trend: T/ZR ratios and SH wave energies are lower compared to the other stations, although the average incidence angle is higher. This behaviour is due to significant refraction effects at the Dolomite layer interface, which can lead to a decrease in the T/ZR wave amplitude ratio (Kinscher 2015). In addition, near-field effects might also play a role.
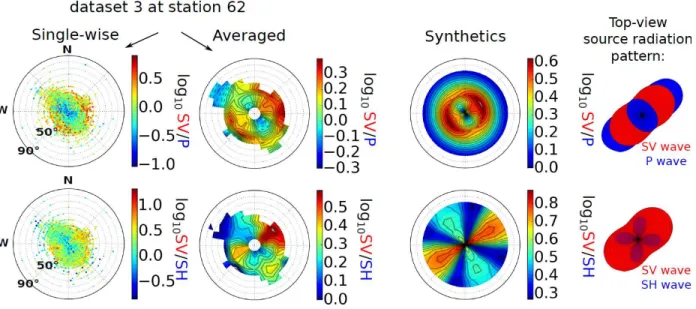
The incidence-angle dependence of peak-to-peak amplitudes suggests a dominant ds source model. To examine azimuthal dependent ds radiation pattern, in Figure 7, we projected the P/SV and SH/SV ratios of dataset 3 to the lower station hemisphere of station 6.2. The SV/P and SH/SV ratios are distributed in a systematic manner, consistent with the source radiation pattern of a pure ds fault striking approximately N150° – 330° (Fig. 7).
The observed SV/P and SH/SV amplitude ratios qualitatively reproduce the trend predicted by the synthetics. However, observed extreme ratios underestimate theoretical prediction for a pure ds model (Fig. 7), likely due to errors and limited resolution in the estimated polarization angles (±10°). Moreover, the observed amplitude ratios probably do not represent distinct ray phases directly comparable to the ray-theoretical radiation pattern, but consist of several seismic phases and rays, as well as scattering effects, which are not reproduced by the synthetics. Smoothing to the synthetic amplitude ratios was applied to 10° steps (from 2° grid points) to reduce extreme values for the synthetics to the same range as the observed ones (Fig. 7).
Both amplitude ratio investigations indicate that the Cerville-Buissoncourt sources consists of remarkably stable NW-SE striking ds mechanisms. However, a mixed source model, combining a dominant DC component with minor tc and/or iso components, cannot be excluded. A dominant DC component seems to contradict results by Mercerat et al. (2010), which reported the presence of significant tensile source
3 4 5 6 7 8 9 10 11 12 13 14 15 16 17 18 19 20 21 22 23 24 25 26 27 28 29 30 31 32 33 34 35 36 37 38 39 40 41 42 43 44 45 46 47 48 49 50 51 52 53 54 55 56 57 58 59
components suggested from very low P/S wave displacement spectra ratios. However, our new estimations for the elastic parameters (Table 1, Appendix A) suggest that seismic wave velocities and Q factors for S waves are less than half of the P wave values, which implies that Mercerat et al. (2010) significantly underestimated S wave attenuation in their spectral analysis, assuming QS = QP and VP/VS =
1.73. Assuming an exponential attenuation law for body waves (e.g. Kinscher et al. 2015), a signal frequency of 30 Hz and a hypocentral distance of 200 m (corresponding to the average distance at Cerville), the amplitude loss of S relative to P waves is two times smaller when using the parameters of Mercerat et al. (2010) rather than our new parameters. Using the new elastic parameters would increase the ΩS/ΩP ratio found by Mercerat et al. (2010) by a factor of two and make them compatible with a DC
source model (Walter & Brune 1993). Source mismodelling is unfortunately common in microseismic high frequency studies where S attenuation is often poorly known (e.g. Eisner et al. 2011).
4.3 Inversion 1: using conventional event-receiver configuration and amplitude spectra
We perform a full waveform moment tensor inversion for the microseismic event 1 (Fig. 1a and 3), assuming a DC constraint (Fig. 4). The selected event is part of dataset 1 and one of the 20 events directly located below stations 6.2 and 6.3 (Appendix A) as well as one of the largest events with Mw ~ 0 in the beginning of the 2008 microseismic crisis (Kinscher 2015).
The inversion was performed by fitting full waveform displacement amplitude spectra in the frequency range 20 - 90 Hz. Amplitude displacement spectra are computed for four three component stations (3, 5, 6.2, and 6.3) as well as three one component stations (2, 7, 8) (e.g. Fig 1). Station 6.1 was not used as data was affected by significant site effects (Kinscher et al 2015); its data does not provide crucial supplementary information compared to the data of stations 6.2 and 6.3. Since the difference in S-P travel times are generally very small (≤ 0.02 s), P and S waves were not separated for the inversion: we fitted whole waveforms amplitude spectra for the Z, N, E components. Amplitude spectra fits are independent of phase shifts between calculated Greens functions and observed seismograms due to potential errors in
3 4 5 6 7 8 9 10 11 12 13 14 15 16 17 18 19 20 21 22 23 24 25 26 27 28 29 30 31 32 33 34 35 36 37 38 39 40 41 42 43 44 45 46 47 48 49 50 51 52 53 54 55 56 57 58 59
travel times, source time origin and mislocation (Cesca et al. 2006; Dahm et al. 1999; Dahm & Krüger 1999; Domingues et al. 2013).
We find the best DC model by a direct grid search over strike, dip and rake with 10° grid intervals. For each focal mechanism we first invert for the scalar moment and then compute the misfit between observed and synthetic amplitudes using the l2-norm. To correct for surface amplification effects, significant at surface stations 7 and 8 (Kinscher et al. 2015), the best fitting scalar moment was determined for each station separately. For each focal mechanism, we obtain an overall misfit, by summing station misfits upon the best fitting scalar moments. Station dependent apparent scalar moments were used to assess the spectral fit at different stations. In the results we found that the average moment scalars estimated for all considered focal mechanisms differed in average by a factor two among deeper stations. However, scalar moments at surface stations 7 and 8 were respectively seven and ten times higher compared to deeper stations. This result is consistent with the magnitude of ground amplification as observed from average spectra in Kinscher et al (2015). The inversion results are summarized in Figure 8. To estimate solution uncertainty we show the misfit contours for 2-D model subspaces of the entire model space spanned by the grid of strike, dip, and rake (Fig. 8a). Contours present the misfit increase of 5 %, 10 % and 25 % from the minimum misfit relative to the entire misfit range. For each grid point of the shown 2-D model spaces, the best misfit value was considered for contour calculation. Gray colours of the grid points itself represent the mean misfit value for each grid point.
Figure 8a shows that the inversion result converges towards a ds faulting mechanism with two preferred solutions (Fig. 8a-b). The minimum misfit is found for a source depth of 180 m; it increases significantly for deeper sources (Fig. 8c). The preferred source depth of 180 m slightly differs from the source depth of 216 m found from S minus P wave arrival times (Fig. 1a and 8c, Appendix A). The first solution (solution
1) indicates a ds faulting with a NE-SW strike of 50° and 230°, while the second one (solution 2) is
striking NW-SE with 130° – 310°, which is consistent with the "trial" ds mechanism of Figure 7.
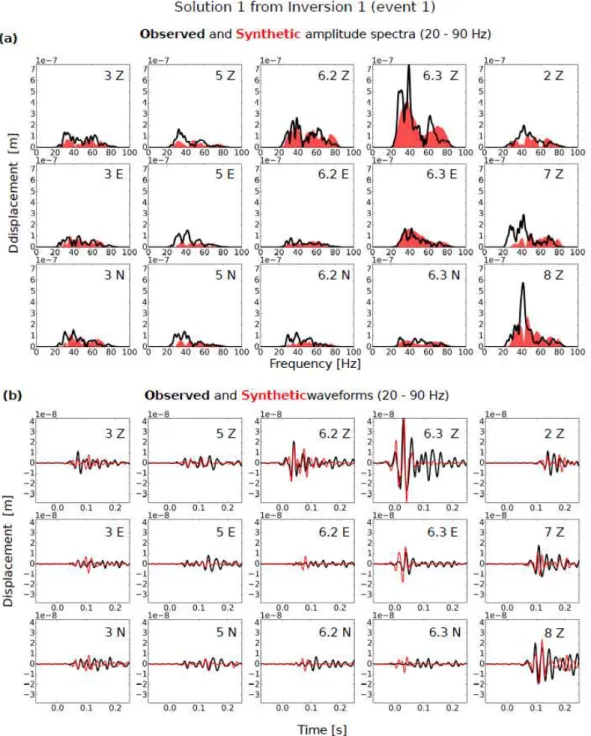
Both solutions do not differ significantly in terms of misfit; hence, both solutions reproduce the observations similarly well. The quality of the fit for amplitude spectra and waveforms for solution 1 is
3 4 5 6 7 8 9 10 11 12 13 14 15 16 17 18 19 20 21 22 23 24 25 26 27 28 29 30 31 32 33 34 35 36 37 38 39 40 41 42 43 44 45 46 47 48 49 50 51 52 53 54 55 56 57 58 59
shown in Figure 9a and b, respectively. Visual fits for solution 2 are of the same quality as for solution 1, and are therefore not shown here. The best fit with respect to waveforms and amplitude spectra is obtained for the Z components of stations 6.2 and 6.3, where the largest amplitudes are dominated by P wave energy. The fit of these components becomes significantly worse when using the ss models shown in Figure 8c for source depths ≤ 150 m, supporting the preferences for a ds DC model documented in the previous Section. Waveform and amplitude spectra at the other stations fit less well illustrating the challenges of inverting local, high frequency data. The ambiguity in the strike direction of the ds source model (Fig. 8a) likely results from high frequency noise, uncertainties in the assumed propagation model, and the limited azimuthal coverage of three component stations.
Our results show that the dominant P wave radiation in the vertical direction can be explained by a ds source model. Moreover, it is demonstrated that the “trial” ds mechanism observed for most of the considered events in 2008 (Fig. 7) is confirmed when analyzing one single event observed from different station observations. Accordingly, we consider solution 2 as the preferred model. In supplementary modelling we tried to improve amplitude spectra fit of solution 1 and 2 by adding a minor tensile source component, which however could not improve the fit. Also a pure tensile source model (0% DC) was tested, but led to a higher misfit of ~0.69 as for solution 1 and 2 (~ 0.61). These results are consistent with observation from Section 4.2, indicating that tensile source components represent only a minor component for the considered events. Nonetheless, regarding the limited quality of amplitude spectra we think that the exact quantity of the tensile component cannot be precisely determined from this data.
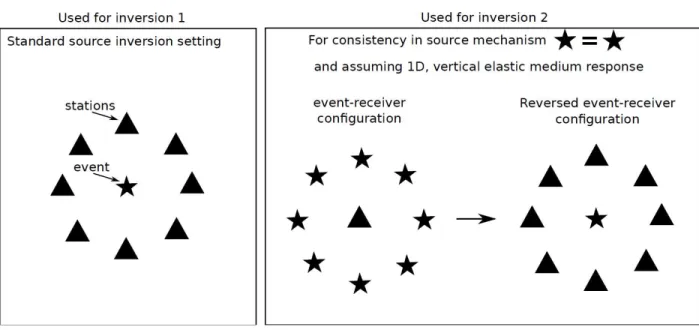
4.4 Inversion 2: using a reversed event-receiver configuration and peak-to-peak amplitudes
We propose a new approach, which uses the observations of several events at one station in order to derive a common focal mechanism based on the theorem of seismic reciprocity (Fig. 10). We assume that seismicity is characterized by a common focal mechanism (Section 4.2 and 4.3, respectively). If this condition holds, the observed signal patterns for one event A at a single station (see Fig. 10, right panel) will depend on the scalar moment, the focal mechanism, and their relative location. If we only consider
3 4 5 6 7 8 9 10 11 12 13 14 15 16 17 18 19 20 21 22 23 24 25 26 27 28 29 30 31 32 33 34 35 36 37 38 39 40 41 42 43 44 45 46 47 48 49 50 51 52 53 54 55 56 57 58 59
relative observations, e.g. the amplitude ratio among different components, we remove the dependency of the observation on scalar moment, which is different for each event. Since we have removed moment dependency and the mechanism is the same for all sources, we can consider the true source locations as that of fictive stations, and the true station locations as the location of one single fictive source recorded at these fictive stations. Indeed, each fictive couple source-station has the same geometry as the real geometrical station-source pair configuration. While in the starting setup, we had the problem of retrieving the source model with data from a single station, in the final setup we have a much improved network geometry and azimuthal coverage, potentially having as many receivers as recorded similar events.
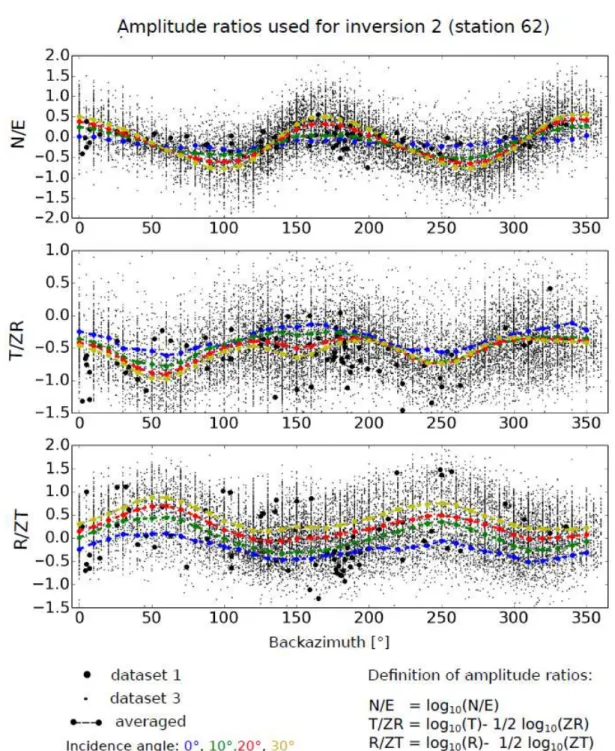
Figure 11 shows observed amplitude ratios for dataset 3 at station 6.2 as a function of incidence and backazimuth angles used for source inversion. Shown are the N/E, the T/ZR, and the R/ZT amplitude ratios. The amplitude ratios have been chosen, since systematic dependencies on the backazimuth and incidence angles could be observed, with local minima and maxima at distinct backazimuths, indicating the presence of a statistically dominant source mechanism (Fig. 11).
The significant dependence of the N/E ratio on the backazimuth angle indicates a predominance of radial wave field components, i.e. P and SV waves, for low incidence angles (≤ 30°) (Fig. 11) which is consistent with a ds model radiation pattern (e.g. Fig. 4). A more randomly distributed N/E ratio with backazimuth would be expected for strike slip radiation pattern associated with dominant SH waves in the horizontal components.
The T/ZR ratio reflects the relative energy of SH compared to P and SV waves, while the R/ZT ratio reflects the relative quantities of P and SV wave amplitudes in the radial and vertical components. The inclusion of the T component in the R/ZT provided slightly better results as compared to a simpler R/Z ratio. We suggest that the inclusion of the T component allows for more accurate simulation of the observed amplitude ratio, since it contains valuable information on the refraction related propagation effects which significantly affects the SH/SV,P ratio, as found from synthetic seismogram modelling (Kinscher 2015). 3 4 5 6 7 8 9 10 11 12 13 14 15 16 17 18 19 20 21 22 23 24 25 26 27 28 29 30 31 32 33 34 35 36 37 38 39 40 41 42 43 44 45 46 47 48 49 50 51 52 53 54 55 56 57 58 59
The inversion is set up to fit the coloured points in Figure 11, which represent the average of 4 incidence angles at 0°, 10°, 20° and 30° and 36 distinct average backazimuth angles for the range 0 – 350° using 10° intervals and ± 10° overlap as consistent with uncertainty in polarization angle determination. As a result, each observed amplitude ratio dataset (N/E, T/ZR, R/ZT) is represented by 144 mean amplitude ratios. Synthetic amplitude ratios were then determined from full waveform synthetic seismograms for the grid of DC models defined in Section 4.3, while for each of these models the theoretical source was placed at 144 different locations, corresponding to the binned backazimuths and incidence angles for a fixed source depth of 150 m. Source depth was defined based on sonar data measurements conducted before and after the crisis in 2008, documenting a cavity roof growth of 50 m with final roof heights ranging from 120 m to 200 m and a mean height of around 150 m (Kinscher et al. 2015). Other source depths in this range have been tested, but had no significant impact on the results.
The fit between the observed and synthetic amplitude ratios was estimated by using the l1-norm. Before misfit calculation, we normalized each of the three observed and synthetic amplitude ratios by division of the absolute maximum value before misfit calculation (Fig. 11). The aim of this normalization was to secure the identification of the mechanism that best fits the observed relative trends in amplitude ratio as a function of backazimuth and incidence angle. Modelling and misfit calculation based on the true ratios did not always provide stable results, since observed extreme ratios are smaller than synthetics. The lower extreme ratios in the observed data are due to errors and limited resolution in the estimated polarization angles, the presence of scattering and multi-pathing effects and to the presence of events that differ in source mechanism.
The grid search results (Figure 12) are consistent with the results of inversion 1 (Fig. 8), and the "trial" ds solution (Fig. 7). The misfit contours indicate, similarly to inversion 1 (Fig. 8), the preference for a dip slip faulting mechanism (Fig. 12). Again, two possible solutions representing almost pure ds faulting with NE-SW and NW-SE striking are found. However, in contrast to inversion 1, the shape of misfit contours and the 25 best solutions show a clear preference to the NW-SE striking model (Fig. 8).
3 4 5 6 7 8 9 10 11 12 13 14 15 16 17 18 19 20 21 22 23 24 25 26 27 28 29 30 31 32 33 34 35 36 37 38 39 40 41 42 43 44 45 46 47 48 49 50 51 52 53 54 55 56 57 58 59
To check the stability of these results and examine possible violations of the a priori assumption of a consistent source mechanism, we applied a Jack-knife approach. We divided dataset 3 into four subsets that provide the calculation of all 144 ratios. The subsets correspond to the four classified periods of microseismic activity in 2008 as defined by Kinscher et al. (2015), with three periods in the crisis from March to May and one long lasting aftershock period from May to December. Subsets contain a total of 2708, 3803, 4209 and 4499 events, respectively. All subsets have been analyzed in the same manner as dataset 3 and showed very similar misfit contours to the ones shown in Figure 12, with a minimum misfit for solution 1. This analysis further underlines the robustness and reliability of the performed inversion and that the a priori assumption seems to be valid independent of time.
The comparison of observed and synthetic ratios, for both solutions, explains the observed trends and dependencies with backazimuth and incidence angle, while the qualitative fit seems better reproduced for
solution 1 (Fig.13). For both solutions, the ratio fit is slightly worse for lower incidence angle ≤ 10°,
which results from erroneous backazimuth angle determination and amplitude ratio calculation at vertical incidence angle (Kinscher et al. 2015). Additional tests showed that weighting or excluding these ratios during inversion does not affect the results.
Solution 1 is clearly in better agreement with the “trial” ds model and the P/SV and SH/SV amplitude
ratios presented in Figure 7, and is thus our preferred model. Quantitatively, we estimated that about 80% of dataset 3 agrees well with the NW-SE striking ds model (Fig. 12), if we allow for a 20° uncertainty in strike. These results were found in a supplementary modelling approach, where we analysed the data-model misfit for solution 1 combined with different quantities of random ds mechanisms. The misfit significantly decreased when assuming a proportion of 20 % of random ds mechanisms, instead of a unique solution 1 ds mechanism or higher proportions of random ds mechanisms. In contrast, the misfit for solution 2 could not be improved from analogue modelling attempts and remained more than twice as large as the improved misfit obtained for solution 1. Consequently, we suggest that solution 1 (NW-SE) is the dominant ds faulting mechanism while random strikes mixed with some unknown proportion of
solution 2 (NE-SW) would represent the remaining 20% of mechanisms.
3 4 5 6 7 8 9 10 11 12 13 14 15 16 17 18 19 20 21 22 23 24 25 26 27 28 29 30 31 32 33 34 35 36 37 38 39 40 41 42 43 44 45 46 47 48 49 50 51 52 53 54 55 56 57 58 59
In summary, we showed that events of dataset 3 can be explained by a common source mechanism using peak-to-peak amplitude estimates from a single three component station. The approach might be an efficient alternative to event-wise source inversion procedures, when studying source mechanisms of seismic clusters and swarms from sparse networks and very local, high frequency recordings. Instead of using amplitude ratios, Kinscher (2015) showed that also multiple event amplitude spectra of the components of one single station can be used to infer the common source mechanism. Results of this approach are consistent with the results found in this study, but required a seismic moment normalization procedure making it more inconvenient compared to the usage of amplitude ratios. It should be noted that the current approach is designed for the usage of one single station only, which might be a drawback, when more than one station and data is available. One solution of this problem might be the implementation of probability density function conjunctions for all involved stations.
4.5 Influence on the detection capability
For automatic event detection a trigger value was used to detect well polarized P wave energy. Assuming a constant seismic noise level, the detection performance is controlled by the P wave amplitude, and an event is detected only when the P wave amplitude exceeds a given threshold at different stations. The recorded P wave amplitude depends on source location, the event magnitude and its focal mechanism. If the station is located close to a nodal plane, even a relatively large event could be missed. The large Cerville dataset and the characteristic repeated focal mechanisms provide an opportunity to investigate whether the detection capacity is affected by the source radiation pattern.
Figure 14 shows the radiation coefficient for P waves (RP) (Boore & Boatwright 1984), calculated for the
ds mechanisms striking NW-SE and NE-SW using a Poisson's ratio of ν = 0.379 (calculated from elastic
parameters of Table 1), and compares it to the number of detected P wave phases as a function of the backazimuth and incidence angles observed from station 6.2. The detected P wave phases correspond to the events of dataset 4. The number of detected P wave phases increases with decreasing incidence angles as consistent with the RP values of both ds models (Fig. 14a,c). The number of P wave detections and RP
3 4 5 6 7 8 9 10 11 12 13 14 15 16 17 18 19 20 21 22 23 24 25 26 27 28 29 30 31 32 33 34 35 36 37 38 39 40 41 42 43 44 45 46 47 48 49 50 51 52 53 54 55 56 57 58 59
values correlate also well as function of backazimuth angle when using the ds mechanisms striking NW-SE, but are anti-correlated for the NE-SW ds model (Fig. 14b,d). Effects from attenuation or spatially confined zones of seismicity can widely explain the correlation with incidence angles, but are rather unlikely to produce the obvious correlation with backazimuth angles. Hence, these results demonstrates that the NW-SE striking ds mechanism controls the number of detected P wave phases at the considered station as a function of backazimuth and incidence angle, what in turn supports the hypothesis of source mechanisms consistency for the microseismic events. The anti-correlated pattern observed for the NE-SW
ds model further supports our preference to the NW-SE ds model.
These results highlight that the detection capability of single sensors, and consequently of a seismic network, can be significantly affected by the source mechanisms. This observation might be of significant relevance for methods used to assess the performance of (micro)seismic monitoring networks but also to evaluate the quality and representativeness of seismic catalogs. The analysis of seismic catalogues are often based on determining the magnitude of completeness (MC), which is the lowest magnitude at which
100% of the events in a space-time volume are detected (e.g. Rydelek & Sacks 1989; Woessner & Wiemer 2005). Usually the most important parameters for MC seem to be event-receiver distance and
event magnitude (e.g. Schorlemmer & Woessner 2008). The simplified model may not always hold, since the detection probability may additionally depend on the direction of incoming wave, mostly depending on the cavity geometry and structural heterogeneities (Plenkers et al. 2011; Maghsoudi et al. 2013). However, few studies (e.g. Stabile et al. 2013) have considered the influence of source radiation pattern so far. Our results support the notion that radiation pattern may in some cases significantly impact detection performance, and that MC may depend on faulting style and source-receiver geometry.
5. DISCUSSION
We demonstrated that the microseismic events recorded in 2008 have similar source mechanisms. The results of the two independent inversion approaches (Fig. 8 and 12) are remarkably consistent and indicate dominant ds faulting with dips ranging from 35° to 55° and slip directions (rake) from 80° - 100°,
3 4 5 6 7 8 9 10 11 12 13 14 15 16 17 18 19 20 21 22 23 24 25 26 27 28 29 30 31 32 33 34 35 36 37 38 39 40 41 42 43 44 45 46 47 48 49 50 51 52 53 54 55 56 57 58 59
while two dominant strike directions trending NE-SW and NW-SE exists. P/SV and SH/SV amplitude ratios (Fig. 7), the results of inversion 2 (Fig. 12) and the number of detected P wave phases as a function of backazimuth (Fig. 14) suggested a preference to the NW-SE (± 20°) striking ds model, which explains the amplitude ratios for ~80% of dataset 3, and thus 53% of the entire event catalogue recorded in 2008. The hypothesis that the entire 2008 microseismic data set is dominated by thrust faulting implies that the minimal principal stress is vertically oriented (σ3 = SV). The dominance of thrust faulting above
underground openings is not new and was frequently observed in shallow mines (e.g. Horner & Hasegawa 1978), but also in fluid-filled underground cavities at larger depth (~ 2000 m). For instance, Godano et al. (2012) found evidence for thrust faulting induced from solution mining in the Arkema-Vauvert salt field (France), which occurred mostly along pre-existing fault structures. In addition, Bardainne et al. (2008) documented dominant thrust faulting above a gas filled anticline structure in the Lacq gas field (France).
In contrast, the role of NW-SE oriented thrust faulting at Cerville is not clear. Even though we cannot fully resolve the orientation, we suggest that the observed consistent thrust fault orientation results from the presence of pre-existing fault structures at the study site (Fig. 15). A regional tectonic map (Fig. 15a) shows two major families of fault structures, oriented NW-SE (green lines) and NE-SW (reddish lines), consistent with the orientation of our two ds fault models, with the NW-SE fault family dominating in the study region, consistent with our preferred NW-SE oriented ds fault model. In addition, one local fault segment, oriented NW-SE, has been reported about 1 km SE from the Cerville cavity structure (Xavier Daupley, personal communication). We suggest that the vertical-to-horizontal differential stress before the exploitation start at Cerville was probably very small (Byerlee law), which was then significantly increased by the creation of the salt cavity, activating pre-existing fault structure (Fig. 15b-c). Thus, the dominant compressive stress is horizontal compression, whose main axis depends more on the structure of the cavity than on the orientation of the pre-cavity stresses. In other words, the activated fault structures seem to be due to the inherited structures and the growth of the cavity rather than to the present regional stress field.
3 4 5 6 7 8 9 10 11 12 13 14 15 16 17 18 19 20 21 22 23 24 25 26 27 28 29 30 31 32 33 34 35 36 37 38 39 40 41 42 43 44 45 46 47 48 49 50 51 52 53 54 55 56 57 58 59
The dominance of the NW-SE striking ds model thus might indicate that either the NW-SE fault population dominates at the study site or the cavity generates a strongly NE-SW directed horizontal stress field. However, considering the complex 3-D shape of the fluid filled cavity, which is significantly evolving with time (Kinscher et al. 2015), it seems unlikely that the cavity geometry alone can produce a distinct alignment of the local maximal compressive stress SH in agreement with one or both observed ds
fault models. Consequently, we suggest that the distribution of pre-existing structures is the determining factor of predominantly NW-SE oriented thrust faulting.
6. CONCLUSION
We analyzed the source mechanisms of microseismic swarms at the Cerville-Buissoncourt study site and presented innovative approaches to overcome difficulties in source analysis arising from event waveforms overlapping in swarms, high frequency geophone recordings of weak events, and a limited network station coverage.
Source mechanisms were investigated in three steps. First, distinct trends in observed waveform amplitude ratios were discussed and compared to synthetics. The results showed that the mechanisms for at least 50 % of the detected events can be approximated by a ds DC source model. Second a DC constrained moment tensor inversion was performed through modelling of amplitude spectra for one well located event. Third, we introduced a new method to investigate the common source mechanisms of swarm events, using peak-to-peak amplitude ratios observed from only one single three component station. Under the hypothesis that focal mechanisms are very similar, we show that the inverse problem is equivalent to a single event with multiple recordings. This approach may be useful for future source studies of local seismic swarms and clusters.
The three procedures provide independent results that are consistent with a stable source mechanism for most microseismic events. The mechanism is dominated by a thrust faulting regime with faults oriented NW-SE, and dipping around 35-55°, likely related to a preferential orientation of pre-existing fault
3 4 5 6 7 8 9 10 11 12 13 14 15 16 17 18 19 20 21 22 23 24 25 26 27 28 29 30 31 32 33 34 35 36 37 38 39 40 41 42 43 44 45 46 47 48 49 50 51 52 53 54 55 56 57 58 59
structures. As an interesting by-product, we show that the source radiation pattern significantly controls the detection capability of a seismic station.
ACKNOWLEDGEMENTS
This work was undertaken with the financial support of the French Ministry of Mines, the Lorraine Region, and the French Ministry of Environment. S.C. was funded by the German BMBF MINE project (Grant of project BMBF03G0737A). We thank Solvay for cooperation and making available the technical and human resources involved. The authors also thank their GISOS partners for their collaboration. For many processing and imaging steps, the Kiwi tools (Heimann 2011; Heimann et al. 2014) and the OBSPY tools (Beyreuther et al. 2010) were used. Radiation pattern imaging was done by means of the Matlab codes provided by Kwiatek & Ben-Zion (2013) and SEIZMO (http: //epsc.wustl.edu/~ggeuler/codes/m/seizmo/).
REFERENCES
Aki, K., 1967. Scaling law of seismic spectrum, Journal of Geophysical Research, 72(4), 1217-1231.
Andre, G., 2003. Characterisation of the meso-cenozoic deformations and fluid circulations in the eastern Paris basin, Applied geology. Universite Henri Poincare - Nancy I, 2003. French., Nancy, France.
Bardainne, T., Dubos-Sallee, N., Senechal, G., Gaillot, P., & Perroud, H., 2008. Analysis of the induced seismicity of the Lacq gas field (southwestern France) and model of deformation, Geophysical Journal International, 172(3), 1151-1162.
Beyreuther, M., Barsch, R., Krischer, L., Megies, T., Behr, Y., & Wassermann, J., 2010. Obspy: A python toolbox for seismology, Seismological Research Letters, 81(3), 530-533.
3 4 5 6 7 8 9 10 11 12 13 14 15 16 17 18 19 20 21 22 23 24 25 26 27 28 29 30 31 32 33 34 35 36 37 38 39 40 41 42 43 44 45 46 47 48 49 50 51 52 53 54 55 56 57 58 59
Boore, D. M. & Boatwright, J., 1984. Average body-wave radiation coefficients, Bulletin of the Seismological Society of America, 74(5), 1615-1621.
Brune, J. N., 1970. Tectonic stress and the spectra of seismic shear waves from earthquakes, Journal of Geophysical Research, 75(26), 4997-5009.
Cesca, S., Buforn, E., & Dahm, T., 2006. Moment tensor inversion of shallow earthquakes in Spain, Geophysical Journal Itnernational. 166, 839-854.
Contrucci, I., Klein, E., Bigarré, P., Lizeur, A., Lomax, A. & Bennani, M., 2010. Management of Post-mining Large-scale Ground Failures: Blast Swarms Field Experiment for Calibration of Permanent Microseismic Early-warning Systems. Pure and applied Geophysics, 167, 43-62.
Contrucci, I., Klein, E., Cao, N., Daupley, X., & Bigarré, P., 2011. Multi-parameter monitoring of a solution mining cavern collapse: First insight of precursors, Comptes Rendus Geoscience, 343(1), 1-10.
Cornet, F. H. & Rockel, T., 2012. Vertical stress profiles and the significance of stress decoupling, Tectonophysics, 581, 193-205.
Couffin, S., Bigarré, P., Bennani, M. & Josien, J.P., 2003. Permanent real time microseismic monitoring of abandoned mines for public safety. in Field Measurements. In Geomechanics eds Frank, M. & Francis, T., Oslo, Norway, pp. 437-444.
Dahm, T., & Krüger, F., 1999. Higher-degree moment tensor inversion using far-field broad-band recordings: theory and evaluation of the method with application to the 1994 Bolivia deep earthquake. Geophysical Journal International 137, 35–50.
3 4 5 6 7 8 9 10 11 12 13 14 15 16 17 18 19 20 21 22 23 24 25 26 27 28 29 30 31 32 33 34 35 36 37 38 39 40 41 42 43 44 45 46 47 48 49 50 51 52 53 54 55 56 57 58 59
Dahm, T., Manthei, G., & Eisenblatter, J., 1999. Automated moment tensor inversion to estimate source mechanisms of hydraulically induced micro-seismicity in salt rock, Tectonophysics, 306(1), 1-17.
Daupley, X., Cuche, H., Ghoreychi, M., 2005. Typology of strata movement related to old solution mining of salt at Sarralbe (Lorraine, France), in Proceedings of the symposium Post mining 2005.
Didier, C., 2008. The french experience of post-mining management, in Symposium Post-Mining 2008. Feb 2008, Nancy, France.
Domingues A., Custodio, S., & Cesca, S., 2013. Waveform Inversion of Small to Moderate Earthquakes Located Offshore Southwest Iberia, Geophysical Journal International. 192, 248-259.
Eisner, L., Thornton, M., Griffin, J., et al., 2011. Challenges for microseismic monitoring, in 2011 SEG Annual Meeting, Society of Exploration Geophysicists.
Feustel, A. J., 1998. Seismic attenuation in underground mines : a comparative evaluation of methods and results, Tectonophysics, 289, 31-49.
Godano, M., Bardainne, T., Regnier, M., Deschamps, A., & Valette, M., 2012. Spatial and temporal evolution of a microseismic swarm induced by water injection in the Arkema-Vauvert salt field (southern France), Geophysical Journal International, 188(1), 274-292.
Gunzburger, Y. & Magnenet, V., 2014. Stress inversion and basement-cover stress transmission across weak layers in the Paris basin, France, Tectonophysics, 617, 44-57.
3 4 5 6 7 8 9 10 11 12 13 14 15 16 17 18 19 20 21 22 23 24 25 26 27 28 29 30 31 32 33 34 35 36 37 38 39 40 41 42 43 44 45 46 47 48 49 50 51 52 53 54 55 56 57 58 59
Hardebeck, J. L., & Shearer, P. M., 2003. Using S/P amplitude ratios to constrain the focal mechanisms of small earthquakes. Bulletin of the Seismological Society of America. 93, 2434-2444.
Heidbach, O., Tingay, M., Barth, A., Reinecker, J., Kurfess, D., & Muller, B., 2010. Global crustal stress pattern based on the world stress map database release 2008, Tectonophysics, 482(1), 3-15.
Heimann, S., 2011. A robust method to estimate kinematic earthquake source parameters, Ph.D. thesis, Department of Geoscience, University Hamburg, Germany.
Heimann, S., Cesca, S., Kriegerowski, M., & Dahm, T., 2014. Synthetic seismogram web service and python tools, in EGU General Assembly Conference Abstracts, vol. 16, p. 10466.
Horner, R. & Hasegawa, H., 1978. The seismotectonics of southern Saskatchewan, Canadian Journal of Earth Sciences, 15(8), 1341-1355.
Jousset, P. & Rohmer, J., 2012. Evidence for remotely triggered microearthquakes during salt cavern collapse. Geophysical Journal International, 191, 207-223.
Julian, B. R., & G. R. Foulger, 1996. Earthquake mechanisms from linear-programming inversion of seismic-wave amplitude ratios. Bulletin of the Seismological Society of America. 86, 972–980.
Kinscher, J., 2015. The analysis and interpretation of microseismicity induced by a collapsing solution mining cavity. A contribution for progress in hazard assessment of underground cavities, Ph.D. thesis, Universite Lorraine, Nancy, France.
3 4 5 6 7 8 9 10 11 12 13 14 15 16 17 18 19 20 21 22 23 24 25 26 27 28 29 30 31 32 33 34 35 36 37 38 39 40 41 42 43 44 45 46 47 48 49 50 51 52 53 54 55 56 57 58 59
Kinscher, J., Bernard, P., Contrucci, I., Mangeney, A., Piguet, J., & Bigarré, P., 2015. Location of microseismic swarms induced by salt solution mining, Geophysical Journal International, 200, 337-362.
Kisslinger, C., 1980. Evaluation of S to P amplitude ratios for determining focal mechanisms from regional network observations. Bulletin of the Seismological Society of America. 70, 999–1014.
Klein, E., Contrucci, I., Daupley, X., Hernandez, O., Bigarr_e, P., Nadim, C., & Cauvin, L., 2008. Experimental monitoring of a solution-mining cavern in salt: Identifying and analyzing early-warning signals prior to collapse, in SMRI Fall Technical Conference, Galveston (Austin), Texas, USA, pp. 135-146.
Kosecki, A., Piwakowski, B., & Driad-Lebeau, L., 2010. High resolution seismic investigations in salt mining context, Acta Geophysica, 58(1), 15-33.
Kwiatek, G. & Ben-Zion, Y., 2013. Assessment of p and s wave energy radiated from very small shear-tensile seismic events in a deep south african mine, Journal of Geophysical Research: Solid Earth, 118(7), 3630{3641.
Lebert, F., Bernardie, S. & Mainsant, G., 2011. Hydroacoustic monitoring of a salt cavity: an analysis of precursory events of the collapse, Natural Hazards and Earth System Sciences, 11(9).
Maghsoudi, S., S. Cesca, S. Hainzl, D. Kaiser, D. Becker, & T. Dahm, 2013. Improving the estimation of detection probability and magnitude of completeness in strongly heterogeneous media, an application to AE emission, Geophysical Journal International., 193, 3, 1556-1569.
3 4 5 6 7 8 9 10 11 12 13 14 15 16 17 18 19 20 21 22 23 24 25 26 27 28 29 30 31 32 33 34 35 36 37 38 39 40 41 42 43 44 45 46 47 48 49 50 51 52 53 54 55 56 57 58 59
Malovichko, D., Kadebskaya, O., Shulakov, D. Y., & Butyrin, P., 2010. Local seismologic observations of karst processes, Izvestiya, Physics of the Solid Earth, 46(1), 57-73.
Mercerat, E., 2007. Sismicite induite et modelisation numerique de l’endommagement dans un context salin, Ph.D. thesis, LAEGO, Institut National Polytechnique de Lorraine, France.
Mercerat, E., Driad-Lebeau, L., & Bernard, P., 2010. Induced seismicity monitoring of an underground salt cavern prone to collapse, Pure and Applied Geophysics, 167(1), 5-25.
Plenkers, K., Schorlemmer, D. & Kwiatek, G. the JAGURAS Group, 2011. On the probability of detecting Picoseismicity, Bulletin of the Seismological Society of America, 101, 2539–2591.
Plesinger, A., Hellweg, M. & Seidl, D., 1986. Interactive high-resolution polarization analysis of broadband seismograms. J. Geophysics, 59, 129-139.
Rau, R.-J., F. T. Wu, & T.-C. Shin (1996). Regional network focal mechanism determination using 3D velocity model and SH/P amplitude ratio. Bulletin of the Seismological Society of America. 86, 1270– 1283.
Rydelek, P. & Sacks, I., 1989. Testing the completeness of earthquake catalogues and the hypothesis of self-similarity, Nature, 337(6204), 251-253.
Schaff, D. P. & Waldhauser, F., 2005. Waveform cross-correlation-based differential travel-time measurements at the Northern California Seismic Network. Bulletin of the Seismological Society of America, 95, 2446-2461. 3 4 5 6 7 8 9 10 11 12 13 14 15 16 17 18 19 20 21 22 23 24 25 26 27 28 29 30 31 32 33 34 35 36 37 38 39 40 41 42 43 44 45 46 47 48 49 50 51 52 53 54 55 56 57 58 59
Schorlemmer, D. & Woessner, J., 2008. Probability of detecting an earthquake Bulletin of the Seismological Society of America, 98, 2103–2117.
Sen, A. T., Cesca, S., Bischo_, M., Meier, T., & Dahm, T., 2013. Automated full moment tensor inversion of coal mining-induced seismicity, Geophysical Journal International, pp. 1267-1281.
Souley, M., Mercerat, D., Driad-Lebeau, L., Bernard, P., et al., 2008. A large scale continuum discrete numerical modelling: Application to overburden damage of a salt cavern, in Post-Mining 2008. Symposium Proceedings.
Stabile, T., Iannaccone, G., Zollo, A., Lomax, A., Ferulano, M., Vetri, M., & Barzaghi, L., 2013. A comprehensive approach for evaluating network performance in surface and borehole seismic monitoring, Geophysical Journal International, 192, 793-806.
Vavrycuk, V., 2001. Inversion for parameters of tensile earthquakes, Journal of Geophysical Research: Solid Earth, 106, 16339-16355.
Walter, W. R. & Brune, J. N., 1993. Spectra of seismic radiation from a tensile crack, Journal of Geophysical Research: Solid Earth. 98(B3), 4449-4459.
Wang, R., 1999. A simple orthonormalization method for stable and efficient computation of Green's functions, Bulletin of the Seismological Society of America, 89(3), 733-741.
Wileveau, Y., Cornet, F., Desroches, J., & Blumling, P., 2007. Complete in situ stress determination in an argillite sedimentary formation, Physics and Chemistry of the Earth, 32(8), 866-878.
3 4 5 6 7 8 9 10 11 12 13 14 15 16 17 18 19 20 21 22 23 24 25 26 27 28 29 30 31 32 33 34 35 36 37 38 39 40 41 42 43 44 45 46 47 48 49 50 51 52 53 54 55 56 57 58 59
Woessner, J. & Wiemer, S., 2005. Assessing the quality of earthquake catalogues: Estimating the magnitude of completeness and its uncertainty, Bulletin of the Seismological Society of America, 95, 684-698.
Wust-Bloch, G. H. & Joswig, M., 2006. Pre-collapse identification of sinkholes in unconsolidated media at Dead Sea area by nanoseismic monitoring (graphical jackknife location of weak sources by few, low-SNR records), Geophysical Journal International, 167(3), 1220-1232.
3 4 5 6 7 8 9 10 11 12 13 14 15 16 17 18 19 20 21 22 23 24 25 26 27 28 29 30 31 32 33 34 35 36 37 38 39 40 41 42 43 44 45 46 47 48 49 50 51 52 53 54 55 56 57 58 59