Thermal design power and vectorized instructions behavior
Texte intégral
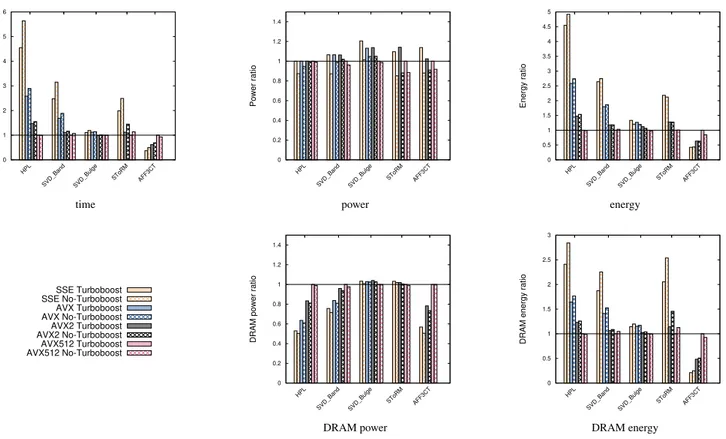
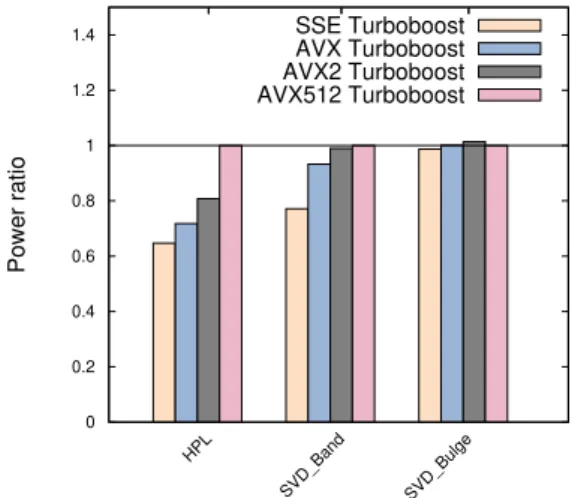
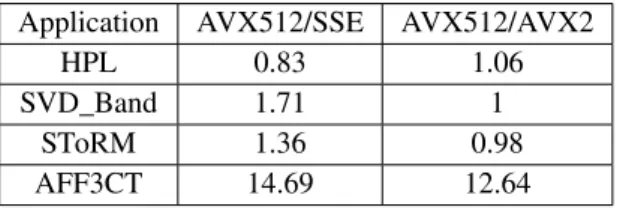
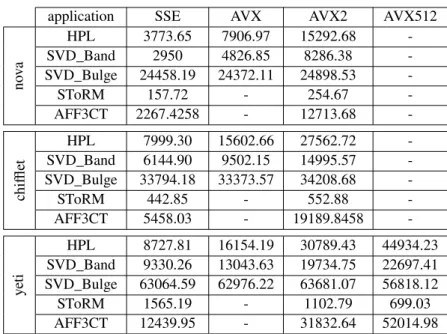
Figure


Documents relatifs
From the empirical results and the simulation experiments, we draw the conclusion that the proposed portmanteau test based on squared residuals of an APGARCH(p, q) (when the power
In this article, we have used FEM to numerically study the influence of damage mechanisms (local plasticity and wire failures) of the submarine power phase conductor on the
Avec VI planches. Mémoire publié à l'occasion du Jubilé de l'Université. Mémoire publié à l'occasion du Jubilé de l'Université.. On constate l'emploi régulier
[7] consider dynamic voltage and frequency scaling for the SCC and implement a hierarchical power management with phase prediction to minimize energy con- sumption, balancing
ثلاثلا لصفلا " : ( ةيقيبطت عوضوملا ةسارد ) ليكأت نم قبسي اميف فأشلا وى امك ركرّٓا لصتبؼا تَمضلا ىلع فطعت لا برعلا فوك بُ اهيلإ تايلآا. نابسانم
Comparaison de la mécanique de marche sur tapis roulant et en mode écologique chez des enfants hémiplégiques par paralysie cérébrale..
In the event of a three or four fold scintillation counter coincidence the direction of the shower could be determined from measurements of the differences in the
Further stud- ies showed that the measured room response for the fixed microphone and source position varied with the phase rela- tionship between the periodic motion of the
