Publisher’s version / Version de l'éditeur:
Vous avez des questions? Nous pouvons vous aider. Pour communiquer directement avec un auteur, consultez la première page de la revue dans laquelle son article a été publié afin de trouver ses coordonnées. Si vous n’arrivez pas à les repérer, communiquez avec nous à [email protected].
Questions? Contact the NRC Publications Archive team at
[email protected]. If you wish to email the authors directly, please see the first page of the publication for their contact information.
https://publications-cnrc.canada.ca/fra/droits
L’accès à ce site Web et l’utilisation de son contenu sont assujettis aux conditions présentées dans le site
LISEZ CES CONDITIONS ATTENTIVEMENT AVANT D’UTILISER CE SITE WEB.
Journal of the Acoustical Society of America, 77, March 3, pp. 1252-1256,
1985-03
READ THESE TERMS AND CONDITIONS CAREFULLY BEFORE USING THIS WEBSITE.
https://nrc-publications.canada.ca/eng/copyright
NRC Publications Archive Record / Notice des Archives des publications du CNRC :
https://nrc-publications.canada.ca/eng/view/object/?id=26e51f36-04d3-4dd7-bb7e-c3c23baa131d https://publications-cnrc.canada.ca/fra/voir/objet/?id=26e51f36-04d3-4dd7-bb7e-c3c23baa131d
NRC Publications Archive
Archives des publications du CNRC
This publication could be one of several versions: author’s original, accepted manuscript or the publisher’s version. / La version de cette publication peut être l’une des suivantes : la version prépublication de l’auteur, la version acceptée du manuscrit ou la version de l’éditeur.
Access and use of this website and the material on it are subject to the Terms and Conditions set forth at
Room response measurements in a reverberation chamber containing
a rotating diffuser
N21d
ne. 1278
I+
National Research
Conseil national
C. 2
Council Canada
de recherches Canada
BLDG
IROOM RESPONSE MEASUREMENTS I N A REVERBERATION CHAMBER CONTAINING A ROTATING DIFFUSER
by W.T. Chu
A N A L Y Z E D
Reprinted from
L I a R A R Y
Journal of the Acoustical Society of America i
Vol. 77, No. 3, March 1985 I I
p. 1252
-
125685-
06-
0 7
i
t
DBR Paper No. 1278
Division of Building Research
-
I
I
I
R ~ S U M ~
Ltapplication de sequences periodiques pseudo-aldatoires 21 la
mesure du comportement dtune piece a Qt6 Qtendue aux pieces
dotQes dtun diffuseur rotatif.
Les rhultats obtenus avec
cette nouvelle technique correspondent assez bien 2 ceux
obtenus par la methode de balayage
3
fr6quence unique.
Pourtant, la nouvelle methode ntexige qutune fraction du temps
requis par ltancienne
pour rkaliser le mgme travail.
- - -.. - - ,L
IIII!~III
1 8 9 0 2IIIII[I~[~II~~I~I
88II
11
11111
- - - >Room response measurements in a reverberation chamber
containing a rotating diffuser
W . T. Chu
National Research Council of Canada, Divison of Building Research, Ottawa, Ontario, Canada KIA OR6
(Received 27 July 1984; accepted for publication 26 November 1984)
The application of periodic pseudorandom sequences for room response measurements has been extended to chambers containing one rotating diffuser. Results obtained by the new technique compare very well with those measured by the single frequency sweep method. Yet it takes only a
-
small fraction of the time required by the latter method to accomplish the same task.PACS numbers: 43.55.Br, 43.85.Fm, 43.55.Nd
INTRODUCTION pure-tone or narrow-band sound power measurements.'
Conventional single frequency sweep method is very time Accurate determinations of room responses in rever- consuming and new techniques should be developed. beration chambers are required for the qualification test of In an earlier paper,2 it was shown how a periodic pseu- 1252 J. Acoust. Soc. Am. 77(3), March 1985;OOOl-4966/85/031252-05$00.80; @ 1985 Acoust. Soc. Am.; Letters to the Editor 1252
dora ndom sec Iso name
..
..
.
lgth se-quence (a d a maximum-1e1 quence) can be used eftectively as a mulitone source in a chamber with fixed geometry. The new technique can shor- ten the testing time by more than one order of magnitude.
In this paper, the extension of this technique to rooms ~ p e d with one rotating diffuser is discusssed. To ap- imate such a room as a time invariant system, it is neces-
.
to match the period of the sequence with that of the rotating diffuser and perform all analyses over exactly one period. The different frequency components of a room re-I sponse can be determined by the fast Fourier transform
(FFT) technique. However, measurements showed that the I
room response varied with the phase relationship between the periodic motion of the rotating diffuser and the period of the sequence. Thus, some ensemble averaging is necessary. Very good agreement has been obtained between this new technique and the single frequency sweep method. Yet the new technique takes a much shorter time to achieve the same results.
I. SINGLE FREQUENCY SWEEP METHOD
Measurements were taken for one fixed microphone and source position in a rectangular model reverberation chamber with dimensions 3.2 X 2.6 X 1.96 m. The room is equipped with both fixed diffusers and a rotating diffuser. The latter consists of a 0.76
x
0.9 1 m wooden panel mounted at about 45" inclination on a rotating shaft in the middle of the room; it rotates at about 15 rpm.The room was excited with pure tones generated by a stable frequency synthesizer (HP 3325A) fed through a pow- er amplifier to a speaker placed at a fixed position on the floor of the room. Two hundred frequencies were used start- ing from 400 Hz with an increment of 1 Hz. At each frequen- cy, the sound pressure at one chosen location in the reverber- ant sound field about half a meter from the rotating diffuser
1
1
R U R U N N o . N N 2 O1
F R E Q U E N C Y , H z
FIG. 1. Repeated measurements of room responses in the 400-600 Hz range
by the single frequency sweep method.
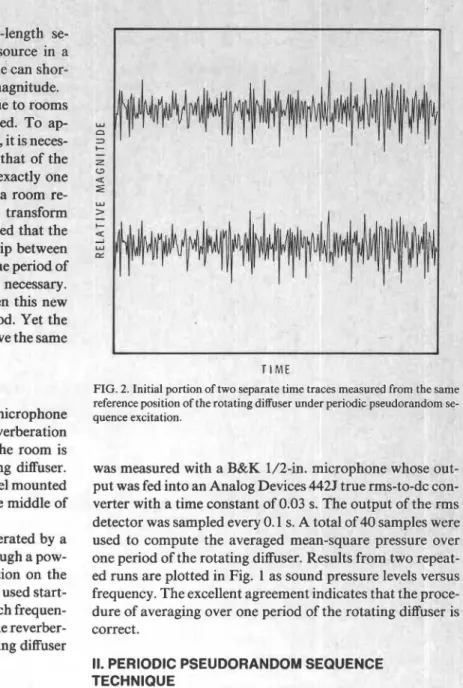
FIG. 2. Initial portion of two separate time traces measurea rrom n
reference position of the rotating diffuser under periodic pseudoranc quence excitation.
le same ~ ----
dom se- ,
was measured with a B&K 1/2-in. microphone whos put was fed into an Analog Devices 4425 true rms-to-d
verter with a time constant of 0.03 s. The output of t t - _ . _ _
detector was sampled every 0.1 s. A total of 40 samples were used to compute the averaged mean-square pressure over one period of the rotating diffuser. Results from two repeat- ed runs are plotted in Fig. 1 as sound pressure levels versus frequency. The excellent agreement indicates that the proce- dure of averaging over one period of the rotating diffuser is correct.
II. PERIODIC PSEUDORANDOM SEQUENCE TECHNIQUE
e out- c con-
Le rms
For comparison purposes, the room response at the same microphone location was measured under identical conditions. The instrumentation setup is similar to that used in Ref. 2. Since it has been established that the spectrum of the source signal is flat,2 it is only necessary to compute the microphone output spectrum rather than the transfer func- tion.
Matching the period of the sequence with that of the rotating diffuser is important. To measure the period of the rotating diffuser accurately, a small rod, attached to the shaft of the rotating diffuser, interrupted the beam of a light sensor once every revolution. The output from the light sen- sor was used to trigger a frequency counter. The same signal was also used as a trigger for the A to D converter-so that data could be obtained from the same reference position of the rotating diffuser.
In order to meet the requirements imposed by the matching of periods and the frequency range of interest, the length of the sequence L was chosen to be (2'' - 1) and a clock frequency of 32 998 Hz was used. The sampling fre- quency was 1/16 of the clock frequency as used in the pre- vious paper. For this case, the total number of data points
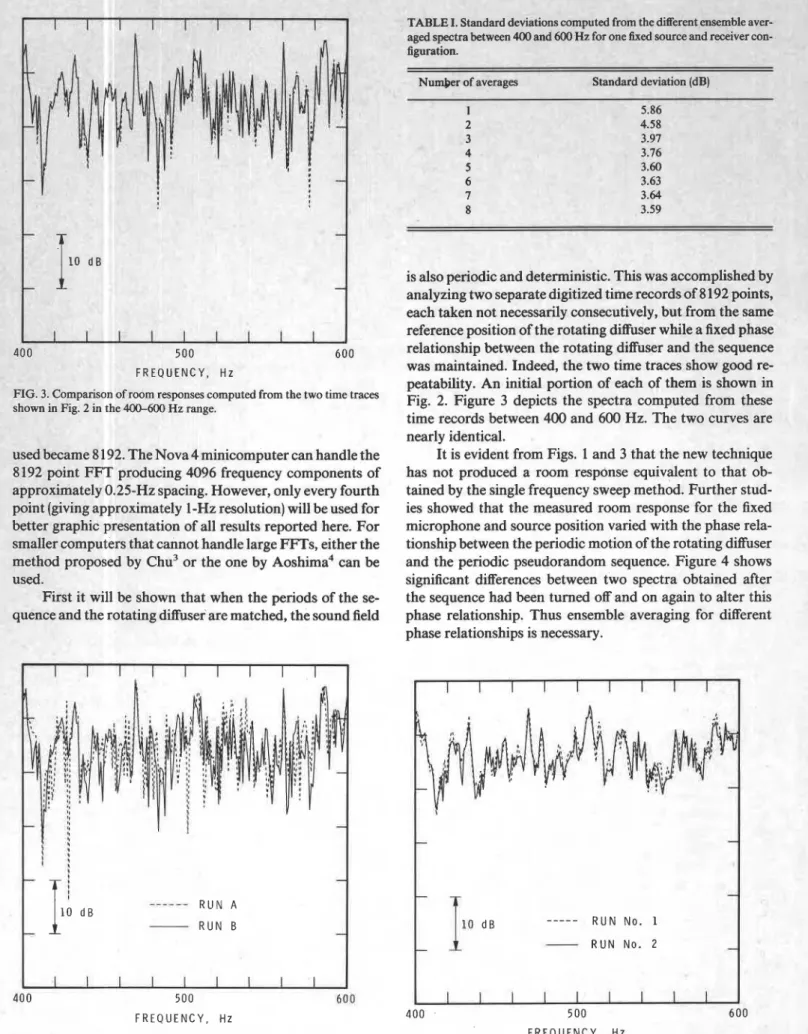
400 500 600
r n E Q U E N C Y , H Z
FIG. 3. Comparison of room responses computed from the two time traces shown in Fig. 2 in the 400-600 Hz range.
used became 8 192. The Nova 4 minicomputer can handle the 8 192 point FFT producing 4096 frequency components of approximately 0.25-Hz spacing. However, only every fourth point (giving approximately 1-Hz resolution) will be used for better graphic presentation of all results reported here. For smaller computers that cannot handle large FFTs, either the method proposed by Chu3 or the one by Aoshima4 can be used.
First it will be shown that when the periods of the se- quence and the rotating diffuser are matched, the sound field
TABL
aged sl
figural
,E I. Standard deviations comvuted from the different ensemble aver-, x n 400 and
is also periodic and deterministic. This was accomplished by analyzing two separate digitized time records of 8 192 points, each taken not necessarily consecutively, but from the same reference position of the rotating diffuser while a fixed phase relationship between the rotating diffuser and the sequence was maintained. Indeed, the two time traces show good re- peatability. An initial portion of each of them is shown in Fig. 2. Figure 3 depicts the spectra computed from these time records between 400 and 600 Hz. The two curves are nearly identical.
It is evident from Figs. 1 and 3 that the new technique has not produced a room response equivalent to that ob- tained by the single frequency sweep method. Further stud- ies showed that the measured room response for the fixed microphone and source position varied with the phase rela- tionship between the periodic motion of the rotating diffuser and the periodic pseudorandom sequence. Figure 4 shows significant differences between two spectra obtained after the sequence had been turned off and on again to alter this phase relationship. Thus ensemble averaging for different phase relationships is necessary.
-
R U N No. 2F R E Q U E N C Y . H z 400
FIG. 4. Comparison of room responses obtained under different phase rela- F R E Q U E N C Y . H z
tionships between the periodic motion of the rotating diffuser and the peri- FIG. 5. Repeated measurements of the averaged room response in the 400- odic pseudorandom sequence in the 400-600 Hz range. 600 Hz range obtained under periodic pseudorandom sequence excitation.
t
'O - - t tKtYUtNLY b W t t Y - - - MAXIMUM-LENGTH SEQUENCEi
I I , A.-
SINGLE FREQUENCY-..-,.
- - - MAXIMUM-LENGTH SEQUENCE 1 1 I ,I
400 500 600 500 5 80 FREQUENCY, Hz FREQUENCY. H :FIG. 6 . Comparison of room responses in the 400600 Hz range obtained by FIG. 7. Comparison of room responses in the
two different methods. two different methods in a full scale reverbel
The number of ensemble averages required was deter- mined by comparing the standard deviations computed from the different averaged responses between 400 and 600 Hz. Table I indicates that the standard deviations varied from 5.86 dB for a single observation to a final value of 3.60 dB after six or more ensemble averages. At least for the present room condition and the frequency range of interest, it seems that six to eight averages are adequate, but eight were used for the results presented here. Figure 5 shows that the aver- aged room response is quite repeatable. This also compares well with the response obtained by the single frequency sweep method, as depicted in Fig. 6. The standard deviation of the single frequency sweep curve is 3.30 dB.
Ill. DISCUSSION
A single measurement of the room response using the periodic pseudorandom sequence showed no effect of the rotating diffuser. The measured standard deviation was 5.86 dB, which seems to correspond to the value of 5.57 dB for no rotating diffuser. A possible explanation can be presented based on the modulation theory5p6 of a rotating diffuser.
In the single frequency sweep method, each frequency point of the measured response function is effectively an average over several frequency components, due to the mo- dulation effect of the rotating diffuser and the way the mean- square values are obtained by including the contributions from all the sidebands. No such summation or averaging exists, however, in the case of the pseudorandom sequence excitation, where the response function was obtained by the FFT procedure. In addition, the redistribution of energy of any frequency into sidebands might be different because the sideband frequencies coincide with the existing driving fre- quencies of the pseudorandom noise source.
500-660 H ration cham
-
' ZWFFP !range obtai ber. side-----.
Since the number and relative ies oithe bands cannot be predicted for each fleyue~lc;y, it is not 1
ble to perform any frequency averaging of the measurc sponse function. Other averaging techniques must be uc reveal the effect of the rotating diffuser. The ensemble aging chosen for the present investigation works well rotating diffuser with a relatively low figure of merit (i
1.5 in the 400-600 Hz range). For a more effective rot,,..-, diffuser, the number of ensemble averages required sl be increased.
Further experiments carried out in a full scale revc ation chamber of 255 m3 equipped with a larger roi diffuser (see Ref. 7 for detailed description) confirme validity of the present technique. As shown in Fig. '
averaged response curve compared reasonably well witn r n n r
obtained by the single frequency sweep method. Fo case, 40 ensemble averages were required to bring the dard deviation to its final value of 1.35 dB. The fig^,,
,.
merit of this diffuser is about 4.1 in the 500-600 Hz range. The corresponding value for the single frequency sweep curve is 1.24 dB. Juaal- :d re- sed to aver- - . -- for a xbout - * t i n o tating :d the 7, the I .l
.
--
-
r this stan- 1rP nf IV. CONCLUSIONIt has been demonstrated that the periodic pseudoran- dom sequence can also be used as a multitone source for rooms equipped with a rotating diffuser. Ensemble averag- ing is required, however, to eliminate variations caused by the phase relationship between the periodic motion of the rotating diffuser and the sequence. The new technique signif- icantly reduces the testing time compared to the single fre- quency sweep method. Coupled with the nearfield and far- field transfer function technique as suggested by Chu," future qualification tests for sound power measurements can be performed more efficiently.
:KNOWLEDGMEh I a
This paper is a contribution of the Division of Building :search National Research: Council of Canada, and is pub- hed with the approval of the Director of the Di-li~inn
ational Stan rer Levels o
unerican N, dard Precision Methods for the D, n
Sound Poa f Discrete-Frequency and Narrow e
urces in Reverberation Rooms," ANSI S1.32-1980.
. T. Chu, "Architectural Acoustic Measurements Using Periodic Pseu-
-Random Sc d FFT," J. Acoust. Soc. Am. 76,475478 (1984).
I . Lnu, A I ecnnlque for Zoom Transform and Long-TUG olgruu
Analysis," Can. Acoust. 11 (3) (1983).
4N. Aoshima, "New Method of Measuring Reverberation Time by Fourier Transforms," J. Acoust. Soc. Am. 67, 1816-1817 (1980).
'D. Lubman, "Spatial Averaging in Sound Power Measurements," J. Sound
Vib. 16,4348 (1971).
6J. Tichy and P. K. Baade, "Effect of Rotating Diffusers and
Techniques on Sound-Pressure Averaging in Reverberation C h Acoust. Soc. Am. 56, 137-143 (1974).
'W. T. Chu, "Reverberation Room Qualification Studies at the National
Research Council of Canada," National Research Council Canada, Divi- sion of Building Research, BR Note 203, Ottawa (1983).
'W. T. Chu, "Near and Farfield Transfer Function Technique for Rever-
beration Room Response Studies," J. Acoust. Soc. Am. Suppl. 1 72, S18 (1982).
l Sampling mbers." J.
T h i s paper, w h i l e b e i n g d i s t r i b u t e d i n r e p r i n t form by t h e D i v i s i o n of B u i l d i n g R e s e a r c h , remains t h e c o p y r i g h t of t h e o r i g i n a l p u b l i s h e r . It s h o u l d n o t be r e p r o d u c e d i n whole o r i n p a r t w i t h o u t t h e p e r m i s s i o n of t h e p u b l i s h e r . A l i s t of a l l p u b l i c a t i o n s a v a i l a b l e from t h e D i v i s i o n may be o b t a i n e d by w r i t i n g t o t h e P u b l i c a t i o n s S e c t i o n , D i v i s i o n o f B u i l d i n g R e s e a r c h , N a t i o n a l R e s e a r c h C o u n c i l of C a n a d a , O t t a w a , O n t a r i o ,