HAL Id: hal-03171038
https://hal.archives-ouvertes.fr/hal-03171038
Submitted on 16 Mar 2021
HAL is a multi-disciplinary open access
archive for the deposit and dissemination of
sci-entific research documents, whether they are
pub-lished or not. The documents may come from
teaching and research institutions in France or
abroad, or from public or private research centers.
L’archive ouverte pluridisciplinaire HAL, est
destinée au dépôt et à la diffusion de documents
scientifiques de niveau recherche, publiés ou non,
émanant des établissements d’enseignement et de
recherche français ou étrangers, des laboratoires
publics ou privés.
Modelling of impact of presence/absence of suspended
particulate organic matter from river and sea and
effluent wastewater on fluorescence signal in the coastal
area of Gapeau River
Ibrahim El-Nahhal, Roland Redon, Michel Raynaud, Yasser El-Nahhal,
Stéphane Mounier
To cite this version:
Ibrahim El-Nahhal, Roland Redon, Michel Raynaud, Yasser El-Nahhal, Stéphane Mounier. Modelling
of impact of presence/absence of suspended particulate organic matter from river and sea and effluent
wastewater on fluorescence signal in the coastal area of Gapeau River. Environmental Science and
Pollution Research, Springer Verlag, In press, �10.1007/s11356-021-13265-2�. �hal-03171038�
Abstract:
21
Organic matter has an important role in biogeochemistry in aquatic environments. This study investigated impact of
22
suspended particulate organic matter (SPOM) on fluorescence signal of mixtures of three water types (River water
23
RW, Sea water SW, effluent wastewater WW) using three-dimensional excitation emission fluorescence spectroscopy
24
(3D-EEMs) and Parallel factor analysis PARAFAC and multilinear regression. Four irradiation experiments (Exp.1,
25
Exp.2, Exp.3 and Exp.4) were conducted during different times of year ( two in autumn, one in winter and one in
26
spring season). Samples were exposed to natural sunlight on laboratory rooftop in University of Toulon, France, with
27
another set of samples were kept in dark as control samples. Three components (C1,C2, C3) model was validated by
28
split-half and Concordia from the whole EEM dataset of all irradiation experiments. No protein-like fluorophores or
29
PARAFAC components was found. The study revealed the effect of SPOM presence/absence on fluorescence signal
30
of DOM and on resulting parameters of multilinear regression MLR model and kinetic constant of these MLR
param-31
eters. Kinetic constant (k) for all MLR coefficients was in order of greatness as Exp.1 (SPOM of WW only in mixtures
32
) > Exp.3 (SPOM of SW only in mixtures ) > Exp.2 (SPOM of RW only in mixtures )> Exp.4 (All SPOM of RW, SW,
33
WW in mixtures ) indicating that SPOM of WW is the most resistant to photodegradation. For dark control samples,
34
only relative standard deviation RSD could be calculated from dataset. RSD values for C3 were the highest indicating
35
its chaotic variations and the lowest RSD values were found for both C1 and C2 for all experiments. Statistical
differ-36
ences has been found between control and irradiated experiments. These models developed in this study can be used
37
to predict fluorescence signal of anthropogenic effluent DOM during its transport in river systems to coastal zone.
38
Keywords:
39
Suspended Particulate Organic matter SPOM, Fluorescence Spectroscopy, parallel factor analysis PARAFAC
model-40
ing, Solar Irradiation, mixing experiments.
41
Introduction
42
Organic matter in natural waters can be operationally classified and divided into dissolved organic matter (DOM) or
43
suspended particulate organic matter (SPOM) depending on the filtration and filter size (Osburn et al., 2012; Gagné
44
and Tremblay 2009). DOM pool consists of a wide range of organic molecules originating from decaying dead stuff
45
(plants and animals). Such organic molecules could be humic substances (i.e. humic and fulvic acid)or non-humic
46
substances such as proteins, and carbohydrates with varying molecular size and functional groups (Her et al.2003).
47
Whereas, SPOM pool may consist of living microorganisms (e.g. bacteria and viruses), organic/inorganic particles
48
organic polymers among others (Chin et al.1998; Leppard et al. 2011). SPOM in water plays an important role in
49
characterizing the fate of (DOM) in ecosystems. SPOM and DOM are an important constituent in aquatic environments
50
and plays a significant role in the transport, stability and bioavailability of several organic/inorganic pollutants that
51
results from anthropogenic activity (e.g. heavy metals, pesticides and polycyclic aromatic hydrocarbons) (Akkanen et
52
al. 2004; Hirose 2007; Baker et al. 2008; Ishii and Boyer 2012). However, DOM in aquatic ecosystems is considered
53
to be the most important and significant fraction of organic matter due to its involvement in so many environmental
54
processes (Søndergaard and Thomas, 2004)
55
In addition, both of them have a role in global biogeochemical cycling of carbon and nutrients. It is critical for the
56
better understanding of carbon cycle to differentiate sources of DOM in aquatic environment and the factors which
57
play important roles in its sources and sinks like biodegradation and photodegradation (McCallister et al. 2006a,b;
58
Dalzell et al. 2009). More research attention has been given to study the role in environmental photochemistry of
59
DOM than that of SPOM (Mopper et al. 2014). Solar irradiation of (SPOM) may result in production of dissolved
60
nutrients and/or DOM in considerable amounts which may enrich the aquatic system. For instance, previous studies
61
(Liu and Shank 2015; Mayer et al. 2006; Riggsbee et al. 2008; Southwell et al. 2010; Estapa and Mayer 2010; Pisani
62
et al. 2011) investigated the influence of sunlight on POM and found that it undergo similar photochemical reactions
63
as DOM due to absorbance of UV-VIS light which are the same wavelengths that DOM can absorb. Moreover, He et
64
al. (2016) evaluated the effect of SPOM in attenuating the fraction of dissolved organic carbon and revealed that SPOM
65
can reduce the concentration of dissolved organic carbon in water systems through adsorption process. Moreover,
66
influence of SPOM in fluorometry of DOM were investigated by several authors (e.g. Laane and Kramer 1990; De
67
Souza Sierra and Donard 1991; Baker and Spencer 2004; Boyd and Osburn 2004; Callahan et al. 2004; Kowalczuk et
68
al. 2003, 2005; Murphy et al. 2008). Evolution of fluorophores of DOM (i.e. FDOM) is being followed using
spectro-69
fluorometry which is a qualitative and semi-quantitative technique. Spectrofluorometry technique of three-dimensional
70
excitation–emission matrix (EEM) spectroscopy has several advantages for the detection of fluorophores of DOM in
71
aquatic environment because it is fast and non-destructive with no need for sample pre-treatment and is highly sensitive
72
for detection of even-low concentrations of samples which is the case in several aquatic environments. In addition to
73
the fact that type and origin of samples (riverine , marine, wetlands) can be figured out and types and relative
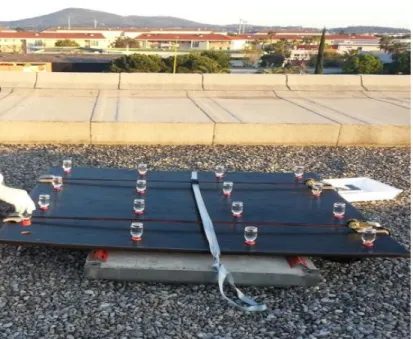
concen-74
trations of fluorophores constituting DOM can also be known using three-dimensional excitation–emission matrix
75
(EEM) spectroscopy.
76
Previous studies (He et al. 2016) investigated the influence of SPOM in light scattering, adsorption of DOM,
attenua-77
tion of dissolved organic carbon and other matters, however the impact of presence/absence of SPOM on fluorescence
78
signal of naturally occurring mixtures is not fully understood. Accordingly, this study was designed to bridge the gap
79
of knowledge in the field of SPOM effect on fluorescence signal of naturally occurring mixtures of river water and
80
effluent wastewater and sea water. Therefore, the research question of this study is that will the presence/absence of
81
particulate matter from one of three water types (river water, seawater, effluent wastewater) affect the modelling and
82
kinetics of degradation of fluorescence signal of different mixtures of these water types after solar irradiation . So far,
83
the objectives of this study are to investigate the effect of presence/absence of SPOM on fluorescence signal of
natu-84
rally occurring mixtures through mixing experiments and to examine the impact of solar photodegradation on mixtures
85
of different types of water (i.e. river water RW, Sea water SW and wastewater effluent WW) by using the technique
86
of three-dimensional fluorescence spectroscopy and parallel factor analysis PARAFAC by developing a multilinear
87
regression model for tracking the effect of SPOM on fluorescence signal of the above mentioned mixtures to simulate
88
naturally occurring mixing in coastal zone which could be used in further work to develop online or real-time
remote-89
sensing monitoring software.
90
Material and methods
91
Study area and Sample Collection
92
Gapeau river, a small coastal river, is situated in Var department in Provence-Alpes-Côte d'Azur region located in
93
Southeastern France and is the second largest river in Var department. It discharges its runoff in Mediterranean Sea at
94
Hyeres City. It is submitted to various anthropogenic inputs especially thirteen wastewater treatment plants in its water
95
catchment. In this study, the focus was on anthropogenic organic matter from La Crau wastewater treatment plant
96
WWTP which served 50,086 inhabitants. This WWTP uses secondary and tertiary technologies for wastewater
97
treatment such as activated sludge technology, sand filter, prolonged aeration and anaerobic sludge digestion.
98
Sampling was done using plastic bottles of one liter each to sample 1 liter of River water , wastewater treatment plant
99
effluent and Sea water. Exact GPS locations of these sampling sites are the same according to recent procedures
(EL-100
Nahhal et al. 2020). Eight sampling cruises were conducted for solar irradiation experiments, sampling dates
101
corresponding to each irradiation experiment are shown in Table 2.
102
Collected Samples Filtration
103
Having three types of water (River water RW, Sea water SW and wastewater effluent WW) and making permutations
104
of filtering of two types of water and leaving the last one non-filtered, we end up with experiments described in Table
105
2. Filtration process (Removal of SPOM) was conducted using a filtration kit and MilliPore filters (Type GNWP 0.20
106
µm, 47 mm diameter) to filter (one litter) 1L of RW and 1L SW and leaving 1L of WW not filtered (Exp. 1 in table 2)
107
to investigate the impact of SPOM from this non-filtered WW on mixtures (prepared according to the next section in
108
Materials and methods). Experiment Exp.2 indicates that 1L of RW was not filtered and the other two 1L of SW and
109
1L of WW were filtered to study the impact of these SPOM coming from river water RW on mixtures (the following
110
section). The same goes for remaining experiments in table 2.
111
Preparing water mixtures
112
Vials of quartz were used because quartz allows absorption of UV-VIS energy. Different mixing percentages taken
113
from the collected 1L RW, lL SW and 1L WW (filtered or not filtered as explained in the previous section) were taken
114
by pipette and inserted in quartz vial according to table 1 (or Fig.1). These mixing percentages are speculated to
115
represent actual mixing in nature. After having the required mixing percentages, all quartz vials were hand-shaken to
116
have representative mixtures. Another fifteen control samples had the same mixing percentages and prepared in dark
117
vials. Each intersection point and summits in the ternary diagram in Fig.1 represents a corresponding quartz vial that
118
contains the indicated percentages in the ternary diagram of mixtures. Exact volume of RW, SW and WW in each
119
quartz vial is indicated in Table 1. Total volume of each quartz vial is 50 mL.
120
Measurements of DOC and POC and UV-Vis spectra
121
Shimadzu TOC-5000A Total Organic Carbon Analyzer (catalytic combustion) with module ASI-5000A has been used
122
to measure dissolved organic carbon (DOC) at high temperature (720 °C) and with module SSM-5000A to measure
123
particulate organic carbon (POC). Acidification was performed to pH < 2 using 2 N HCl on samples of 1L RW, 1L
124
SW and 1L WW in each irradiation experiment and CO2 was removed by purging samples with oxygen. UV–visible
125
absorption spectra (between 250–800 nm) were measured using a PerkinElmer Lambda 10500 UV/VIS
spectropho-126
tometer with a 1 cm quartz cuvette with the blank as MilliQ water for the series of dilutions (100%, 50%, 25%, 12,5%)
127
of 1L RW, lL WW, 1LSW to check for inner filter effect according to Tucker et al. (1992).
128
Irradiation experiments
129
Four irradiation experiments were conducted at different time of year (Table 2). The first two experiment were
130
conducted in autumn and in winter season, and the last one was conducted in spring and the exact dates are described
131
in (Table 2). Fifteen mixtures in quartz vials (according to previous section ) were prepared and transferred on rooftop
132
of our laboratory MIO at Campus La Garde, Universite de Toulon in plank at sufficient distances from each other to
133
have the same irradiation conditions as shown in Fig.2. The used apparatus for these experiments is shown in Fig.2.
134
Another fifteen control samples were prepared and incubated in dark box in vicinity of irradiated samples.
135
Measurements of light intensity.
136
Météo-France (www.meteofrance.com) provided solar irradiance (light intensity) measured in milliVolts mV for each
137
day of irradiation as mentioned in table 2 and the cumulative light intensity was calculated and graphed for each
138
irradiation experiment.
139
Excitation Emission Matrix EEM fluorescence spectroscopy
140
Spectrofluorometric measurements were completed using a 1-cm quartz cuvette with a Hitachi F-4500
spectrofluo-141
rometer with PMT voltage of 700 V, at 25 ℃ and sampling using a pipette a 3 mL from each irradiated quartz vial. A
142
correction for the change in volume was done by replacing the taken 3mL aliquots by another 3 mL of deionized water
143
therefore steady state concentration was kept till the end of each irradiation experiment. Sodium azide (100 µL of 1M
144
NaN3) was added for each sampled 3mL to inhibit biodegradation during EEM fluorescence measurements. Addition
145
of sodium azide NaN3 has no effect on fluorescence intensity in EEMs as revealed by Patel-Sorrentino et al. (2002).
146
Excitation wavelengths (Ex) spectra were measured from 200 to 400 nm at 5 nm-increment, and emission wavelengths
147
(Em) spectra from 220 to 420 nm at 5 nm-intervals with scan speed set at 2,400 nm.min-1. Slit width of 5 nm was set
148
for both excitation and emission wavelengths. EEM datasets of solar irradiation experiments were processed using
149
Matlab 2013a (Math Works Inc., USA). All recorded EEMs were blank-corrected through the subtraction of EEMs of
150
Sealed ultrapure Perkin Elmer deionized water cell. Integrated Raman signal of Sealed ultrapure Perkin Elmer
deion-151
ized water cell was used to normalize values of each excitation-emission matrix and it was calculated by integrating
152
the area under the curve from 370 to 420 nm (Lawaetz and Stedmon 2009). All fluorescence intensity were in Raman
153
units (RU) . Only EEMs before irradiation of Samples No. 1,2 and 3 in table 1 are presented in the results and
discus-154
sion section whereas the remaining EEMs are not shown since the total number of EEMS for all four irradiation
155
experiments is 648 EEMs.
156
Parallel factor analysis (PARAFAC) of EEM data
157
PARAFAC is a powerful multiway technique used to decompose and fully make use of the EEM dataset. The principle
158
of PARAFAC is that it decomposes any given EEM dataset into its underlying EEM spectra constituents (Murphy et
159
al. 2013) which are a set of trilinear terms and a residual array using an alternating least squares algorithm to minimize
160
sum of squared residuals in a trilinear model. Resulting PARAFAC components represents fluorophores having similar
161
fluorescing properties which constitute the EEM dataset. PARAFAC modeling was performed on the whole EEM
162
datasets of all irradiation experiments (Table 2) using MATLAB software (MathWorks R2015b, USA) and NWAY
163
toolbox and DOMFluor toolbox (http://www.models.life.ku.dk) (Micó et al. 2019; Stedmon and Bro 2008) for a total
164
of 648 EEMs. Numerical filter was taken as 25 nm to eliminate Raman and Rayleigh scattering according to Zepp
165
method (Zepp et al. 2004). Based on CONCORDIA score, split- half analysis and visual inspection of spectral shapes
166
of each PARAFAC component, the accepted number of PARAFAC components was determined (Bro 1998).
Split-167
half analysis were performed for validation of PARAFAC model results (Stedmon et al. 2003; Murphy et al. 2013).
168
Scores of each PARAFAC component represent relative concentration of each PARAFAC component in EEM dataset.
169
Quantitative and qualitative variations of the composition of organic matter can be extracted from PARAFAC
170
modelling of EEM datasets. Normalization of contributions of PARAFAC components was performed by dividing
171
each contribution with its corresponding daily maximum contribution.
172
Multilinear regression between scores of PARAFAC components and fRW and fSW
173
Based on the explanation recently described (EL-Nahhal et al. 2020), the final multilinear regression equation as a
174
function of fRW and fSW is:
175
C*i = AWWi,0 + AWWi,1.fSW + AWWi,2.fRW (Eq.1)
Where fRW and fSW are percentages in mixture in a given quartz vial of RW and SW as described in Fig.1;
176
AWW
i,0 , AWWi,1 and AWWi,2 represent multilinear regression coefficients related to mixing equation when fWW is
177
expressed in terms of percentages (fRW and fSW). i is the number of a given PARAFAC component (e.g. C1, C2, C3) .
178
More details and explanations are thoroughly given elsewhere (EL-Nahhal et al. 2020).
179
Kinetics of Multilinear regression parameters AWW
i,0 , AWWi,1 and AWWi,2
180
AWW
i,0 , AWWi,1 and AWWi,2 values change for each day of irradiation in a given experiment. Changes in their values
181
were modelized to rate order kinetic equation in order to get a model for the evolution of fluorescence signal as a
182
function of irradiation energy expressed in volts V; with their kinetic formulas expressed as AWW
i,0 (V), AWWi,1 (V)
183
and AWW i,2(V) .
184
Accordingly, multilinear regression model in eq. 1 can be expressed kinetically as follow:
185
Statistical Analysis
186
Multi-regression analysis was used to investigate the strength of linear relationships between concentration scores of
187
fluorescent components obtained from PARAFAC analysis and water mixing composition. Regression and correlation
188
analyses and relative standard deviation for multilinear regression parameters in control non-irradiated samples were
189
performed using Microsoft Excel 2016. Significances of correlations in the statistics were evaluated.
190
Results and Discussions
191
Measured light intensity in mV for Exp.1, Exp.2, Exp.3 and Exp.4 are presented in Fig.3. It can be noticed from Fig.3
192
that light intensity in Exp.1 which was conducted in autumn and the third one Exp.3 which was conducted in winter
193
season have the lowest light intensity compared to Exp.2 (conducted in autumn) and Exp.4 (conducted in spring). The
194
high light intensity in autumn Exp.2 in December 2015 compared to autumn Exp.1 in November 2015 is due to
un-195
predictable weather in PACA (Provence Alpes Cote d’Azur) region in southeastern France. This explains the rapid
196
photodegradation in Exp.2 and Exp.4.
197
UV-VIS Absorption spectra of 1L RW, 1L WW, 1L SW
198
UV-VIS absorption spectra of sampled 1-liter river water RW, 1-liter effluent wastewater WW and 1-liter seawater
199
and the dilution series 100%, 50%, 25% and 12,5% for each water type are shown in Fig. 4. It can be seen from Fig 4
200
that UV-VIS absorption spectrum of all water types RW, WW and SW decrease linearly with dilution series (100%,
201
50%, 25% and 12,5%) showing no primary or secondary inner filter effect in these waters (RW,WW & SW) as
202
previously described (Tucker et al. 1992; Ohno 2002). In addition, sand filter; a tertiary wastewater treatment
203
technology; is used in the WWTP of La Crau city in this study removes inner filter effect caused by SPOM and this is
204
in accordance with Sgroi et al. (2020) who found no inner filter effect for effluent tertiary wastewater after sand
205
filtration.
206
Excitation Emission Matrix of Example Samples 1,2 and 3 before irradiation and after irradiation
207
Collected water samples (RW, SW and WW) have different origin to match the naturally occurring mixtures. Filtration
208
of samples was done to match naturally occurring precipitation in ecosystems. For instance, at rough sea water
209
movement, SPOM are at most whereas, at soft sea, SPOM tend to precipitate resulting in as clean solution as filtrated
210
samples. Moreover, the use of different irradiation periods is to understand the effects of different light intensities on
211
degradation processes and fluorescence signal of DOM. Three-dimensional fluorescence spectra (EEMs) of the first
212
three samples in table 1 are presented for every irradiation experiment in Figures (5, 6, 7 and 8) as example EEMs of
213
the effect of solar irradiation (the remaining EEMs for each sample in table 1 are not shown).
214
First experiment Exp.1 (in autumn) .
215
First irradiation experiment (Exp. 1) was conducted in the autumn season starting irradiation from November 10 to
216
November 20 2015 (Table 2). EEMs of Samples no 1, 2 and 3 in table 1 (before irradiation and after irradiation and
217
the difference between before and after irradiation) are presented in Fig.5 for Exp.1 in which SPOM from effluent
218
WW is present whereas SPOM from RW and SW were absent. Concentrations of POC of WW was 3 ± 0.23 mg/l
219
whereas DOC concentration of RW and SW were 2.1±0.18mg/l and 2.4±0.19mg/l. It can be seen in Fig. 5 that
220
unfiltered and unmixed effluent WW (sample no. 3) contains the highest fluorescence intensities before irradiation
221
and after irradiation compared to samples no. 1 and 2. All fluorescence peaks got photodegraded as shown by the
222
diminution of fluorescence intensity of them as clearly can be seen in color bar values.
223
Second experiment Exp. 2 (in autumn)
224
Second irradiation experiment (Exp. 2) was also conducted in autumn season starting irradiation from December 20
225
until December 17 2015 (Table 2). EEMs of Samples no 1, 2 and 3 in table (before irradiation and after irradiation and
226
the difference between before and after irradiation) are presented in Fig.6 for Exp. 2 in which particulate organic matter
227
from river water is present whereas seawater and effluent wastewater were filtered. The concentration of POC of RW
228
was 0.5 ± 0.14 mg/l whereas DOC concentration of SW and WW were 2±0.3mg/l and 3.5±0.2mg/l. It can be seen in
229
Fig.6 that peak C representing humic-like fluorophores and peak M representing marine humic-like fluorophores
230
(Coble 1996) has medium intensity in sample no. 1 (unmixed RW i.e. 100% RW) and higher intensity peak C in the
231
sample no. 2 (unmixed SW i.e. 100% SW) and the highest intensity found in sample no.3 (unmixed WW). In addition,
232
peaks B and T which represent protein-like fluorophores (tyrosine-like and tryptophan-like) are also higher in
233
fluorescence intensity compared to samples no. 1 and 2 before irradiation. After irradiation, fluorescence intensity of
234
peak B (tyrosine-like fluorophores) and peak T (Tryptophan-like fluorophores) degraded as shown with their lowest
235
fluorescence intensities shown as the values in the color bar. Furthermore, the light intensity in the second experiment
236
in autumn is less than the light intensity in experiment Exp.1. This suggest slower photochemical degradation.
237
Third experiment Exp. 3 (in winter season)
238
Third irradiation experiment (Exp. 3) was conducted in the winter season starting irradiation from February 15 until
239
March 4 2016 (Table 2). EEMs of Samples no 1, 2 and 3 in table (before irradiation and after irradiation and the
240
difference between before and after irradiation) are presented in Fig.7 for Exp. 3 in which particulate organic matter
241
from sea water is present whereas river water and effluent wastewater were filtered. The concentration of POC of SW
242
was 0.6 ± 0.07 mg/l whereas DOC concentration of RW and WW were 2±0.18 mg/l and 3.7±0.14 mg/l. It can be seen
243
in Fig.7 that sample no 2 ( unmixed and unfiltered SW) has the lowest fluorescence intensity for most peaks (C, A, M,
244
B, and T) before irradiation and sustained more or less the same fluorescence intensity after irradiation. There was no
245
inner-filter effect in this sample as checked by UV-VIS absorption spectra of SW as explained above. For filtered WW
246
(sample no. 3), it is characterized by the highest fluorescence intensities (before irradiation and after irradiation)
247
compared to samples no 1 and 2. Moreover, peaks C and M degraded the most which is in agreement with Zhu et al.
248
(2017b) who found that CDOM from terrestrial origins was more susceptible to photochemical degradation compared
249
to CDOM from biological sources.
250
Fourth experiment Exp.4 (in spring season)
251
Last irradiation experiment (Exp. 4) was conducted in spring season starting irradiation from May 05 until May 27
252
2016 (Table 2). EEMs of Samples no 1, 2 and 3 in table (before irradiation and after irradiation and the difference
253
between before and after irradiation) are presented in Fig.8 for Exp.4 in which particulate organic matter from RW,
254
SW and WW are present at the same time in all the samples of Table 1. Concentrations of POC of RW, SW and WW
255
were 0.6±0.1mg/l , 0.7±0.2mg/l and 2.75±0.45mg/l . It can be seen in Fig.8 that the highest fluorescence intensity is
256
found in Sample No.3 (100% WW) which is characterized by high peak C and M intensities which are degraded after
257
irradiation. This finding is in accord with previous report (Seong-Nam and Gary 2008). The too low fluorescence
258
intensities of protein-like peaks in all the EEMS shown in figures (Fig. 5, 6, 7 and Fig.8) are in accordance with the
259
results of PARAFAC model shown in Fig.9 where there was no protein-like PARAFAC component was found.
260
Parallel factor analysis (PARAFAC) of EEM data
261
EEMs of fifteen samples (Table 1) for each irradiation day and for all the irradiation experiments (Exp.1, Exp.2, Exp.3
262
and Exp.4) have been decomposed using PARAFAC for a total of 648 EEMs. PARAFAC decomposition of 648 EEM
263
dataset of all irradiation experiments (Table 2) gives three independent components which are validated by
264
CORCONDIA 74.9 % and split-half method. Fluorescence landscape of PARAFAC components (C1, C2 and C3)
265
with corresponding excitation and the emission loadings are shown in Fig.9. It can be noticed that the nature of
266
PARAFAC components seem to be present with varying contributions in every sample in the whole EEMs dataset of
267
all Irradiation experiments. Excitation emission loadings of each component (C1, C2 and C3) were compared with
268
Openfluor.org database and previously reported PARAFAC components in literature and their corresponding
269
equivalents are shown in Table 3. C1 presented excitation maximum at 340 nm and an emission maximum at 430 nm.
270
Previous studies have associated this component to UV-A humic-like fluorophores and Peak C (Coble 1996) and peak
271
“∝ (Parlanti et al. 2000). It represents terrestrial humic-like and it can be suggested that it is used as wastewater/nutrient
272
enrichment tracer (Murphy et al. 2011). C2 showed excitation maximum at 375 nm and an emission maximum at 465
273
nm. This component represents more humificated fluorophores and resembles C2 found in the study of (Abaker et al.
274
2018) and it is of fluvic-like fluorophores Peak A (Coble 1996). C3 excitation/emission peak was located at
275
wavelengths of 295/405nm. This may be attributed to anthropogenic humic materials, agricultural and microbial
276
component. This component C3 was defined in literature as marine humic-like peak M (Coble, 1996) and has
277
resemblance to Q3 which is a microbially oxidized component (Cory and McKnight 2005). This suggestion is in
278
accordance with previous reports (Murphy et al. 2008; Stedmon and Markager 2005). Furthermore, no protein-like
279
component was detected by PARAFAC which is validated by split-half method. The above-described PARAFAC
280
fluorescent components were used to reconstruct the original whole EEMs dataset and for multilinear regression
281
between each component (i.e. C1, C2 and C3) and sample composition (fSW and fRW).
282
Photochemical variation in fluorescent PARAFAC components
283
Variation of C1, C2 and C3 in irradiation experiment Exp.4 before conducting multilinear regression indicates how
284
the parameters of multilinear regression varies with irradiation process. Changes of maximum fluorescence intensity
285
Fmax of each PARAFAC components with irradiation time are shown in Fig.10. Fig.10 shows variations of Fmax for C1,
286
C2 and C3 which decrease with irradiation process which is very clear for irradiated samples (shown in black).
287
Whereas, for control samples (dark) (shown in dotted gray), Fmax doesn’t have a clear trend which explains the results
288
presented in Fig.11. Similar trend has been found for the remaining irradiation experiments (Exp.1, Exp.2, Exp.3 and
289
Exp.4) (data not shown). These findings suggest that photodegradation impact humic and fluvic-like fluorophores in
290
water column in river and sea water. Additionally, SPOM may adsorb soluble organic matter from water resulting in
291
a photoprotection to the DOM. This process may result in reducing photochemical degradation in which the
292
fluorescence signal is not dramatically affected. In this regard, we suggest the following protection mode from
293
suspended particulate organic matter. As many wastewater treatment plants use chlorine as a disinfectant material
294
after secondary treatment and seawater in France is partly chlorinated (Péron and Courtot-Coupez 1980). Part of the
295
added chlorine may undergo the following reaction either in treatment plants or receiving water bodies. Under sunlight,
296
chlorine in effluent wastewater samples undergo the following reactions according to equations 3 and 4.
297
Photodegradation of Cl2 under sunlight produces free radicals of as shown in Eq. (3).
298
𝐶𝐿 − 𝐶𝐿 → 2𝐶𝑙 ∗ 𝐸𝑞. (3)
299
Free radicals produced in Eq. 3 react with oxygen to produce chlorine oxides may be classified in monochlor- and
300
dichloroxi- derivatives as previously reported (Lopez et al., 1998) (Eq. 4)
301
2𝐶𝑙 ∗ +𝑂2→ 𝐶𝑙𝑂 + 𝐶𝑙2𝑂 𝐸𝑞. (4)
302
All these compounds are thermally unstable and may decompose readily in atmosphere. Nevertheless, these reactions
303
are contentious and may lead to formation of C12O4 which may undergo a reformation reaction to reproduce Cl-Cl
304
undergo continues reaction as shown in Eq. 5-6.
305
2𝐶𝑙2𝑂4 → 𝐶𝑙2𝑂7+ 0.5 𝑂2+ 𝐶𝑙2 𝐸𝑞. (5)
306
𝐶𝑙2𝑂4 → 2𝑂2+ 𝐶𝑙2 𝐸𝑞. (6)
These proposed reactions are in accordance with Lopez et al., 1998 who indicated formation of these photochemical
308
reaction under exposure to light at wavelength of 366 nm. So far, free radicals produced in Eq. 3 react with dissolved
309
organic matter (Glucose, fatty acid and or protein) producing organochlorine compound according to Eq. (7)
310
2𝐶𝑙 ∗ +𝑅 − 𝐶𝐻3→ 𝑅 − 𝐶𝐻2𝐶𝑙 + 𝐻𝐶𝑙 𝐸𝑞. (7)
311
These chlorinated hydrocarbons (R-CH2Cl) are persistent in ecosystem and are able to absorb solar energy and release
312
it again into environment to go to its stable stage according to Eq. 8.
313
𝑅 − 𝐶𝐻2𝐶𝐻2𝐶𝑙 + 𝐶𝑙 ∗ + 𝑙𝑖𝑔ℎ𝑡 𝑒𝑛𝑒𝑟𝑔𝑦 → 𝑅 − 𝐶𝐻𝐶𝐻2𝐶𝑙 + 𝐻𝐶𝑙 → 𝐸𝑞. (8)
314
The produced compound R-CHCH2Cl is fluorescent matter due to double bond formation. Where R can be an aliphatic
315
or aromatic moiety (Margulies et al. 1994). Presence of particulate matter in the system can reduce the rate of
above-316
mentioned reactions (3-8) but cannot stop them. The proposed reactions agree with previous reports (Morris 1978;
El-317
Nahhal et al. 1999 ; Nir et al. 2000 ; Muellner et al. 2007) and recent reports (Yuan et al. 2020)
318
Initial values of ( AWW
*,0 , AWW*,1 , AWW*,2 ) before irradiation
319
Values of multilinear regression coefficients for PARAFAC components (C1, C2 and C3) are given in table 4 for time
320
zero, i.e. before the start of irradiation experiments, for all irradiation/mixing experiments. Multilinear regression
321
between (C1,C2 and C3) and (fSW, fRW) shows excellent fitting since the power of correlation is high as indicated from
322
values of r2 for each irradiation experiment as shown in table 4. It can be seen that values of intercept (AWW
1,0 , AWW2,0 ,
323
AWW
3,0 ) are of two order of magnitude higher than the absolute value of both coefficients of fSW (AWW1,1 , AWW2,1 ,
324
AWW
3,1 ) and fRW (AWW1,2 , AWW2,2 , AWW3,2 ) for all PARAFAC components. The intercept (AWW1,0 , AWW2,0 , AWW3,0 )
325
contains implicitly the impact of fWW on resulting fluorescence contribution of (C1, C2 and C3) as explained thoroughly
326
in the methodology section of this manuscript . This indicates that increasing fSW or fRW result in decreasing the resulting
327
fluorescence contribution of (C1, C2 and C3). Additionally, it can be suggested that presence of particulate matter
328
slows the intensity of photochemical degradation, this is quite obvious with the slight changes in samples that contains
329
large fraction of suspended particulate matter compared with filtrated samples. Furthermore, suspended organic matter
330
may adsorb dissolved organic matter on its surfaces and provide photoprotection from degradation. This phenomenon
331
is in accordance with previous reports (EL-Nahhal et al. 2001; Nir et al. 2000; Margulies 1996) that revealed the ability
332
of organoclay complexes to provide photoprotection to photodegradable pesticides. Moreover, filtration of samples
333
may increase the contribution of fluorescence of mixing process is predominated by wastewater treatment plant for
334
PARAFAC components and filtration has a measurable effect on multilinear regression parameters. When SPOM of
335
only one water source is present, there is a decrease of values of the intercept parameter which suggest that there is an
336
effect on fluorophores of filtered particles. When SPOM from RW is present (i.e. Exp.2), values of intercept are greater
337
than that when SPOM from SW (i.e. Exp.3) is present suggesting that removal of fluorophores of river water plays a
338
role on values of intercept. In general, there is an influence of presence/absence of SPOM on the initial contribution
339
of multilinear regression parameters.
340
Rate order and kinetic constant determination for the photodegradation of Multilinear regression parameters
341
( AWW
*,0 , AWW*,1 , AWW*,2 )
342
Kinetic constant and rate order of these parameters indicate how contribution of each PARAFAC component (Eq.2)
343
will evolve with irradiation time; hence EEM at any given point of irradiation time can be reconstructed. All irradiation
344
experiment (Exp.1, Exp.2, Exp.3 and Exp.4) showed continuous decrease of fluorescence signal with irradiation time
345
as shown in Fig.10. In comparison to other studies (Song et al. 2015; Zhu et al. 2017a), there was no increase of
346
fluorescence intensity found in this study. The decrease in values of ( AWW
*,0 , AWW*,1 , AWW*,2 ) in all experiments
347
could be fit by second order reaction kinetics (Table 5) in agreement with previous works (Yang et al. 2014). Moreover,
348
values of kinetic constant (k) are presented in Fig.11(a). Wu et al. (2016) found pseudo-first order reaction kinetics for
349
the removal of fluorescence region volumes using fluorescence regional integration “FRI” which is in contrast with
350
our study where fluorescence EEMs were modelled by PARAFAC and multilinear regression was conducted between
351
fSW and fRW and (C1, C2 and C3). In addition, those authors used simulated solar light during 12h and under 2.80
352
mW/cm2 (visible) and 70.00 mW/cm2. Second order reaction kinetics suggest that organic matter reacts with excited
353
organic matter itself. Values of kinetic constant for ( AWW
*,0 , AWW*,1 , AWW*,2 ) are shown in Fig.11(a). It can be seen
354
from Fig.11(a) that values of kinetic constant for intercept AWW
1,0 (Fig.10 a.1) is greater in C1 in Exp.1 compared to
355
the remaining experiment and also in comparison to AWW
2,0 andAWW3,0 . In addition, same pattern can be seen in
356
Exp.3 . Whereas for Exp.4 and Exp. 2, values of kinetic constant of AWW
1,0 , AWW2,0 andAWW3,0 are almost near zero
357
which are negligible. For kinetic constant k of AWW
1,1 , AWW2,1 andAWW3,1 ( representing the impact of fSW) (Fig.11
358
a.2 ) showed similar trend in Exp.1 and Exp.3 compared to Exp. 4 and Exp. 2 (their values also negligible) . Moreover,
359
kinetic constant k of AWW
1,2 , AWW2,2 andAWW3,2 (representing the impact of fRW) are shown in Fig.11 (a.3). Same trend
360
can be seen as mentioned above however with higher values of k compared to values of k for AWW
1,1 , AWW2,1 and
361
AWW
3,1. Negative values for k in the middle and right figures represent the negative impact of fSW and fRW on
362
fluorescence signal of C1, C2 and C3. The higher values of k for the coefficient of fRW suggest that increasing the
363
percentage of river water in sample leads to faster photodegradation than increasing fSW concentration in sample. The
364
lowest values of k for all C1 , C2 and C3 are found for AWW
1,0 , AWW2,0 andAWW3,0 which arethe intercept of multilinear
365
regression and implicitly retain information about the impact of fWW. This suggests that increasing fWW in sample retards
366
photodegradation of PARAFAC component. Photosensitivity variations are present between fWW and fRW or fSW.
Accordingly, fWW contribution is refractory and resilient under long irradiation. Zhu et al. (2017b) found similar results
368
between mixing of terrestrial and autochthonous organic matter. Wu et al. (2016) observed little variations between
369
humic-like and protein-like fluorophores in reclaimed water under strong conditions of irradiation. Kinetic constant
370
(k) is highest when SPOM of WW and SW were present (Exp.1 and Exp.3) which imply that SPOM from these WW
371
and SW makes the photodegradation faster for C1 and C2 and C3. Impact of SPOM from RW, SW and WW varies
372
according to fluorescent PARAFAC component. The nature of these SPOM should be investigated more in order to
373
understand their role in photodegradation. Advanced SPOM separation or extraction and fractionation techniques
374
should be used (e.g. XAD resins). Evolution with irradiation of initial values of ( AWW
*,0 , AWW*,1 , AWW*,2 ) before
375
irradiation for each corresponding PARAFAC component can be tracked using the values of their corresponding
376
kinetic constants hence reconstruction of fluorescence signal of C1, C2, and C3 can be conducted hence the whole
377
EEM of sample. Therefore, a dynamic model has been developed for the photodegradation of SPOM from different
378
water types. No clear behavior for control dark samples was found due to biological activity (Yang et al. 2014); except
379
the mean contributions relative deviation standard (RSD) and this is consistent with results shown above in Fig.10.
380
Relative Standard deviation (RSD) of parameters of multilinear regression are shown in Fig.11(b). RSD values in
381
Exp.4 are the smallest compared to all other irradiation experiments. This finding could be due to synergic effect of
382
the microbial activity coming simultaneously from all the water types (RW, SW and WW). RSD values for C3
383
coefficients of multilinear regression are higher for all irradiation experiments compared to those of C1 and C2. The
384
greater RSD value of C3 for all coefficients can be interpreted as having chaotic variations. Another observation is
385
that RSD values for C1 and C2 have an order of Exp. 1 > Exp. 2 > Exp. 3 > Exp. 4. SPOM from WW seems to be
386
responsible for variation with a greater degree compared to SPOM from SW and RW. Compared to irradiation
387
experiment (Exp.4), the synergistic effect of all SPOM makes RSD values to be the smallest possible. This observation
388
could be attributed to the fact that SPOM from each water type and microorganisms are competing which therefore
389
stabilize fluorescence signal in non-sterile dark control. These data indicate statistical differences between control
390
group and those exposed to sunlight during different time of year.
391
Conclusions
392
The rationale of this study emerges from the need to develop previous models for the prediction of fluorescence signal
393
of anthropogenic DOM based on mixing composition of sample and to study the impact of presence/absence of
394
suspended particulate matter of three water types (River water RW, Seawater SW, effluent wastewater WW) on the
395
resulting fluorescence signal of their mixtures and to simulate their natural mixing. Four Mixing and Irradiation
396
Experiments (Exp.1, Exp.2, Exp.3 and Exp.4) were conducted during different time of year and the impact of
397
irradiation and presence/absence of suspended particulate matter from three water types (river water RW, seawater
398
SW, effluent wastewater WW) were studied using three-dimensional fluorescence spectroscopy coupled with parallel
399
factor analysis EEM-PARAFAC. Evolution of fluorescence signal of PARAFAC components was investigated
400
kinetically through kinetic evolution of multilinear regression parameters with irradiation. Three components (C1,C2
401
and C3) might be extracted from the whole EEM dataset of all irradiation experiments. Protein-like component might
402
not be found which is due to its very low fluorescence intensity in the whole dataset. Second order kinetics were found
403
for all parameters (intercept , coefficient of fSW and coefficient of fRW) indicating bimodal reaction of organic matter
404
with itself and excited organic matter. It can be concluded that SPOM of one water type has profound impact on the
405
resulting kinetic constants of multilinear regression parameters. Kinetic constants of (AWW
*,0 “i.e. intercept” , AWW*,1
406
“coefficient of fSW” and AWW*,2 “coefficient of fRW”) were the highest in irradiation experiment Exp. 1 and Exp. 3 and
407
the lowest in Exp. 4 and Exp.2. Thus, this study is a further step on the development of online or real time models of
408
evolution of fluorescence signal coming from anthropogenic sources. Further studies are warranted for the application
409
of this model on other urban river systems.
410
Acknowledgements
411
This work was funded by Hermes Program – from European commission through its Erasmus Mundus foundation; in
412
addition to the funding from Campus France through its research grant Al Maqdisi PHC Project n° 40229SD.
413
Moreover, we are thankful toward Christian Martino and Gael Durrieu for being available in each sampling campaign.
414
Compliance with ethical standards
415
Conflict of interest
416
The authors declare no conflict of interest
417
Author Contributions
418
Ibrahim EL-Nahhal: Funding acquisition, Conceptualization, Methodology, Writing- Reviewing and Editing
Ro-419
land Redon: Software -Reviewing Michel Raynaud: Software -Reviewing Yasser EL-Nahhal:Funding acquisition,
420
Reviewing and Editing Stéphane Mounier: Funding acquisition, Supervision, Project administration, Reviewing and
421
Editing. All authors read and approved the final manuscript.
422
References
423
Abaker M G, Domeizel M, Mouloubou O R, Rapetti N, Mounier S (2018) UV–Visible and Fluorescence Green Waste
424
Composts Monitoring: Material Dependency. Compost Sci Util 26(3):177–188.
425
https://doi.org/10.1080/1065657X.2018.1434023
426
Akkanen J, Vogt R D, Kukkonen J V K (2004) Essential characteristics of natural dissolved organic matter affecting
427
the sorption of hydrophobic organic contaminants. Aquat Sci 66:171–177.
https://doi.org/10.1007/s00027-004-428
0705-x
429
Baker A, Spencer R G M (2004) Characterization of dissolved organic matter from source to sea using fluorescence
430
and absorbance spectroscopy. Sci Total Environ 33:217–232. https://doi.org/10.1016/j.scitotenv.2004.04.013
431
Baker A, Tipping E, Thacker S A, Gondar D (2008). Relating dissolved organic matter fluorescence and functional
432
properties. Chemosphere 73(11):1765–1772. https://doi.org/10.1016/j.chemosphere.2008.09.018
433
Boyd T J, Osburn C L (2004) Changes in CDOM fluorescence from allochthonous and autochthonous sources during
434
tidal mixing and bacterial degradation in two coastal estuaries. Mar Chem 89:189–210.
435
https://doi.org/10.1016/j.marchem.2004.02.012
436
Bro R 1998 Multi-way Analysis in the Food Industry. Ph.D. dissertation, University of Amsterdam. Retrieved from :
437
http://www.models.kvl.dk/sites/default/files/brothesis_0.pdf
438
Callahan J, Dai M, Chen R F, Li X, Lu Z, Huang W (2004) Distribution of dissolved organic matter in the Pearl river
439
estuary, China. Mar Chem 89:211–224. https://doi.org/10.1016/j.marchem.2004.02.013
440
Chin W C, Orellana M V, Verdugo P (1998). Spontaneous assembly of marine dissolved organic matter into polymer
441
gels. Nature 391:568–572. https://doi.org/10.1038/35345
442
Coble P G (1996) Characterization of marine and terrestrial DOM in seawater using excitation-emission matrix
spec-443
troscopy. Mar Chem 51(4):325–346. https://doi.org/10.1016/0304-4203(95)00062-3
444
Cohen E, Levy G J, Borisover M (2014) Fluorescent components of organic matter in wastewater: efficacy and
selec-445
tivity of the water treatment. Water Res 55:323–334. https://doi.org/10.1016/j.watres.2014.02.040
446
Dalzell B J, Minor E C, Mopper K M (2009) Photodegradation of estuarine dissolved organic matter: an assessment
447
of DOM transformation. Org Geochem 40:253–257. https://doi.org/10.1016/j.orggeochem.2008.10.003
448
De Souza Sierra M M, Donard O F X (1991) Simulation of fluorescence variability in estuaries. Oceanologica Acta
449
11:275–284
450
EL-Nahhal I, Redon R, Raynaud M, EL-Nahhal Y, Mounier S (2020) Characterization of the fate and changes of
post-451
irradiance fluorescence signal of filtered anthropogenic effluent dissolved organic matter from wastewater
treat-452
ment plant in the coastal zone of Gapeau river. Environ Sci Pollut Res 27:23141–23158
453
https://doi.org/10.1007/s11356-020-08842-w
454
El-Nahhal Y, Nir S, Margulies L, Rubin B (1999) Reduction of photodegradation and volatilization of herbicides in
455
organo-clay formulations. Appl Clay Sci 14:105-119. https://doi.org/10.1016/S0169-1317(98)00053-2
456
Estapa M L, Mayer L M (2010) Photooxidation of particulate organic matter, carbon/oxygen stoichiometry, and
457
related photoreactions. Mar Chem 122(1e4):138-147. https://doi.org/10.1016/j.marchem.2010.06.003
458
Gagné J P, Tremblay L (2009) Organic matter distribution and reactivity in the waters of a large estuarine system. Mar
459
Chem 116(1-4):1-12. https://doi.org/10.1016/j.marchem.2009.09.006
460
He W, Chen M, Schlautman M A, Hur J (2016) Dynamic exchanges between DOM and POM pools in coastal and
461
inland aquatic ecosystems: A review. Sci Total Environ 551-552:415–428.
https://doi.org/10.1016/j.sci-462
totenv.2016.02.031
463
Her N, Amy G, McKnight D, Sohn J, Yoon Y (2003) Characterization of DOM as a function of MW by fluorescence
464
EEM and HPLC-SEC using UVA, DOC, and fluorescence detection. Water Res 37(17):4295–4303.
465
https://doi.org/10.1016/S0043-1354(03)00317-8
466
Hirose K (2007) Metal–organic matter interaction: ecological roles of ligands in oceanic DOM. Appl Geochem
467
22:1636–1645. https://doi.org/10.1016/j.apgeochem.2007.03.042
468
Ishii S K, Boyer T H (2012) Behavior of reoccurring PARAFAC components in fluorescent dissolved organic matter
469
in natural and engineered systems: a critical review. Environ Sci Technol 46(4):2006–2017.
470
https://doi.org/10.1021/es2043504
471
Kowalczuk P, Cooper W J, Whitehead R F, Durako M J, Sheldon W (2003) Characterization of CDOM in an
organic-472
rich river and surrounding coastal ocean in South Atlantic Bight. Aquat Sci 65:384–401.
473
https://doi.org/10.1007/s00027-003-0678-1
474
Laane R W P M, Kramer K J M (1990) Natural fluorescence in the North Sea and its major estuaries. Netherlands J
475
Sea Res 26:1–9. https://doi.org/10.1016/0077-7579(90)90052-I
476
Lapierre J F, del Giorgio P A (2014) Partial coupling and differential regulation of biologically and photochemically
477
labile dissolved organic carbon across boreal aquatic networks. Biogeosciences 11(20):5969–5985.
478
https://doi.org/10.5194/bg-11-5969-2014
479
Lawaetz A J, Stedmon C A (2009) Fluorescence intensity calibration using the Raman scatter peak of water. Appl
480
Spectrosc 63(8):936–940. https://doi.org/10.1366/000370209788964548
481
Leppard GG, West MM, Flannigan DT, Carson J, Lott J (2011) A classification scheme for marine organic colloids
482
in the Adriatic Sea: colloid speciation by transmission electron microscopy. Can J Fish Aquat Sci 54(10):2334–
483
2349
484
Liu Q Y, Shank G C (2015) Solar radiation-enhanced dissolution (photodissolution) of particulate organic matter in
485
Texas estuaries. Estuaries Coasts 38 (6):2172-2184. https://doi.org/10.1007/s12237-014-9932-0
486
Lopez L M, Croce E A, Sicre E J (1998) The photochemical reaction between chlorine and chlorine perchlorate at
487
366 nm J Photochem Photobiol A Chem 112:97-102. https://doi.org/10.1016/S1010-6030(97)00276-1
488
Margulies L, Rosen H, Stern T, Rytwo G, Rubin B, Ruso L, Nir S, Cohen E (1993) Photostabilization of pesticides
489
by clays and chromophores. Arch Insect Biochem Physiol 22:467–486. https://doi.org/10.1002/arch.940220313
490
Mayer L M, Schick L L, Skorko K, Boss E (2006) Photodissolution of particulate organic matter from sediments.
491
Limnol Oceanogr 51 (2):1064-1071. https://doi.org/10.4319/lo.2006.51.2.1064
492
McCallister S L, Bauer J E, Canuel E A (2006a) Bioreactivity of estuarine dissolved organic matter: A combined
493
geochemical and microbiological approach. Limnol Oceanogr 51(1):94–100.
494
https://doi.org/10.4319/lo.2006.51.1.0094
495
McCallister S L, Bauer J E, Ducklow H W, Canuel E A (2006b) Sources of estuarine dissolved and particulate organic
496
matter: A multi-tracer approach. Org Geochem 37(4):454–468.
https://doi.org/10.1016/J.ORGGEO-497
CHEM.2005.12.005
498
Micó P, García-Ballesteros S, Mora M, Vicente R, Amat A M, Arques A (2019) EEMlab: A graphical user-friendly
499
interface for fluorimetry experiments based on the drEEM toolbox. Chemometr Intell Lab Syst 188:6–13.
500
https://doi.org/10.1016/J.CHEMOLAB.2019.03.001
501
Mopper K, Kieber D J, Stubbins A (2014) Marine Photochemistry of Organic Matter: Processes and Impacts.
Pro-502
cesses and Impacts. In Biogeochemistry of Marine Dissolved Organic Matter: Second Edition (pp. 389–450).
503
https://doi.org/10.1016/B978-0-12-405940-5.00008-X
504
Morris J C (1978) The chemistry of aqueous chlorine in relation to water chlorination. In: Jolleys, R.L. (Ed.), Water
505
Chlorination: Environmental Impact and Health Effects, vol. 1. Ann Arbor Science Publishers, Michigan, pp.
506
21–35.
507
Muellner M G, Wagner E D, Mccalla K, Richardson S D, Woo Y T, Plewa M J (2007) Haloacetonitriles vs. regulated
508
haloacetic acids: are nitrogen-containing DBFs more toxic? Environ Sci Technol 41(2):645-651.
509
https://doi.org/10.1021/es0617441
510
Murphy K R, Hambly A, Singh S, Henderson R K, Baker A, Stuetz R, Khan S J (2011) Organic Matter Fluorescence
511
in Municipal Water Recycling Schemes: Toward a Unified PARAFAC Model. Environ Sci Technol 45(7):2909–
512
2916. https://doi.org/10.1021/es103015e
513
Murphy K R, Stedmon C A, Graeber D, Bro R (2013) Fluorescence spectroscopy and multi-way techniques.
PARA-514
FAC. Anal Methods 5(23):6557. https://doi.org/10.1039/c3ay41160e
515
Murphy K R, Stedmon C A, Waite T D, Ruiz G M (2008) Distinguishing between terrestrial and autochthonous
516
organic matter sources in marine environments using fluorescence spectroscopy. Mar Chem 108(1–2):40–58.
517
https://doi.org/10.1016/j.marchem.2007.10.003
518
Nir S, Undabeytia T, Yaron D, El-Nahhal Y, Polubesova T, Serban S, Rytwo G, Lagaly G, Rubin B (2000)
519
Optimization of adsorption of hydrophobic herbicides on montmorillonite preadsorbed by monovalent organic
520
cations: Interaction between phenyl rings. Environ Sci Technol 34:1269-1274.
521
https://doi.org/10.1021/es9903781
522
Ohno T (2002) Fluorescence inner-filtering correction for determining the humification index of dissolved organic
523
matter. Environ Sci Technol 36(4):742–746. https://doi.org/10.1021/es0155276
524
Osburn C L, Handsel L T, Mikan M P, Paerl H W, Montgomery M T (2012) Fluorescence tracking of dissolved and
525
particulate organic matter quality in a river-dominated estuary. Environ Sci Technol 46(16):8628–8636.
526
https://doi.org/10.1021/es3007723
527
Parlanti E, Wörz K, Geoffroy L, Lamotte M (2000) Dissolved organic matter fluorescence spectroscopy as a tool to
528
estimate biological activity in a coastal zone submitted to anthropogenic inputs. Org Geochem 31(12):1765–
529
1781. https://doi.org/10.1016/S0146-6380(00)00124-8
530
Patel-Sorrentino N, Mounier S, Benaim J Y (2002) Excitation-emission fluorescence matrix to study pH influence on
531
organic matter fluorescence in the Amazon basin rivers. Water Res 36(10):2571–2581.
532
https://doi.org/10.1016/s0043-1354(01)00469-9
533
Péron A,Courtot-Coupez J (1980) Etude physicochimique de la chloration de l'eau de mer artificielle. Water Res
534
14(4):329-332. https://doi.org/10.1016/0043-1354(80)90079-2
535
Pisani O, Yamashita Y, Jaffe R (2011) Photo-dissolution of flocculent, detrital material in aquatic environments:
536
contributions to the dissolved organic matter pool. Water Res 45 (13):3836-3844.
537
https://doi.org/10.1016/j.watres.2011.04.035
538
Riggsbee J A, Orr C H, Leech D M, Doyle M W, Wetzel R G (2008) Suspended sediments in river ecosystems:
539
photochemical sources of dissolved organic carbon, dissolved organic nitrogen, and adsorptive removal of
540
dissolved iron. J Geophys Research-Biogeosciences 113(G3):019. https://doi.org/10.1029/2007JG000654
541
Seong-Nam N, Gary A (2008) Differentiation of Wastewater Effluent Organic Matter (EfOM) From Natural Organic
542
Matter (NOM) Using Multiple Analytical Techniques. Water Sci Technol 57(7).
543
https://doi.org/10.2166/WST.2008.165
544
Sgroi M, Gagliano E, Vagliasindi F, Roccaro P (2020) Inner filter effect, suspended solids and nitrite/nitrate
interfer-545
ences in fluorescence measurements of wastewater organic matter. Sci Total Environ 711:134663.
546
https://doi.org/10.1016/j.scitotenv.2019.134663
547
Søndergaard M, Thomas D N (2004) Dissolved Organic Matter (DOM) in Aquatic Ecosystems: A Study of European
548
Catchments and Coastal Waters. EU Project DOMAINE 87-89143-25-6.
549
Song W, Zhao C, Mu S, Pan X, Zhang D, Al-Misned F A, Mortuza M G (2015) Effects of irradiation and pH on
550
fluorescence properties and flocculation of extracellular polymeric substances from the cyanobacterium
Chroo-551
coccus minutus. Colloids Surf B Biointerfaces 128:115–118. https://doi.org/10.1016/J.COLSURFB.2015.02.017
552
Southwell M W, Kieber R J, Mead R N, Avery G B, Skrabal S A (2010) Effects of sunlight on the production of
553
dissolved organic and inorganic nutrients from resuspended sediments. Biogeochemistry 98(1-3):115-126.
554
https://doi.org/10.1007/s10533-009-9380-2
555
Stedmon C A, Bro R (2008) Characterizing dissolved organic matter fluorescence with parallel factor analysis: A
556
tutorial. Limnol Oceanogr Methods / ASLO 6(11):572–579. https://doi.org/10.4319/lom.2008.6.572
557
Stedmon C A, Markager S (2005) Resolving the variability in dissolved organic matter fluorescence in a temperate
558
estuary and its catchment using PARAFAC analysis. Limnol Oceanogr 50(2):686–697.
559
https://doi.org/10.4319/lo.2005.50.2.0686
560
Stedmon C A, Markager S, Bro R (2003) Tracing dissolved organic matter in aquatic environments using a new
561
approach to fluorescence spectroscopy. Mar Chem 82(3-4):239–254.
http://dx.doi.org/10.1016/s0304-562
4203(03)00072-0
563
Tucker S A, Amszi V L, Acree W E (1992) Primary and secondary inner filtering: effect of K2Cr2O7 on fluorescence
564
emission intensities of quinine sulfate. J Chem Educ 69:A8–A12. https://doi.org/10.1021/ed069pA8
565
Wu Q, Li C, Wang W, He T, Hu H, Du Y, Wang T (2016) Removal of fluorescence and ultraviolet absorbance of
566
dissolved organic matter in reclaimed water by solar light. J Environ Sci 43:118–127.
567
https://doi.org/10.1016/J.JES.2015.08.021
568
Wünsch U J, Murphy K R, Stedmon C A (2017) The One-Sample PARAFAC Approach Reveals Molecular Size
569
Distributions of Fluorescent Components in Dissolved Organic Matter. Environ Sci Technol 51(20):11900–
570
11908. https://doi.org/10.1021/acs.est.7b03260
571
Yang X, Meng F, Huang G, Sun L, Lin Z (2014) Sunlight-induced changes in chromophores and fluorophores of
572
wastewater-derived organic matter in receiving waters – The role of salinity. Water Res 62:281–292.
573
https://doi.org/10.1016/J.WATRES.2014.05.050
574
Zepp R G, Sheldon W M, Moran M A (2004) Dissolved organic fluorophores in southeastern US coastal waters:
575
correction method for eliminating Rayleigh and Raman scattering peaks in excitation–emission matrices. Mar
576
Chem 89(1–4):15–36. https://doi.org/10.1016/J.MARCHEM.2004.02.006
577
Zhu W Z, Yang G P, Zhang H H (2017a) Photochemical behavior of dissolved and colloidal organic matter in estuarine
578
and oceanic waters. Sci Total Environ 607–608:214–224. https://doi.org/10.1016/J.SCITOTENV.2017.06.163
579
Zhu W Z, Zhang J, Yang G P (2017b) Mixing behavior and photobleaching of chromophoric dissolved organic matter
580
in the Changjiang River estuary and the adjacent East China Sea. Estuar Coast Shelf Sci
581
https://doi.org/10.1016/J.ECSS.2017.07.019582
583
584
585
586
587
588
589
590
591
592
Figures Captions593
Fig. 1 Ternary diagram of the mixing percentages of three endmember mixing components (freshwater (RW),
594
wastewater treatment plant (WW), seawater (SW)). Each red point represents a solution that contains the
men-595
tioned and calculated percentages of each water source (endmember)
596
Fig. 2 The used apparatus for all the irradiation experiments which was on the rooftop of MIO laboratory/ University
597
of Toulon-France. GPS location:(43° 08' 11.2" N 6° 01' 16.7" E)
598
Fig. 3 Light intensity measured in millivolts mV for the four irradiation experiments
599
Fig. 4 Linearity of UV-Vis absorbance spectra with dilution of the sampled 1L RW, 1L WW, 1L SW from top to
600
down respectively showing no Inner Filter Effect
601
Fig. 5 EEMs of Samples 1,2,3 in Irradiation experiment Exp.1
602
Fig. 6 EEMs of Samples 1,2,3 in irradiation experiment Exp.2
603
Fig. 7 EEMs of Samples 1,2,3 in Irradiation experiment Exp.3
604
Fig. 8 EEMs of Samples 1,2,3 in Irradiation experiment Exp.4
605
Fig. 9 Fluorescence landscape of PARAFAC components identified from the decomposition of all EEM datasets on
606
the left. Spectral loadings of excitation and emission wavelengths of the identified PARAFAC in the present
607
study on the right. Excitation loading for CP/PARAC component are shown in solid lines whereas emission
608
loadings are shown in dotted lines
609
Fig. 10 Changes in the maximum fluorescence intensity of all four PARAFAC components (C1, C2, C3 and C4)
610
during Irradiation experiment Exp.4 . All Exp.1, Exp.2, Exp.3 showed the same pattern
611
Fig. 11 (a) Kinetic constant for coefficients of multilinear regression for C1,C2 and C3 PARAFAC components. (b)
612
The relative standard deviation (RSD) values for all the multilinear regression coefficients (intercept, coefficient
613
of fSW, coefficient of fRW) for the control dark samples in all the irradiation experiments
Fig. 1
Fig. 2 Figure
Exp.1 (Date: 10/11/2015 to 26/11/2015) Exp.2 (Date: 02/12/2015 to 17/12/2015)
Exp.3 (Date: 15/02/2016 to 01/03/2016) Exp.4 (Date: 11/05/2016 to 27/05/2016)
Fig. 4
200 250 300 350 400 0.0 0 0.0 2 0.0 4 0.0 6 0.0 8 0.1 0 0.1 2 0.1 4 Wavelength Ab so rb an ce
Linearity of Absorbance with dilution of River water showing no Inner Filter Eff ect
100% River water 50% River water 25% River water 12,5% River water 200 250 300 350 400 0. 0 0. 1 0. 2 0. 3 0. 4 Wavelength Ab so rb an ce
Linearity of Absorbance with dilution of Effluent W astewater showing no Inner Filter Eff ect
100% Effluent Wastewater 50% Effluent Wastewater 25% Effluent Wastewater 12,5% Effluent Wastewater 200 250 300 350 400 0.0 0.5 1.0 1.5 Wavelength Ab so rb an ce
Linearity of Absorbance with dilution of Sea water showing no Inner Filter Eff ect
100% Seawater 50% Seawater 25% Seawater 12,5% Seawater
Before Irradiation After Irradiation Before Irradiation – After Irradiation Samp le No.1 (RW) Samp le No.2 (SW) Samp le No.3 (WW ) Fig. 5
Before Irradiation After Irradiation Before Irradiation – After Irradiation
Sample No.1 (RW)
Sample No.2 (SW)
Sample No.3 (WW)
Fig. 6
Before Irradiation After Irradiation Before Irradiation – After Irradiation Sample No.1 (RW) Sample No.2 (SW) Sample No.3 (WW)