Publisher’s version / Version de l'éditeur:
Arctic, 13, 3, pp. 163-177, 1960-11-01
READ THESE TERMS AND CONDITIONS CAREFULLY BEFORE USING THIS WEBSITE.
https://nrc-publications.canada.ca/eng/copyright
Vous avez des questions? Nous pouvons vous aider. Pour communiquer directement avec un auteur, consultez la première page de la revue dans laquelle son article a été publié afin de trouver ses coordonnées. Si vous n’arrivez pas à les repérer, communiquez avec nous à PublicationsArchive-ArchivesPublications@nrc-cnrc.gc.ca.
Questions? Contact the NRC Publications Archive team at
PublicationsArchive-ArchivesPublications@nrc-cnrc.gc.ca. If you wish to email the authors directly, please see the first page of the publication for their contact information.
NRC Publications Archive
Archives des publications du CNRC
This publication could be one of several versions: author’s original, accepted manuscript or the publisher’s version. / La version de cette publication peut être l’une des suivantes : la version prépublication de l’auteur, la version acceptée du manuscrit ou la version de l’éditeur.
Access and use of this website and the material on it are subject to the Terms and Conditions set forth at
The distribution of permafrost and its relation to air temperature in
Canada and the U.S.S.R.
Brown, R. J. E.
https://publications-cnrc.canada.ca/fra/droits
L’accès à ce site Web et l’utilisation de son contenu sont assujettis aux conditions présentées dans le site LISEZ CES CONDITIONS ATTENTIVEMENT AVANT D’UTILISER CE SITE WEB.
NRC Publications Record / Notice d'Archives des publications de CNRC:
https://nrc-publications.canada.ca/eng/view/object/?id=a46ddc0b-8ded-4d10-ad0f-754c98283c2f https://publications-cnrc.canada.ca/fra/voir/objet/?id=a46ddc0b-8ded-4d10-ad0f-754c98283c2f
THE DISTRIBUTION OF PERMAFROST
AND ITS RELATION TO AIR TEMPERATURE
IN CANADA AND THE U.S.S.R.
R. .J. E. Brown*
Distribution and origin of permafrost
P
ERMAFROST is a widespread phenomenon in the northern parts of NorthAmerica and Eurasia, and in Antarctica. Between 40 and 50 per cent of Canada's total land surface of 3.8 million square miles is underlain b y permafrost. The total land area of the U.S.S.R. exceeds 8 million square miles of which 47 per cent is underlain by permafrost (Tsytovich 1958). Because of the great extent of this phenomenon knowledge of its distribution is of vital concern to both countries.
The distribution of permafrost varies from continuous in the north to discontinuous in the south. I n the continuous zone permafrost occurs every- where and is hundreds of feet thick. The continuous zone gives way to the discontinuous zone in which permafrost exists in combination with some areas of unfrozen material. The discontinuous zone is one of transition be- tween continuous permafrost and ground having a mean temperature of above 32°F. In this zone permafrost may vary from a widespread distribution with isolated patches of unfrozen ground to predominantly thawed g r ~ u n d containing islands that remain frozen. In the southern area of this discon- tinuous zone (called the zone of sporadic permafrost in other countries) t h e permafrost occurs as scattered patches, is only a few feet thick, and has temperatures close to 32 O F .
The thickness of permafrost varies with the locality; it is greatest in the Arctic and thins out near its southern limit. In Canada, a t Resolute, Cornwallis Island, N.W.T., it is thought to b e about 1,280 feet thick (Misener 1955); a t Norman Wells, N.W.T. it is about 150 feet thick, and a t Hay River, N.W.T. it is only 5 feet thick. In the U.S.S.R. permafrost exceeds 500 metres (1650 feet) in thickness in the Taymyr Peninsula. In southeastern and south- western Siberia it is less than 25 metres (83 feet) thick (Tsytovich 1958). The origin of permafrost is not well understood, but it is suspected t h a t it first appeared during the cold periods of the Pleistocene. During the sub- sequent periods of climatic fluctuations corresponding changes must have
-Northern Building Section, Division of Building Research, National Research Council. Ottawa, Ontario, Canada.
Reprinted from "Arctic", Journal of the Arctic Institute of North America, Volume 13,
164 PERMAFROST IN CANADA
occurred in the areal extent and thickness of permafrost. As a result it is now degrading in some areas and aggrading in others. For example, Russian workers report that the present southern limit of permafrost in the vicinity of the Yenisey River is many miles north of where it was a century ago. They report also that it is forming under the influence of the present severe climate in some of the recently built-up river islands and bars in northern Siberia
(Muller 1945).
Fig. 1. Southern boundary of permafrost in Canada. After Nikiforoff (solid line), and
Bratsev (dashed line).
Permafrost maps of Canada to 1953
The first map of permafrost in Canada and the northern hemisphere (Nikiforoff 1928) showed the southern limit as a single line (Fig. 1). In the light of present knowledge it contains many errors. In the Yukon Territory the line is far north of the southern limit of permafrost as it is known now. In Ontario just west of James Bay and in western Ungava the line is far south of bodies of discontinuous permafrost.
PERMAFROST IN CANADA 165 Bratsev drew a map in 1939 (Sumgin et al. 1940) showing the "southern boundary of the permafrost district and island of perennially frozen ground in North America" (Fig. 1 ) . This is the earliest known attempt to indicate the presence of permafrost in the Cordillera caused by altitude. As on Niki- foroff's map permafrost is shown in Ontario and western Ungava south of the known occurrences. A large island of permafrost is also shown in south- eastern Saskatchewan.
Fig. 2. Reports of permafrost and its tentative southern limit (solid line) after Jenness,
and southern limit of permafrost (dashed line) after Muller.
The construction of the Alaska Highway and other wartime projects in the North stimulated North American interest in permafrost. I n 1945 S. W. Muller drew a map of its southern boundary in Canada (Fig. 2), which was similar to Bratsev's (Muller 1945). The most notable features in Muller's map are his extending the permafrost boundary in the Cordillera into the northern United States and the omission of the large island of permafrost in southeastern Saskatchewan.
The first Canadian map of permafrost distribution was produced by Jenness in 1949 (Fig. 2). This was the first attempt to base the mapping of
166 PERMAFROST IN CANADA
permafrost on field observations; it included the information from a question- naire sent to northern settlements. His categories comprised continuous and sporadic permafrost. His "tentative southern limit of continuous permafrost" actually lies south of currently known areas of discontinuous permafrost in the Mackenzie River valley and in Ungava. The map did provide, however, a more realistic picture of permafrost distribution in Canada than previous maps. Jenness made no attempt to indicate the presence of permafrost a t high altitudes in the Cordillera.
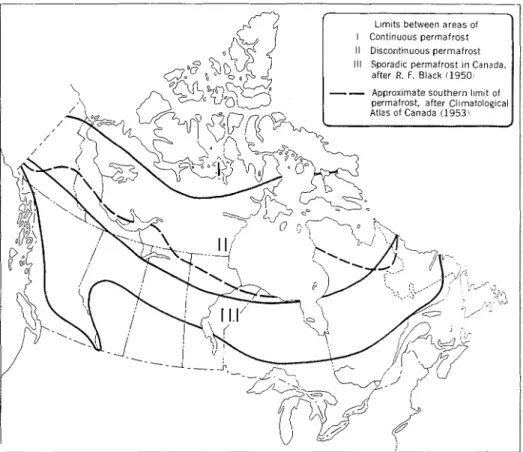
Fig. 3. Zones of permafrost after Black, and approximate southern limit of permafrost after Climatological Atlas of Canada.
In 1950 a map of permafrost distribution by Black (Fig. 3) showed con- tinuous, discontinuous, and sporadic occurrences in the northern hemisphere. I n the preparation of his map Black used information from Russian maps to show the distribution of permafrost in Eurasia (Sumgin et al. 1940, Sumgin and Petrovskiy 1940). Black used the Russian ground temperature criteria to delineate the three zones that were based on the assumed temperature a t
PERMAFROST IN CANADA 167
a depth of 10 to 15 metres (33 to 50 feet) in the vicinity of the depth of zero annual amplitude. This temperature must be less than -5OC. (23°F.) to be considered continuous permafrost, between -5' and -1°C. (23' and 30.2OF.) a s discontinuous permafrost, and above -1°C. (30.2"F.) a s sporadic perma- frost. I n the light of present knowledge the southern limit of continuous permafrost was drawn too far north, particularly in the Eastern Arctic and the southernmost limit was shown too far south.
I n 1953 a map showing the "approximate southern limit of permafrost in Canada" (Fig. 3) was included in the Climatological Atlas of Canada pub- lished jointly by the Division of Building Research, National Research Council and the Meteorological Division, Department of Transport (Thomas 1953). The position of the southern limit coincided with that of Jenness, except at the eastern end of Great Slave Lake. The former map placed the area around the east end of the lake outside of the permafrost region and the latter included this area. Jenness called his line the "tentative southern limit of continuous permafrost" and the Climatological Atlas explained that it delineates a boundary north of which there are some areas free from perma- frost, but of limited extent. This implies that it delineates the southern limit of discontinuous permafrost or that the area north of the line includes at least part of the discontinuous zone. The differences noted on these maps result from the sparsity of field observations of the areal extent and thickness of permafrost and of ground temperatures.
Russian Permafrost mapping
Russian expeditions have made detailed field observations of permafrost in the U.S.S.R. Thousands of excavations, borings, and ground temperature observations have advanced knowledge of the areal extent and thickness of permafrost sufficient for the making of detailed maps.
Between 1927 and 1940 a series of maps of permafrost distribution in the U.S.S.R. was compiled by M. I. Sumgin. His map of 1940 (Sumgin e t al. 1940, Sumgin and Petrovskiy 1940) divided the permafrost region into three zones on the basis of the proportion of frozen to thawed ground in each zone and the soil temperature a t a depth of 10 to 15 metres (33 to 50 feet). T h e delineation of the three zones has been given above in the discussion of Black's map of 1950.
In 1946 V. F. Tumel' published a map of permafrost distribution in the U.S.S.R., which was more detailed than previous Russian maps (Tumel' 1946). His first category comprises areas that are not perennially frozen, b u t lie within the permafrost region. The second is the zone of individual islands of permafrost that do not exceed 15 metres (50 feet) in thickness and exist above the depth of the zone of zero annual amplitude of ground temperature. Because this permafrost is thin and its temperature throughout is near O°C. (32"F.), it is particularly susceptible to degradation and aggradation a n d even total disappearance during short-term fluctuations of the mean annual temperature (during a few to several tens of years). The third is the zone
168 PERMAFROST IN CANADA
of discontinuous permafrost not exceeding 35 metres (116 feet) in thickness. Thawed areas occur, but frozen ground predominates and is older and more stable than that of the second zone. Finally Tumel' divides the continuous permafrost into five subzones having thicknesses of 60, 120,250, 500, and over 500 metres (200, 400, 825, 1650, and over 1650 feet). Very few taliks (un- frozen islands) occur and the permafrost is of great age. Tumel' showed also the location of the -lo, -3O, -5O, and -10°C. (30.Z0, 26.6", 23O, and 14OF.) ground isotherms at a depth of 10 metres (33 feet).
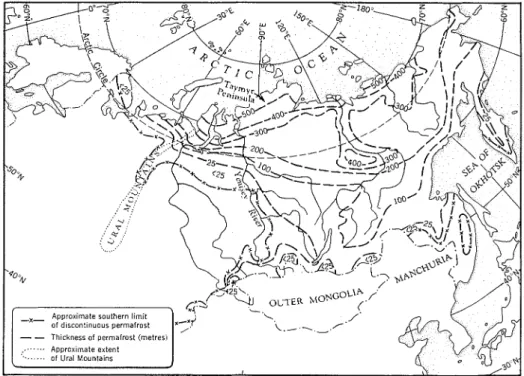
The most recent map of permafrost distribution in the U.S.S.R. was compiled by I. Y. Baranov in 1956 (Tsytovich 1958) and is shown in Fig. 4. In addition to the isopleths of thicknesses of permafrost shown on the map, ground temperatures in the permafrost at the depth of zero annual amplitude were shown by isotherms at intervals of 1 degree from 0" to -10°C. (32' to 14°F.). The presence of permafrost under the Arctic Ocean was also indicated.
-
-
Thickness of permafrost (metres) Approximate extentFig. 4. Distribution of permafrost in the U.S.S.R. (After Baranov).
Current Canadian permafrost mapping
Since 1953 the Division of Building Research has been investigating the distribution of permafrost in Canada. Information has been gathered from a variety of sources, including the technical literature, reports from others
P E R M A F R O S T IN C A N A D A 169 operating in permafrost areas, and by direct field observations. Emphasis has been placed on the determination of the southern limit of permafrost, but observations from the entire permafrost region are also being recorded. For the purposes of compiling a permafrost map observations have been divided into four categories. The first two a r e continuous and discontinuous permafrost as defined a t the beginning of this paper. The third category includes all conflicting reports from the southern areas of the permafrost region. In these localities permafrost has been reported, but is often suspected to be only seasonal frost, which may persist over a period of two or three years and then disappear, or the observation was made early in the summer before the ground had thawed to its maximum depth. Sometimes one ob- server reported "permafrost" and another reported "no permafrost" a t the same locality. The fourth category includes all observations reporting no permafrost.
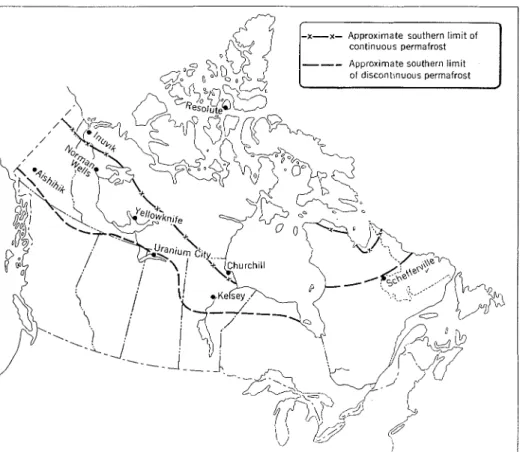
Each category has been given a symbol and the recorded observations have been plotted on the map of Canada. Following this the approximate delimitation of permafrost into two zones -continuous and discontinuous
- has been attempted (Fig. 5).
- -
170 PERMAFROST IN CANADA
Knowledge of permafrost distribution has been influenced by accessi- bility, so that the majority of observations lie on or near transportation routes. As a result there are parts of the ccuntry where information is extensive and others where it is very limited. A permafrost questionnaire has been prepared for distribution to settlements in northern Canada where permafrost is suspected or known to exist. I t includes questions on vegetation, soils, depth of thaw, thickness, and areal distribution of permafrost. The answers to this questionnaire will provide information from new areas and supplement that already existing. The reliability of the information will depend on the ob- server and sometimes be of questionable value. The information will never- theless indicate where future field observations should be made.
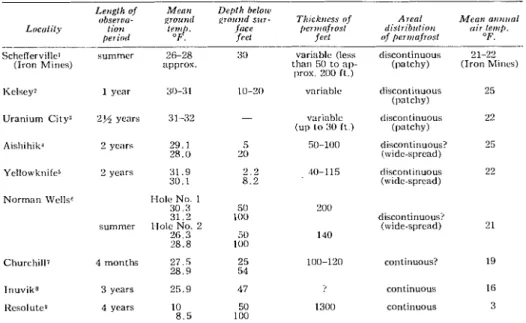
Ground temperature observations in Canada a r e scanty and therefore cannot be used to delimit the two permafrost zones, b u t some ground temper- ature records are available and are presented in Table 1 with information on the areal distribution and thickness of permafrost (see Fig. 6 for the loca- tion of ground temperature installations). More observations are required, however, before the distribution of permafrost can be mapped on t h e basis of thickness and temperature as has been done in the U.S.S.R.
Table 1. Mean ground temperatures in Canada's permafrost region (under natural cover)
L e r r ~ l l r of Men11 D e p l h belotu
obsersn- g r o u i ~ r l grorrird s ~ t r - T l r i c k i ~ c s s of A r e n l M e n 1 1 o n ~ r ~ r o l lioir l ~ n l p . face p e r i ~ ~ n f r o s l d i s l r i b i r l i n ~ r o i r 1e111p.
period OF. f r e l jepl of per111nfros1 OF.
sumrncr 2&28 30 vnriablc (less discontinuous 21-22 appror. than 50 t o a1,- (patchy) (Iron lvlirics)
prox. 200 It.) Scheffervillc' (Iron Mines) liclsey? Uranium City' Aishihikd Ycllowkriife~ Norman Wells" 1 year 2% years 2 years 2 years discontiriuous 25 (patchy) variable ( u p t o 30 I t ) 50-100 discontinuous 22 (patchy) 29.1 2 8 . 0 31.9 3 0 . 1 I-101: No. 1 3 0 . 3 31.2 llole No. 2 2 6 . 3 28.8 2 7 . 5 2 8 . 9 25.9 10 8 . 5 discontinuous? 25 (wide-spread) ~liscor~tinuous 22 (wide-sprcad) discoritiriuous? (wide-spread) 21 3 years 4 years continuous 16 conLinuous 3
1J. D. Ives, McGill Subarctic Res. Lab., Schefferville, P.Q. (Personal Communication). 2 , 3Div. of Buildg. Res., Natl. Res. Counc., Ottawa.
-I Meteor Div., Can. Dept. of Transport.
5 . W i v . of Buildg. Res., Natl. Res. Counc., Ottawa.
75. R. Lange, S.I.P.R.E., Wilmette, Ill., U.S.A. (Personal communication). HDiv. of Buildg. Res., Natl. Res. Counc., Ottawa.
PERMAFROST IN CANADA 171 Permafrost distribution a n d air temperature
Many investigators have made estimates of what mean annual air tem- perature is required to produce and maintain a perennially frozen condition in the ground, but there is much disagreement on this matter. One investi- gator reported that the southern limit of permafrost coincides very roughly with the 0°C. (32°F.) mean annual isotherm (Terzaghi 1952). I n Canada this certainly does not hold true, because this isotherm lies a considerable distance south of known areas of discontinuous permafrost. Another investi- gator reported that the mean annual air temperature required to produce permafrost varies many degrees because of local conditions and suggested that it is generally between 24°F. and 30°F. (Black 1950). I n a climatic hypothesis of the origin of permafrost is was suggested that the southern boundary coincides approximately with the -2°C. (28.4"F.) isotherm (Niki- foroff 1928).
continuous permafrost
---
Approximate southern limit172 PERMAFROST IN CANADA
West of Hudson Bay there is some similarity between the position of the 25°F. mean annual isotherm and the southern limit of permafrost (Figs. 6 and 7). In the Yukon Territory, however, the 30°F. isotherm lies much nearer the approximate southern limit. In Manitoba the known limit of permafrost cuts diagonally from the 25°F. to the 30°F. isotherm. I n Ungava the permafrost limit lies far north of the 25°F. isotherm, but in Labrador there appears to b e some coincidence between this isotherm and the permafrost limit.
L I I
Fig. 5. Mean annual air temperatures. ( O F . ) Prepared by National Research Council
and Canada Department of Transport.
The southernmost occurrence of permafrost reported to date in North America lies on the west shore of James Bay at about 53"N. East and west
of there its southern limit lies farther north. I n Asia the southernmost occurrence of permafrost lies in Manchuria and Outer Mongolia a t 48"N., about 350 miles farther to the south than in Canada. This situation is analo- gous to the geographic location of isopleths of the number of months in the year during which the ground remains frozen at various depths. Three maps
PERMAFROST IN CANADA 173 show the duration of frozen ground at depths of 10, 30, and 120 centimetres
(4,12, and 48 inches) in the northern hemisphere (Chang 1958). The line for the 5-month isopleth a t the 120-centimetre (48-inch) depth is shown in southern Alaska a t 60"N. from where it extends in a northeasterly direction to northern Baffin Island at 73"N. In Asia the same line corresponds more o r less to the southern limit of permafrost and extends southward to nearly 45"N. The same pattern holds for all three of Chang's maps.
It is interesting that the isotherm for the mean annual temperature of -2°C. (28.4"F.) lies south of the permafrost boundary in most of Canada, whereas in the U.S.S.R. it lies considerably south of the permafrost boundary cnly in western Siberia. East of the Yenisey River the southern boundary runs almost d u e south across this isotherm into Mongolia and does not recross i t until just inland from the Sea of Okhotsk. Thus a large part of southern Siberia, northern Outer Mongolia, and Manchuria lies south of the -2°C. (28.4"F.) isotherm and north of the permafrost boundary. The permafrost in this area is patchy and lies so deep that it is not in equilibrium with t h e present climate and must be a relict of a former colder climate. The same situation may have existed in Canada.
Several factors may cause the permafrost to extend so far south in eastern Asia. The land mass is much larger than in North America, resulting i n a more continental climate. The high pressure system over Siberia in winter and the numerous mountain ranges near the coast effectively prevent Pacific disturbances from moving inland. In July the mean monthly air temperatures a r e about the same as in northern Canada. I n January the mean monthly temperatures are 20" to 30°F. lower. This means similar thawing indices i n both regions, but much higher freezing indices, and conditions are thus more favourable for permafrost to form and persist than in northern Canada.
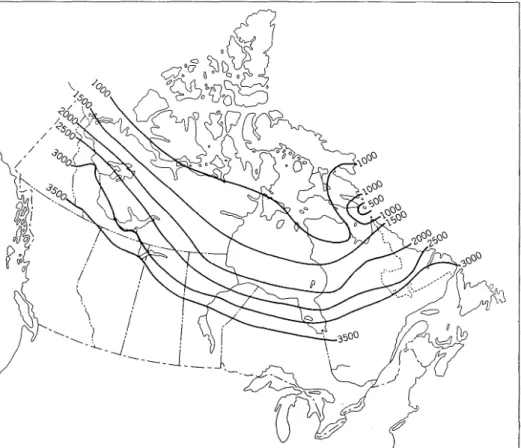
Attempts have been made in Canada to relate permafrost distribution and freezing indices. The freezing index for any locality is the yearly sum of the differences between 32°F. and the daily mean temperature of the days with means below 32°F. In 1954 a freezing index map of Canada using mean daily temperatures for the 10-year period 1941 to 1950 was compiled (Wilkins and Dujay 1954). The map (Fig. 8) shows a similarity in the position of t h e 5500 degree-day freezing index and the southern limit of discontinuous permafrost from the western Mackenzie District to the Manitoba-Ontario border. I n the Yukon Territory and in Labrador-Ungava, however, there is no correspondence.
Because the development and persistence of permafrost is also related to the thawing of the ground it is necessary to consider thawing indices as well (Fig. 9). The thawing index is the yearly sum of the differences between 32°F. and the daily mean temperature of the days with means above 32°F. Taking the freezing index as negative the algebraic sum of the thawing a n d freezing indices divided by the number of days in the year equals t h e departure of the mean annual temperature from 32°F. Therefore a station with high freezing and thawing indices can have the same mean annual temperature as a station with low freezing and thawing indices.
174 PERMAFROST IN CANADA
A station with a high freezing index should have permafrost if its thawing index is low. If its thawing index is high, as in the interior of the continent where the climate is extreme, then summer heating will counteract winter cooling and the formation of permafrost is inhibited. Similarly, a station with a low freezing index can have permafrost if its thawing index is also low, as in maritime localities. This is well shown in Canada by the location of the
Fix. 8 . Freezing indices. Averages for the 10-year period 1941-50. (Wilkins and Dujay. Meteorological Division, Canada Department of Transport).
3500 degree-day freezing index isopleth. I n Fig. 8 this isopleth lies in the southern Yukon Territory where thawing indices a r e near 3000 and where there is discontinuous permafrost. I n central Canada it lies in the neighbour- hood of Regina, Sask., Winnipeg, Man., Lake Nipigon, and Lake Abitibi, where thawing indices exceed 4000 and the southern limit of discontinuous permafrost is hundreds of miles to the north. I n Labrador, however, i t swings northeast to Goose Bay, where the thawing index is about 3200 and the southern limit of permafrost is not many miles distant. The same trend holds t r u e for other freezing index isopleths.
PERMAFROST IN CANADA 175 A marked discrepancy between permafrost distribution and the air temperature regime occurs around Hudson Bay and James Bay. Examination of the annual air temperature map (Fig. 7) reveals that the 30°F. and 25'F. isotherms coincide approximately with the parallels of 51"N. and 53ON. re- spectively, for a distance of several hundred miles east and west of James Bay, and the 20'F. isotherm follows the coastline of Hudson Bay from Churchill. Man. to a point between Great Whale River and Port Harrison, P.Q.
Fig. 9. Thawing indices from mean monthly temperatures (Division of Building Re-
search, National Research Council, 1959).
The southern limit of permafrost, which is marked by the occurrence of palsas with perennially frozen cores (Hustich 1957-8), does not follow this pattern, but lies much farther south on the west side of Hudson Bay t h a n on the east side. Palsas occur along the Attawapiskat River in Ontario a t 53"N. (Sjors 1959). On the east coast of Hudson Bay t h e most southerly occurrence of palsas exists a t 55"2OrN. near Great Whale River, nearly 200 miles farther north than that a t the Attawapiskat River (personal communi- cation from G. B. Faulkner, Dept. of Mines and Technical Surveys, Ottawa).
176 PERMAFROST IN CANADA
Farther east in the centre of the Labrador-Ungava Peninsula permafrost has been encountered as far south as 53"N., but only at elevations close to 3000 feet.
The marked difference in latitude of the most southerly occurrence of palsas with perennially frozen cores on the east and west sides of Hudson Bay and James Bay is caused probably by some other factor than air tem- perature. Hudson Bay seems to have an appreciable effect on t h e amount of silowfall over the region immediately east of it, especially in t h e fall and early winter. Examination of the snowfall records and maps (Thomas 1953) reveals that the snowfall in October to December totals about 60 inches on the east side and only 40 inches on the west side. The insulation provided may help to explain the apparent discrepancy and the conspicuous jump northward of the two permafrost zones in crossing the bays.
Conclusion
I t is evident that there is not a close relationship between permafrost distribution and air temperature. Because so many factors
-
climatic, sur- face, and geothermal -affect the occurrence of permafrost prediction of its distribution cannot be based solely on this one climatic factor. Neverthe- less, examination of the southern limit of permafrost as known at present and of air temperature pattern reveals the existence of a very broad relationship. The mapping of the distribution and the delineation of t h e southern limit of permafrost is a problem with many aspects. What defines t h e southern boundary and how can it best be shown cartographically? Does a pereletok (a shallow spot of frozen ground that persists for several years), which persists for a number of years and then disappears, belong to the permafrost? How many years must a pereletok persist to be classed perennially frozen ground? Can relict permafrost be distinguished from a pereletok in the field? These and other problems make it difficult to locate the southern limit of permafrost.A large number of field investigations of permafrost and observations of ground temperature are required to give detailed knowledge of its areal distribution and thickness for mapping purposes. I11 Canada this work is still in the early stages, but already the general areal distribution of t h e two per- mafrost zones is becoming evident.
References
Benninghoff, W. S. 1952. Interaction of vegetation and soil frost phenomena. Arctic 5:34-44.
Black, R. F. 1951. Permafrost. Smithsonian Inst. Rept. 1950, pp. 273-301.
Chang, J. 1958. Ground temperature. Milton: Harvard University, Blue Hill Meteo- rological Observatory. I, 300 pp.
Hustich, I. 1957-8. On the phytogeography 01 the subarctic Hudson Bay Lowland. Acta geog. 16:l-48.
PERMAFROST IN CANADA 177
Misener, A. D. 1955. Heat flow and depth 01 permafrost at Resolute, Cornwallis Island, N.W.T., Canada. Trans. Am. Gcophys. U. 36:1055-60.
Muller S . W. 1945. Permafrost or permanently frozen ground and related engineering problems. U.S. Army. Strategic Eng. Study No. 62, 231 pp.
Nikiforoff, C. 1928. The perpetually frozen subsoil of Siberia. Soil Sci. 26:61-78. Sjors, H. 1959. Bogs and fens in the Hudson Bay Lowlands. Arctic 12:2-19.
Sumgin, M. I., S. P. Kachurin, N. I. Tolstikhin, and V. F. Tumel'. 1940. General frost studies. Moscow, Izd. Ak. Nauk SSSR., 340 pp. (In Russian).
Sumgin, M. I. and A. A. Petrovskiy. 1947. The importance of electrical methods for studying permafrost. Inst. Merzlotovedeniya. Trudy 5:15-18. (In Russian).
Terzaghi, K. 1952. Permafrost. J. Boston Soc. Civ. Eng. 39:l-50.
Thomas, M. K. 1953. Climatological Atlas ol Canada. Ottawa: Natl. Res. Counc., Div. Buildg. Res. NRC 3151,253 pp.
Tsytovich, N. A. 1958. Fundamentals and foundations on frozen ground. Moscow: Izd. Ak. Nauk SSSR., 167 pp. (In Russian).
Tumel', V. F. 1946. A map of the distribution of permafrost in the U.S.S.R. Merzlotove- deniye 1: 5-11. (In Russian).
Wilkins, E. B. and W. C. Dujay. 1954. Freezing index data influencing frost action. Ottawa: Natl. Res. Counc., Assoc. Comm. on Soil and Snow Mechanics. Tech. Mem. 33: 36-9.