PFC/JA-96-13
Diagnostic Neutral Beam and
Active Spectroscopy Requirements
for the Alcator C-Mod Tokamak
E.S. Marmar, J.L. Terry, W.L. Rowan', A.J Wootton'
May 1996
'Fusion Research Center, The University of Texas at Austin, Austin, TX 78712.
Submitted to Review of Scientific Instruments.
This work was supported by the U. S. Department of Energy Contract No. DE-AC02-78ET51013. Reproduction, translation, publication, use and disposal, in whole or in part
Diagnostic Neutral Beam and Active Spectroscopy Requirements for the Alcator C-Mod Tokamak
E.S. Marmar, J.L. Terry
MIT Plasma Fusion Center, Cambridge, MA 02139 USA W.L. Rowan, A.J. Wootton
Fusion Research Center, The University of Texas at Austin, Austin, TX 78712
Abstract
Considerations are presented on the application of a diagnostic neutral beam to the Alcator C-Mod tokamak for active profile measurements of ion temperature, poloidal and toroidal rotation, impurity and minority species densities, and internal magnetic field. Calculations indicate that, for a typical 50 keV, 0.13 MW hydrogen beam, charge exchange recombination measurements for plasmas with line average densities up to 2.5x 10²⁰ m3 will yield, with good signal to noise and ~1cm spatial resolution, measurements of helium and low Z impurity density profiles with better than 1 ms time resolution, and ion temperature and rotation profiles with -1 ms time resolution. Motional Stark effect measurements appear feasible over most of the operating density range of the device (at least up to 5x 10²⁰ m3), also with ms time resolution. Spatial resolution of the
MSE measurements will depend on the toroidal width of the beam and the angle of the
view with respect to the beam; for a 5 cm wide beam with a 600 viewing angle, 2.5 cm
I. INTRODUCTION
The use of neutral beams, combined with visible spectroscopy, is widely applied to the diagnosis of tokamak plasmas. Local plasma parameters which have been measured with these techniques include low Z impurity densities'3 and impurity transport
coefficients (e.g. reference 4), ion temperature and rotation (e.g. reference 5), internal magnetic field, (and thus current density and safety factor),6-8 and electron density
fluctuations (e.g. reference 9). Recently, the first measurements of the energy distribution of slowing-down D-T fusion alpha particles have been reported.'0
Alcator C-Mod is a high field, compact tokamak (B 9T, R = .67m, a = 0.22m), which operates over a large range of plasma density, up to IX 1021 m73. In considering the possible applications for active spectroscopy with a neutral beam on this device, several issues must be addressed. In particular, because of the very high densities, combined with relatively large line integral density (up to 2x10²⁰ m72 for perpendicular injection along the
horizontal midplane), beam attenuation and competition from bremsstrahlung continuum to measured spectroscopic signals are particularly important. In many ways, this is similar to the situation which will be encountered on devices such as ITER, where similar or slightly higher line integral densities would be expected, albeit at much lower density and
larger minor radius. A treatment of many of the issues relevant to this topic for ITER can
be found in reference 11.
On Alcator C-Mod, the addition of a diagnostic neutral beam and the associated spectroscopic and neutral particle diagnostics should lead to the enhancement of profile measurement capabilities for ion temperature, plasma rotation, and low Z impurity
concentrations, including He, B, C, N, 0 and Ne. Ion temperature profiles in the plasma core are presently available from high resolution X-ray Doppler spectroscopy,12 using
injected argon. Charge exchange recombination spectroscopy (CXRS) measurements promise better spatial and temporal resolution, along with increased rotation sensitivity. Low Z impurity core density profiles cannot be obtained by any means at present on C-Mod, and their measurements will be important adjuncts to many experimental investigations, including divertor impurity screening (He, N, Ne) and ICRF heating ('He minority concentration). Two additional important applications will be to measure internal
magnetic field (and thus q profiles) via the Motional Stark effect (MSE) and to measure
fluctuations via beam emission spectroscopy (BES). In both of these cases, it is the radiation resulting from excitation of beam neutrals which is observed. For CXRS, the cross section for population of the desired upper level in the H-like ion is a strongly decreasing function of interaction energy. As a result, even though beam attenuation is
significant, the optimum energy for CXRS, on C-Mod, is in the range from 50 keV/AMU
to 60 keV/AMU for hydrogenic beams. The excitation cross sections for MSE and BES are weaker functions of neutral energy than for charge exchange recombination, and as a result, somewhat higher energy would be optimum for measurements into the core of the
highest density plasmas (-100 keV). Nevertheless, good signal to noise MSE
measurements are feasible at 50 keV. C-Mod current density profiles are presently
diagnosed using lithium pellet imaging and polarimetry; this has the disadvantage of being
available at 1 or 2 time points in a discharge. The potential for BES measurements of fluctuations on C-Mod are discussed elsewhere in these proceedings."
II. CHARGE EXCHANGE RECOMBINATION SPECTROSCOPY
We first consider CXRS measurements of impurity density, ion temperature and rotation profiles. In all cases presented in this paper, the plasma has been modeled as follows: R = .67m, a = .22m, Ti = Te = 4-[l-(r/a)2 2 keV, ne
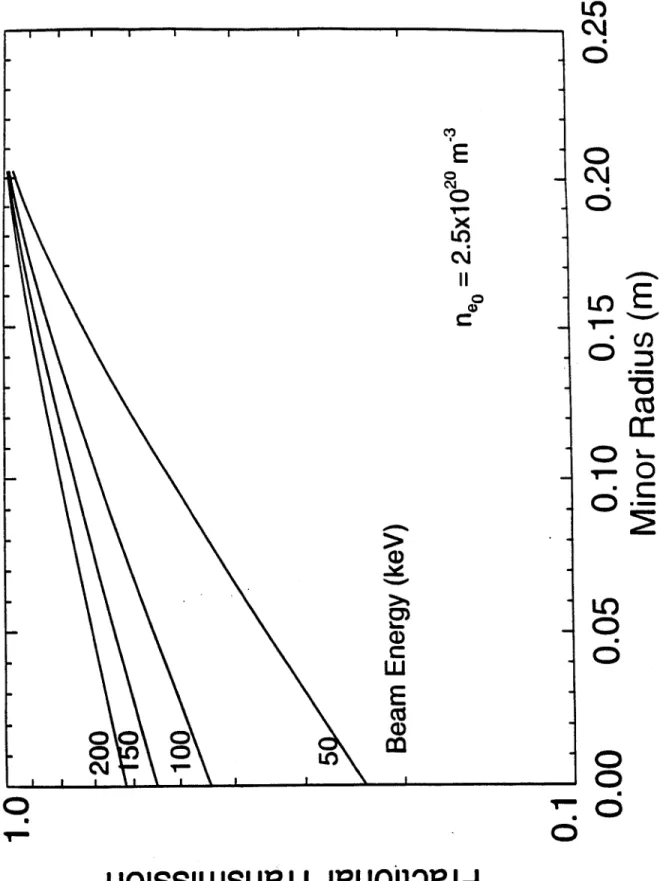
= no-[1-(r/a)2]'m, Zef = 1.5. Figure I shows the results of penetration calculations for a range of neutral hydrogen beam energies, assuming perpendicular injection along the midplane. The plasma parameters used are those of an intermediate density case, with central density no = 2.5x10²⁰ m". For the beam attenuation calculations, ionization due to electron impact," proton impact,1-,16 and charge exchange 7 have been taken into account. Helium
is often injected into C-Mod plasmas, both for impurity studies and for the primary ICRF heating scheme at 8 tesla (3He minority at 80 MHz). As a result, we will consider fully stripped helium to be the ion which captures an electron from the neutral hydrogen in the beam. The emissivity in the H-like He line of interest is given by:
E
= fiefH,(av)ce
phlm 3/s/nm, (1)VIL, AAD
where (a v)cx is the effective rate for emission of the n = 4 -+ 3 transition at X = 468.6 nm, taken from reference 5, v&i is the neutral velocity and AXD is the Doppler
width due to the ion thermal distribution. The neutral beam is assumed to deliver an equivalent current density of 103 amp/m2
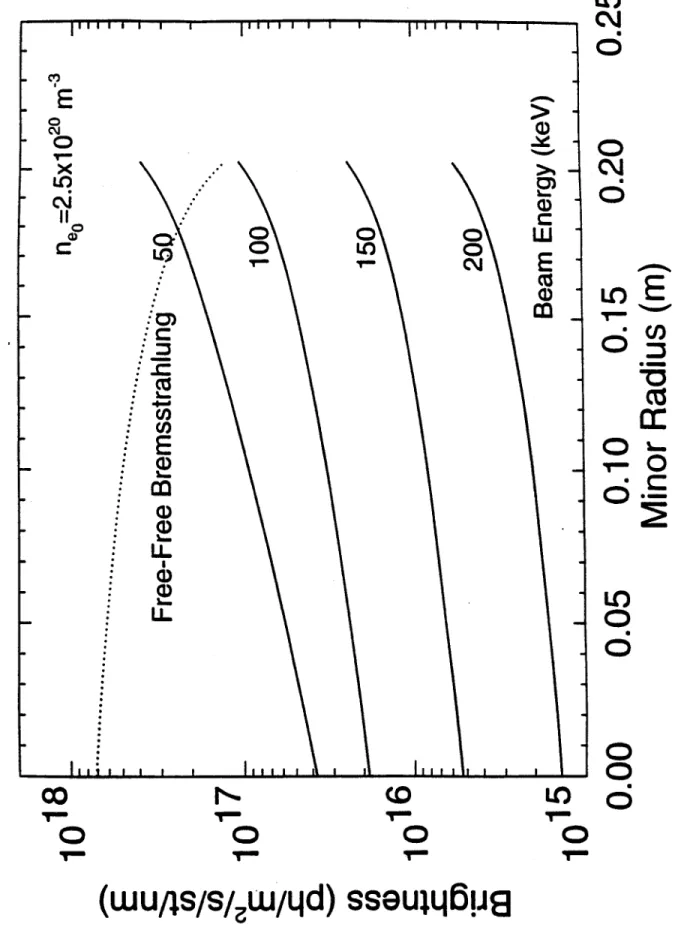
in the full energy component (before plasma attenuation), independent of beam energy, with a cross-section of .05x.05 m2. At 50 keV, this corresponds to a beam power of 0.13 MW. These parameters are similar to those of the neutral beam which was formerly used at the TEXT tokamak facility, and plans are being made to transfer this beam to MIT for installation at C-Mod. The main difference is that the Texas beam has a slightly larger foot print (-8 cm wide at the focus), as described in more detail in reference 13. For a detection geometry where the optics view the beam tangentially at the plasma axis, the line brightnesses which would result are shown in
figure 2. For comparison, the continuum brightness, due to free-free bremsstrahlung,18 is
also shown. In the center of the plasma, the continuum will be more than 1 order of magnitude brighter than the CXRS signal. In order to pull the signal out of this background, it will be necessary to modulate the DNB.
The signal to noise ratio of the measurement is fundamentally limited by the fluctuations in the signal.3 The minimum level of these fluctuations is determined by
photon statistics. In order to estimate this, it is assumed that the optical system has an
etendue of 2x10⁷ m2.st (determined by the spectrograph), and an overall transmission and
detection efficiency (mirrors, fibers, lenses, detectors) of 1%. To measure the density of helium in the discharge, we integrate over the Doppler broadened spectrum of the line; at T,= 4 keV, the full width at half maximum will be -1 nm. In general, the signal to noise
SNR = , (2)
2(2 Svb + SCx)
where Sex is the charge exchange signal, S is the continuum signal (both in photon/s) and t is the integration time. The factors of 2 in the denominator result from the need to
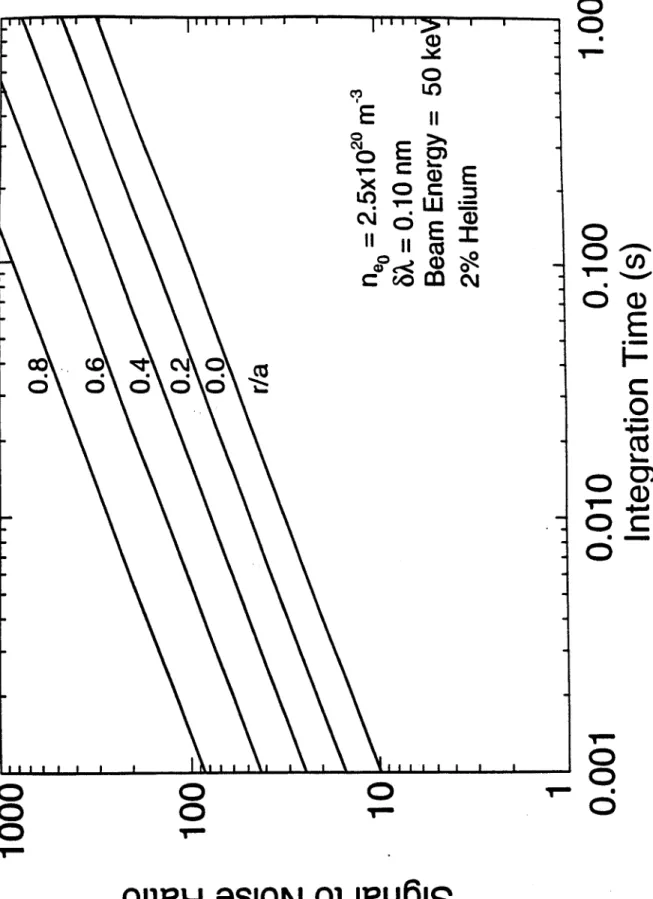
modulate the beam, assuming a 50% duty factor. To measure the ion temperature, as well as rotation along the viewing direction, it is necessary to measure the spectral width and shift; this requires an increase in the spectral resolution of about a factor of 10, and a corresponding reduction of the signal in each spectral channel. Figure 3 shows the results of calculated signal to noise ratios (from equation 2) for an ion temperature measurement assuming that the helium density is 2% of the electron density. The plot shows the expected SNR at 5 different minor radii, from the axis out to r/a = 0.8. Note that even for
the core measurement, reasonable signal to noise can be expected with an integration time of 1 ms. The rapid improvement with increasing r/a results from two effects: both the beam attenuation and the visible continuum brightness are decreasing. While helium is used in this example, the measurements could also use intrinsic boron or carbon, which are the dominant intrinsic low Z impurities in C-Mod. Typical densities of carbon are 0.5% of
ne; the decrease in ion density is just about balanced by the combination of decreased
Doppler width and increased charge exchange population of the upper level.519 As a
result, the signals for He or C will be approximately the same.
III. MOTIONAL STARK EFFECT
The final diagnostic application of the C-Mod DNB considered here is the
(MSE). As the high energy neutrals traverse the plasma, crossing the magnetic field, the
atoms, in their rest frame, experience an electric field, E = v x B. The resulting Stark effect shifts the energy levels in the atom, and line emission (e.g. from Balmer-a) is split into multiple components. The various lines are also polarized, depending on the relative directions of v x B and the optical view.3'.'7
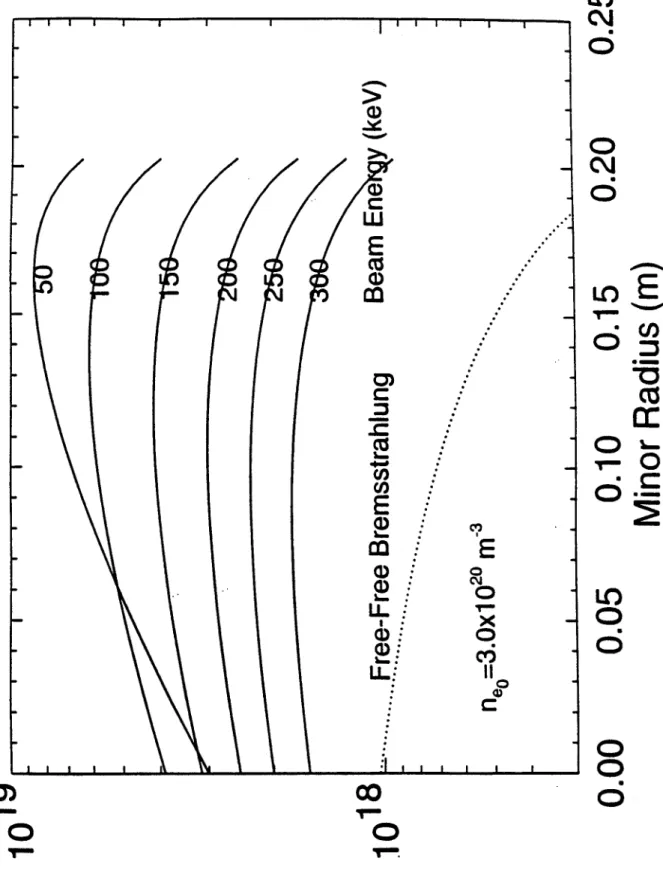
In order to see a component of the poloidal magnetic field, as well as to provide a Doppler shift to move the lines spectrally away from the edge neutral emission, it is necessary that the view of the beam must be neither tangent to the toroidal direction nor perpendicular to beam. Since beam attenuation remains as an issue for MSE, and C-Mod port access also dictates it, we again assume perpendicular injection along a major radius in the midplane. The viewing angle with respect to the beam is taken to be 60. Figure 4 shows the results of a simulation, similar to those done for CXRS, giving the brightness in the central, unshifted a component of H,. In this case, a central density of 3x10²⁰ is used.
The spectral width is determined by the Doppler broadening; here we assume this is dominated by the viewing cone for each spatial channel, taken to be ±0.8 degrees. The excitation cross-section, which for these energies is dominated by charge exchange and
proton impact, does not fall as rapidly with increasing neutral energy as the CXRS rates.
Consequently, because of the improving beam penetration, it would be advantageous to
go to energies somewhat higher than 50 keV. However, even for 50 keV, at this density
the central signal is a factor of 2 higher than the bremsstrahlung continuum for the chord
intersecting the beam at r/a = 0. The measurement itself requires splitting the light into
factor of 0.25). Figure 5 shows the resulting SNR for the on-axis measurement as a function of central density, assuming 1 ms integration time. Measurements thus appear feasible for MSE, even up to very high densities, with excellent time resolution. One caveat is that these calculations do not take into account the collisional depopulation of the upper level before radiative decay. According to calculations by Zinov'ev and Korotkov,'9 this will be about a factor of 5 effect in going from 100 to 10" m-.
IV. SPATIAL RESOLUTION
Spatial resolution is also an important consideration for all of the measurements. Because the CXRS measurements can be made viewing nearly tangentially, or vertically, the spatial resolution that results is fundamentally limited by the ratio of the beam width to the major radius (for the tangential view) or by the ratio of the beam height to the minor radius (for the vertical view). Both views are necessary in order to measure the toroidal and poloidal components of rotation. For MSE, the situation is complicated by the fact that, as already discussed, the toroidal view cannot be tangent to the flux surfaces, since
the angle of the total field with respect to toroidal, and thus the poloidal field, could not
then be measured. For a given beam width, w, with perpendicular injection, the spatial
resolution is limited to w cot(e), where
e
is the angle between the view and the beam direction. Thus, for 60 degrees, the resolution will be 0.58w, which, for a 5 cm beam, isresolution, but at the cost of having the measurable component of field angle becoming too small.
In principal, it might be possible to infer the poloidal field from a measurement of the total local field profile, which is available from the Stark shifts, rather than the polarization measurements. Because the field magnitude is given by
B+B
, the required accuracy for the total field measurement is very demanding. For typical C-Mod plasmas, B, is in the range from 0 on axis, to a maximum of about 0.2-BT. Measurement of a detailed q profile requires field angle profile measurements with roughly 0.2 degree accuracy, implying that the total field must be measured with an uncertainty of only a few parts per thousand. While this may be possible, there is a further complication. The diamagnetic effect of the plasma reduces the toroidal field. The magnitude of this effect,which is proportional to the plasma
#,
is very similar to that of the poloidal field on themagnitude of B. Measurements using MSE, of the total field magnitude profile on JET, have been reported by Wolf, et al.20 In that case, nominal current profiles were assumed and the measurements were used to infer the pressure profile through the plasma diamagnetism. However, with sufficiently accurate kinetic pressure profile measurements, it may be possible to use this approach to measure, or at least to constrain, the current
density profiles in equilibrium reconstructions. If this is possible, the measurements can be
made with a purely tangential view, and significant improvement in spatial resolution would result.
ACKNOWLEDGMENTS
This work supported by U.S.DoE Contract No. DE-AC02-78ET51013 and Grant No. DE-FG03-94ER-54241.
REFERENCES
1. R.C. Isler, Phys. Rev. Lett. 38(1977) 1359.
2. A. Boileau, et al., Plasma Phys. Contr. Fusion 31(1989)779.
3. M.G. von Hellerman and H.P. Summers, in Atomic and Plasma-Material Interaction Processes in Controlled Thermonuclear Fusion, R.K. Janev and H.W. Drawin (editors),
Elsevier Science Publishers, Amsterdam, 1993, page 45.
4. E.J. Synakowski, et al., Phys. Rev. Lett. 65(1990)2255.
5. R.J. Fonck, et al., Phys. Rev. A 29(1984)3288. 6. F. Levinton, et al., Phys. Rev. Lett. 63(1989)2060.
7. D. Wroblewski and L.L. Lao, Rev. Sci. Instrum 63(1992)5140. 8. R.C. Wolf, et al., Nucl. Fusion Lett. 33(1993)663.
9. R.D. Durst, et al., 1992, Rev. Sci. Instrum. 63(1992)4907. 10. G. McKee, et al., 1995, Phys. Rev. Lett. 75(1995)649.
11. E.S. Marmar, Active Spectroscopic Diagnostics for ITER Utilizing Neutral Beams, Proceedings of the International School of Plasma Physics "Piero Caldirola" Workshop
on Diagnostics for ITER, in Diagnostics for Experimental Thermonuclear Fusion Reactors, Edited by Peter E. Stott, Guiseppe Gorini and Elio Sindoni, Plenum Press, New
York, 1996, page 281.
12. J.E. Rice and E.S. Marmar, Rev. Sci. Instrum. 61(1990)2753.
13. W.L. Rowan, et al., I 1th High Temperature Plasma Diagnostics Conference, Monterey, CA, 1995, paper P1.07, submitted to Rev. Sci. Instrum.
14. R.K. Janev, et al., Elementary Processes in Hydrogen-Helium Plasmas,
Springer-Verlag, Berlin, 1987.
15. W.L. Fite, et al., Phys. Rev. 119(1960)663.
16. H.B. Gilbody and J.V. Ireland, Proc. Roy. Soc. A-277(1964) 137.
17. E.L. Freeman and E.M. Jones, Atomic Collision Processes in Plasma Physics Experiments I, UKAEA Report CLM-R137, Culham Laboratory, Abingdon, England,
1974.
18. K. Kadota, et al., Nucl. Fusion 20(1980)209.
19. A.N. Zinov'ev and A.A. Korotkov, JETP Lett. 50(1989)306.
10
C?~
E
o
x
O6-LO
c J
II-o
E
C 1" Z-0
U))10
C 0 00
0
C
oO
o
C\l
T
UQ!SS!WSUBJ I
jeIOijd
E
0 C| -0C
c
Chl,
Co 1 CO)E
Ca U_ U_ 1 oLL
,
1, .
1 0LO 1 . II..(0
1(wu/is/s/,w/qd) sseujq6!jS
Figure 2. Brightness in the He' (n = 4 to n = 3) transition at X = 468.6 nm, as a function of
minor radius, for 4 different neutral energies. The continuum due to free-free
ICO
C'4
6
CD
N
Co
W
0..
4
.
E
LO 1o . I I I,-0
*--Cz
0
cc0
0:
0O
E
I-)Em
oEEc
E
iD
CO
00 0Eo
~0E~0
O
I-00
cCD
CD
0161e-d 9s!G0N 01 POu$!S
Figure 3. Signal to noise ratios as fuinctions of integration time for ion temperature measurements using He*. The curves are parameterized by the normalized minor radius.
I ~ I I ~-..- I---I /~~ LU
E
E
U-L: CI,E
0x
Cf)I
o
0
(wu/js/s/,w/qd) sseujq~pq
Figure 4. Calculated Balmer-a brightnesses as functions of minor radius for 6 different
beam energies. Note that even for this relatively high density (3x10²⁰ m-3), the signal with
. # I
I
1O
0
65
0
0
C')0
IC;
0
CDJ
LO-6r
05
65
1 ILOT I CO,