Automating Data Extraction from Prescription
Document Images to Reduce Human Error
by
Lisa Zahray
Submitted to the Department of Electrical Engineering and Computer
Science
in partial fulfillment of the requirements for the degree of
Masters of Engineering in Electrical Engineering and Computer Science
at the
MASSACHUSETTS INSTITUTE OF TECHNOLOGY
June 2019
c
○ Massachusetts Institute of Technology 2019. All rights reserved.
Author . . . .
Department of Electrical Engineering and Computer Science
May 22, 2019
Certified by . . . .
Matt Pokress
VP of Engineering
Thesis Supervisor
Certified by . . . .
George Verghese
Professor of Electrical and Biomedical Engineering
Thesis Supervisor
Accepted by . . . .
Katrina Lacurts
Chair of Master of Engineering Thesis Committee
Automating Data Extraction from Prescription Document
Images to Reduce Human Error
by
Lisa Zahray
Submitted to the Department of Electrical Engineering and Computer Science on May 22, 2019, in partial fulfillment of the
requirements for the degree of
Masters of Engineering in Electrical Engineering and Computer Science
Abstract
Manual data entry from a form into a database is a time consuming and error-prone task. In the case of prescription documents, errors are especially important to avoid in order to protect patients’ health and safety. This project discusses the design and evaluation of a system that automates portions of data entry workflow, focusing on prescription information originating from fax forms. The first part of the thesis dis-cusses the approaches used for faxes of a known format, using techniques including denoising, deskewing, template matching, and handwritten digit recognition. One successful task in this area was checkbox detection to identify whether prescriptions were renewed or denied. The second part of the thesis focuses on faxes of unknown formats, utilizing optical character recognition (OCR) technology and a customized implementation of an approximate string matching algorithm. Customer and pre-scriber information were extracted with high accuracy, and drug name extraction was investigated with suggestions for further improvement.
Thesis Supervisor: Matt Pokress Title: VP of Engineering
Thesis Supervisor: George Verghese
Acknowledgments
I would first like to thank my company supervisor, Matt Pokress, who helped me select my project and guided me throughout my 6-A internship. He ensured I had many opportunities to learn about the company and the pharmacy industry as a whole.
Next, I’m extremely grateful for Zac Warren and Marc Krull, who were very in-volved throughout my research. This thesis builds off of work Zac had previously done investigating customer name matching in faxes. Zac closely mentored me throughout my internship, frequently coming up with new ideas for me to try and helping me further investigate the problem we were trying to solve. He always made himself available when I had a question, willing to dedicate large chunks of time to me. Marc helped keep me on track throughout my work, often reminding me of the big picture. Zac and Marc’s support was instrumental to my thesis.
I would also like to thank everyone at my 6-A company. There were many people who pitched in ideas and gave me different perspectives on this project. I learned so much from my internship thanks to everyone at the company’s patience and excite-ment to engage with me about new ideas.
Kathy Sullivan and Tomas Palacios with the 6-A program were very helpful when I ran into any difficulties throughout the process of the program, and I’m grateful for their support.
Lastly, I would like to give a special thanks to my faculty supervisor George Verghese. Professor Verghese has been my academic advisor since I started Course 6 as an undergraduate. When I mentioned I was having trouble finding a faculty supervisor for my thesis, he immediately volunteered. He met with me whenever I was stuck or needed a push forward writing up my work, offering suggestions and moral support. He has gone above and beyond his role of my academic advisor, and I’m so thankful for everything he’s done for me during my time at MIT.
Contents
1 Introduction 13
1.1 Overview . . . 13
1.1.1 Problem . . . 13
1.1.2 Thesis Organization . . . 15
1.1.3 Contributions of this Thesis . . . 16
1.2 Literature Review . . . 16
1.2.1 Prescription Errors . . . 16
1.2.2 Automatic Form Reading . . . 17
2 Known Format: Introduction 19 2.1 Overview . . . 19
2.2 Literature Review . . . 20
2.2.1 Hough Transform . . . 20
2.2.2 Checkbox Detection . . . 23
2.2.3 Handwritten Digit Recognition . . . 24
2.2.4 Convolutional Neural Networks . . . 25
3 Known Format: Methods and Results 27 3.1 Preprocessing . . . 27
3.1.1 Denoising . . . 28
3.1.2 Deskewing . . . 29
3.2 Checkbox Detection . . . 29
3.2.2 Results . . . 30
3.3 Digit Recognition . . . 30
3.3.1 First Attempt: Basic Single Digit Recognition . . . 31
3.3.2 Second Attempt: Synthetically Modified Training Data . . . . 33
3.4 Discussion . . . 35
4 Unknown Format: Introduction 39 4.1 Overview . . . 39
4.2 Literature Review . . . 40
4.2.1 Optical Character Recognition (OCR) . . . 40
4.2.2 Approximate String Matching . . . 41
5 Unknown Format: Methods and Results 45 5.1 Approximate String Matching . . . 45
5.1.1 Motivation for Custom Implementation . . . 45
5.1.2 Description of Code Structure . . . 46
5.2 Optical Character Recognition . . . 49
5.3 Information Extraction and Results . . . 50
5.3.1 Customer and Prescriber Matching . . . 51
5.3.2 Drug Matching . . . 53
5.3.3 Highlighting . . . 54
6 Conclusion 57 6.1 Summary . . . 57
List of Figures
1-1 Basic document entry process at our pharmacy . . . 14 2-1 Checkbox portion of form . . . 19 2-2 Hough transform example. Note that in the lower image, the blue,
purple, green, and orange sinusoids all share a common intersection point because those pixels lie on a common line. The red sinusoid does not share this intersection. . . 22 3-1 Probability distributions over refill amounts for training images used in
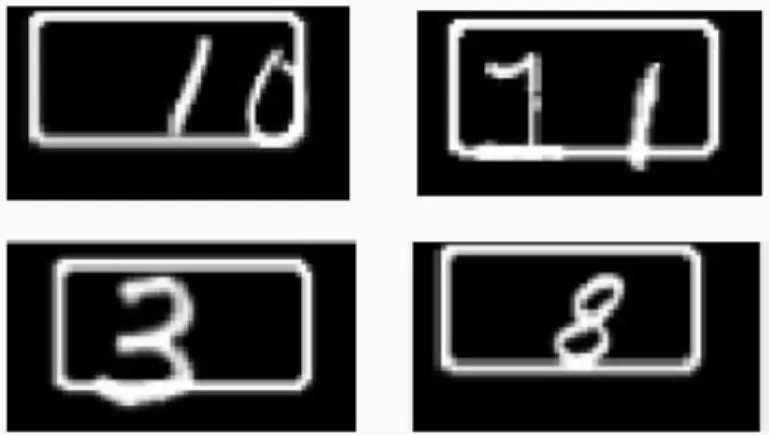
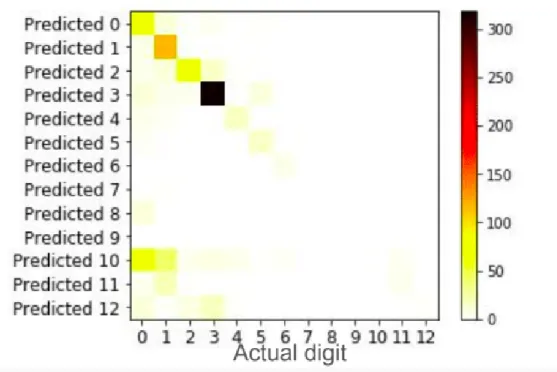
Attempts 1 and 2. Attempt 2 includes the double digit refill amounts 10, 11, and 12. . . 32 3-2 Synthetically modified digits . . . 34 3-3 Digit Guess Results for Attempt 2, showing relationship between ground
truth and guessed digits . . . 36 3-4 Examples of Unexpected Handwritten Digit Representations . . . 37 4-1 Comparative frequency of data-entry error types for faxes of unknown
format . . . 40 4-2 Example of the Wagner Fischer algorithm for the strings "pizza" and
"piztzo". Each matrix element shows its weight as well as a pointer to the element used in calculating its weight. The optimal path is highlighted in blue, with the final element in purple with Levenshtein distance of 2. . . 43 5-1 Highlighting Example . . . 55
List of Tables
5.1 Custom weighting scheme used for approximate string matching. The replacements are bidirectional. All other edit costs are 1. . . 47 5.2 Customer and Prescriber results on 403 test faxes . . . 53
Chapter 1
Introduction
Human error when entering information from a document image into a computer database is unavoidable. These errors can be especially dangerous when dealing with prescriptions, as an incorrect drug or dosage can have severe health implications for the patient. Besides being prone to error, manual data entry processes can also be time intensive. This project explores several methods to improve data entry of pre-scription information from faxes for the purposes of increasing efficiency and reducing errors. We focus on the workflow, error statistics, and prescription data from a re-tail pharmacy that receives documents from many different prescribers across the US and ships the medications to patients. Throughout this paper, we will refer to this pharmacy simply as "our pharmacy." Statistics and data presented specific to our pharmacy were obtained between June and December 2017.
This chapter discusses the context for this project, as well as a literature overview of various systems that tackle similar problems.
1.1
Overview
1.1.1
Problem
Our pharmacy must process thousands of incoming documents each day. A document is first manually sorted, where it is assigned to a customer and a document type (i.e.
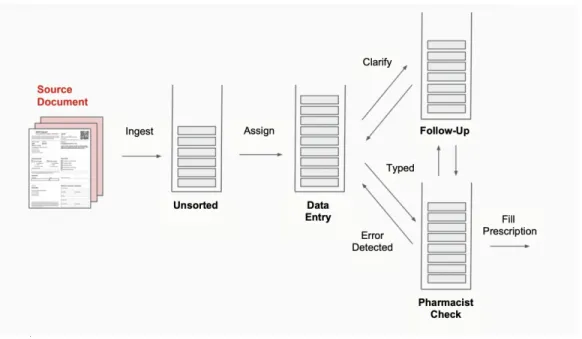
renewal of an old prescription vs. new prescription). The information contained in the document is then entered by a data entry technician, and next sent to a pharmacist to be double checked. There may be errors either in the data typed by the data entry technician, or in the prescription itself due to a prescriber mistake. If there are any errors with data entry, the pharmacist sends it back to be retyped, and the process repeats. If there are errors in the prescription itself, a followup with the prescriber may be necessary. Figure 1-1 shows a diagram of this entire process.
Figure 1-1: Basic document entry process at our pharmacy
This amount of human involvement is both time-consuming and error-prone. This thesis targets errors that occur in the sorting and data entry phases of the process. On average, 4.4% of prescriptions are initially entered with errors that must then be corrected by a pharmacist. The top three types of errors that occur (besides the "other" category) are drug, prescriber, and sig line. A sig line consists of the doctor’s instructions, time(s) to take the medication, and dosage. Together these three error categories make up just over 40% of all of our pharmacy’s data entry errors. Therefore, a system that extracts even a small amount of information from these forms could have a large impact.
Our pharmacy receives different types of prescription documents, where two main categories are faxes and electronic prescriptions. At our pharmacy, faxes make up
36.1% of prescription documents. The error rate for faxes is over 1.8 times higher than that of electronic prescriptions. 4.9% of faxes are initially typed with errors compared with 2.7% of electronic prescriptions. This project therefore focuses on extracting information from fax documents.
Automatic form reading could help by automating processes with low risk and adding an extra level of error-checking to improve quality. Document processing techniques such as denoising, optical character recognition (OCR), handwriting recog-nition, and template matching are well-researched. The goal of this project is to use these techniques to build and test a system that extracts prescription information from fax documents.
1.1.2
Thesis Organization
This thesis groups forms into two types: known format and unknown format.
Forms of known format are created and sent out by our pharmacy, specifically to request prescription renewals. Knowledge of these forms’ format can be used to locate information of interest. Chapter 2 introduces these forms in more detail and provides a literature survey of techniques relevant to data extraction. Chapter 3 explains our approach to data extraction for these forms, and discusses the results of testing these methods.
Forms of unknown format, on the other hand, contain information in unknown locations on the form. One example of such a document is a form specific to a pre-scriber’s office. These forms require different techniques for data extraction. Chapter 4 outlines this problem in more detail and presents a literature review of relevant techniques. Chapter 5 discusses our approach and results.
Finally, Chapter 6 summarizes the results of the thesis and makes suggestions for further study.
1.1.3
Contributions of this Thesis
This thesis provides data extraction results for image processing techniques applied to a dataset of real prescription fax forms. Additionally, it includes discussions and suggestions surrounding design, data collection, and workflow choices that could lead to further improvements in automation viability, performance, and utility.
For forms of known format, checkbox detection was successful as a task to quickly sort forms by prescription category. This technique could also be used to check whether a required signature is present on prescription renewal forms. Handwritten digit detection for number of refills was not as successful. Successes and difficulties encountered in these tasks may be useful to consider when designing future fax forms, in order to improve ease of computer recognition.
For forms of unknown format, we achieved high accuracy for customer matching, and promising results for prescriber matching. Drug matching was a more challenging task, where success was difficult to measure, in part due to the type of data available. We suggest possibilities for further study, including data acquisition that could be useful to performing this task. We also make suggestions, based off discussions with experienced data-entry technicians, for how this technology could be implemented in data-entry workflows.
1.2
Literature Review
This section presents studies related to prescription and medical errors, as well as studies comparing human data entry with more automated processes.
1.2.1
Prescription Errors
Shulman et al. [1] compared medication errors (MEs) in an intensive care unit when using handwritten prescribing, and that same intensive care unit when using a com-puterized physician order entry (CPOE) system without decision support. Examples of error types include omitted dose/units/frequency on prescription, dose error, and
prescription not signed. The introduction of CPOE significantly reduced the propor-tion of MEs, indicating that computerized prescribing has benefits over handwritten prescribing. Some potential benefits suggested were increased standardization, legibil-ity, and specification of important data fields. This finding aligns with our pharmacy’s data showing more errors in fax documents than electronic prescriptions.
Teagarden et al. [2] published an analysis of dispensing error rates of a mail-service pharmacy in 2005. All errors observed occurred in the phase where the prescriptions were entered into the pharmacy system, and none occurred in the automated mechan-ical dispensing phase. The authors point out data-entry as a process that is manual and vulnerable to error. To quote their conclusion, "all errors occurred where human involvement was most concentrated, and none occurred where automation was most concentrated." Our pharmacy functions similarly to Teagarden’s in terms of the pro-cess from prescription to medication shipment. This study supports the motivation to explore automation of the data-entry phase of pharmacy workflow.
1.2.2
Automatic Form Reading
Techniques for automated forms processing have been improving at an accelerating rate, especially with the shift to machine learning. Examples of these techniques include optical mark recognition (OMR), optical character recognition (OCR), and handwriting detection. These techniques and others will be discussed in further detail in the next chapters.
Automation for form reading has been examined in healthcare settings before. Paulsen et al. [3] studied the viability of automatic forms processing as an alternative to manual data entry for patient questionnaire forms. The forms in the experiment were highly structured, containing only checkboxes and numerical codes. The results show that automated forms processing performs better than single-key data entry (in which a human enters the data only once), and does not perform differently than double-key data entry (in which a human enters the data twice). This supports that automated forms processing can be a valid alternative to human data entry for healthcare-related documents.
Chapter 2
Known Format: Introduction
2.1
Overview
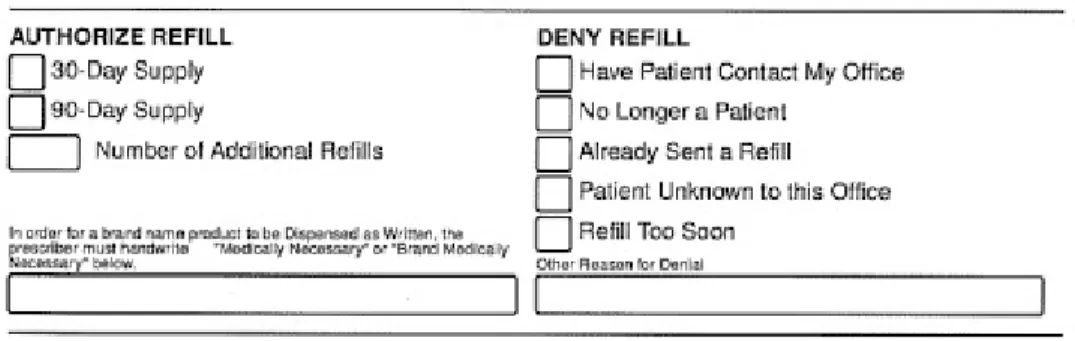
A prescription permits a specified number of refills; when these refills are used up, our pharmacy faxes a renewal request form to the prescriber. The prescriber then fills out the form by hand and faxes it back to our pharmacy. Figure 2-1 shows the section of the form we are interested in. We would like to know:
∙ If the renewal was authorized or denied (checkbox)
∙ If authorized, whether the refill is a 30-day or 90-day supply (checkbox) ∙ If authorized, how many additional refills are allowed (handwritten digit) ∙ Whether a signature is present
Other information such as drug, patient, and prescriber is already accounted for in a barcode on the form.
In attempting to extract information from renewal request forms faxed from pre-scribers, we can take advantage of knowing the form’s layout in advance. However, the task is more complicated than simply looking at exact pixel locations in an image. When faxed documents come in, they may be skewed at odd angles and scaled differ-ently than the original version. Additionally, they can have noise that interferes with the information we would like to extract. In particular, for certain types of noise, it can be difficult to differentiate between an intentional tick mark and noise inside the checkbox. And while recognizing handwritten digits is a largely solved problem, it is non-trivial to detect the exact location of the written number. Furthermore, doctors don’t always write completely within the lines of the box, leading to line interference with the digit(s).
In the following section, we explore existing strategies to tackle similar problems, and discuss the technical details of techniques that will be useful.
2.2
Literature Review
In this section, we provide an overview of topics and methods that are relevant to processing data on fax forms of known format.
2.2.1
Hough Transform
The Hough Transform is a method to robustly detect lines in an image, first introduced by Paul Hough in a 1962 patent [4]. Duda and Hart [5] further developed upon this algorithm, creating a version that is often used in image processing. The image is first thresholded to contain only black and white pixels. To maintain consistency with Chapter 3, the convention for this section is that white pixels (higher-valued pixels) correspond to features such as text and lines on the image, and black pixels (lower-valued pixels) correspond to the background. Note that this is the reverse of a typical text document.
goes through (𝑥, 𝑦) can be written as
𝑦 = 𝑚𝑥 + 𝑏
However, the equation for a line can also be written in polar form with 𝜌 as the perpendicular distance from the origin, and 𝜃 as the angle of the line representing that distance:
𝜌 = 𝑥 cos 𝜃 + 𝑦 sin 𝜃
Every point on an image lies on an infinite number of lines. However, the possible values for 𝜌 and 𝜃 are quantized for this technique. This provides a threshold for small errors in line angle and position on the document image. A white pixel at position (𝑥, 𝑦) exists on all lines parameterized by (𝜃, 𝜌) pairs that satisfy the above equation. Plotting this equation, for a given (𝑥, 𝑦) yields a sinusoid on the (𝜃, 𝜌) plane, as demonstrated in Figure 2-2. This sinusoid is plotted for all white pixels on the image. If one pixel’s sinusoid intersects with another, that means that these points exist on the same line with parameters 𝜃 and 𝜌. An accumulator array can be used to keep track of the total number of intersections for each (𝜃, 𝜌) pair. A high number of intersections means a high number of white pixels exist on that line. Finally, a threshold on the accumulator array values determines which lines should be classified as existing in the image (i.e. which lines contain enough white pixels).
Srihari and Govindaraju [6] applied the Hough Transform to the analysis of textual images. They detailed a technique for determining the skew angle of a document image. For a text document skewed at an angle 𝜃𝑖, the accumulator array at 𝜃𝑖
should have the maximum number of low-high-low transitions of any 𝜃. This is because, at the skew angle 𝜃𝑖, values of 𝜌 corresponding to gaps between lines of text
(low accumulator values) alternate with values of 𝜌 corresponding to textual lines (high accumulator values).
In order to decrease computation time of the Hough transform, Kiryati et al. [7] introduced a probabilistic version of the algorithm in which a randomized fraction of points on the image are selected. However, it requires previous knowledge of the
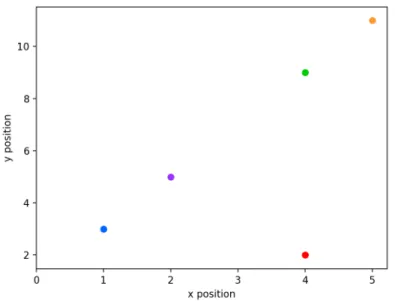
(a) Example pixel locations on x-y plane. The blue, purple, green, and orange pixels lie on the same line 𝑦 = 2𝑥 + 1, while the red pixel does not.
(b) Each sinusoid matches with the pixel in Figure 2-2a of corre-sponding color. Each sinusoid is composed of (𝜃, 𝜌) points which parameterize all lines going through its matching pixel. An in-tersection of multiple sinusoids at some (𝜃, 𝜌) represents a line shared in common by the corresponding pixels.
Figure 2-2: Hough transform example. Note that in the lower image, the blue, purple, green, and orange sinusoids all share a common intersection point because those pixels lie on a common line. The red sinusoid does not share this intersection.
number of points belonging to a line. Matas et al. [8] created the progressive prob-abilistic Hough transform, which is more computationally efficient than the Hough transform and does not require prior knowledge about the image, though prior knowl-edge can be incorporated. It explores points in a random order, checking after each if the highest accumulator array entry modified by that point increased beyond a threshold. This threshold changes depending on the number of points explored thus far. Once an accumulator array entry exceeds the threshold (meaning a line is sus-pected), the algorithm explores points on that potential line, eliminating them from the future search space. Parameters such as maximum line gap and line length can be considered to classify whether or not it counts as a valid line. This approach takes advantage of the fact that a longer line may require votes from only a small fraction of its supporting pixels in order to notice that its accumulator array value is likely not random.
2.2.2
Checkbox Detection
Optical Mark Recognition (OMR) is the process of recognizing fill-in-the-bubble style markings on forms, such as those on multiple choice answer tests or voting ballots. Classic OMR systems use a form with a specific predefined template and printed on transoptic paper. A specialized machine scans the document, detecting the amount of light shining through to identify which bubbles are filled in.
In many cases of document images, the exact location of the checkbox may not be known. Shengnan et. al. [9] investigated checkbox detection on forms where this was the case. The first step of their method is to deskew the documents. Next, they locate the borders of the checkboxes by detecting connected domains in the image, and classifying each as checkbox or non-checkbox using statistical information related to the shape of the domain. Lastly, they classify the handwritten symbol in the checkbox as a checkmark or an X based on statistical features such as stroke density and the number of holes the symbol creates inside the checkbox. They achieved 98% accuracy when locating the checkboxes, and 95% accuracy identifying the handwritten symbol. However, the checkboxes they studied were far apart from each other, without a
chance of marks overlapping multiple boxes. The errors in locating the checkboxes were most often due to fractured borders of the checkboxes, meaning they are no longer connected domains, which is commonly observed in the fax forms received by our pharmacy due to noise.
Abdu and Mokji [10] describe a system that dynamically generates templates for multiple choice forms to identify answer regions (bubbles). They first preprocessed the documents by removing unwanted lines, defined as lines having length longer than typical checkbox lines. They identified these lines using the Hough Transform, and removed them by identifying a Region of Interest rectangle surrounding each line, filling it with pixel values of the boundary. This also removes unwanted text. They next used region processing to identify the shape and size of the answer regions and segment them into the final template, achieving high accuracy.
2.2.3
Handwritten Digit Recognition
This section describes techniques to recognize handwritten digits from images. LeCun et al. [11] applied a large back-propagation network to classify handwrit-ten digits obtained from segmented digits from zipcodes writhandwrit-ten on US mail, supple-mented by printed digits from various fonts. They achieved a 5.7% rejection rate and a 1% error rate on the complete test set. In their dataset, digits are well-separated from the background. In our problem, this is not necessarily the case due to box lines that may interfere with the digit.
Perez and Holzmann [12] explored augmentation of their handwritten digit train-ing set. They found that augmentation by shifttrain-ing the position of the digits resulted in close to 8% improvement in accuracy, and altering the scaling resulted in an addi-tional 1.6% improvement.
The MNIST dataset [13] became one of the most commonly used benchmark tests for handwritten digit recognition. The dataset is composed of 60,000 training images and 10,000 test images, each 28 by 28 pixels in size. One example of a record-breaking technique was Simard et al.’s [14] use of convolutional neural networks, achieving a 0.4% error rate in 2003. They compared expanding the training data
with affine transformations (position shifts, skewing, and rotations) and with elastic deformations (through use of a displacement field that allows warping of the digit’s shape). They found that elastic deformations produced an improvement over affine transformations.
Cireşan et al. [15] used graphic cards (GPUs) to speed up training of neural networks called multilayer perceptrons (MLPs). This enabled their MLPs to have many hidden layers and neurons per layer, outperforming previous attempts with MLPs and achieving 0.35% error rate on the MNIST dataset.
2.2.4
Convolutional Neural Networks
A convolutional neural network (CNN) takes an input (for example, a matrix repre-senting pixel values of an image), applies several layers of mathematical operations, and outputs a size N vector used to classify the input into one of N categories. Dur-ing trainDur-ing, the CNN learns values (weights and biases) for its layers that improve classification accuracy.
A CNN’s architecture consists of a few types of layers applied to the input in se-quence. The first layer is a convolutional layer, which performs element-wise multipli-cation between a convolutional kernel (or filter) and the input, sliding across the input at some step size. Each convolutional layer often uses multiple kernels/filters so the network can learn to recognize multiple types of input features. Next a nonlinear layer is applied, typically the rectified linear unit activation function 𝑅𝑒𝐿𝑈 (𝑥) = max(0, 𝑥). A max pooling layer usually follows the ReLU layer. This layer, like the convolutional layer, has a kernel that slides over the input. Its output at each location is the max-imum value of the input region covered by the kernel. Several iterations of convolu-tional, ReLU, and max pooling layers may be applied. Then, a fully connected layer is used to output the final size N vector. It performs a matrix multiplication to give each input element its own weight contribution to each element of the output vector. Finally, the softmax function is applied to the output vector, converting each of the N elements to a probability representing the CNN’s confidence in the input belonging to the corresponding category.
During one training iteration, an image will be sent through the CNN using the current weights and biases. Then, a loss function calculates loss between that result and the ground truth data. For example, ground truth data for an image may be a 1-hot vector to represent the input’s actual category. Then the weights and biases are updated in the direction following the gradient of the calculated loss. Training is run for many iterations to give the CNN time to learn weights and biases that produce low loss. Dropout, where some nodes are randomly ignored with a set probability, is sometimes used to help prevent the network from over-fitting to the training data [16].
Chapter 3
Known Format: Methods and Results
This chapter details the design and evaluation of a system that extracts information from forms of known format. Building on techniques discussed in Chapter 2, we first preprocess the form, performing denoising and deskewing. We then attempt to extract two types of information: which checkboxes have been marked, and the handwritten digit indicating number of refills (if any).
3.1
Preprocessing
When a document is first received by fax, it can be skewed at an unknown angle and have noise distorting the features (text and markings). Thus, before attempting to read information from the document, it must be preprocessed. We performed these operations on the document using OpenCV-Python. Before beginning, the document colors were inverted so that the features had high pixel values (lighter in color) and the background had low pixel values (darker in color). Then, the image was thresholded to contain purely black and white pixels. While eliminating the grayscaling does discard some information, it improves speed and is necessary for some of the image processing techniques applied.
3.1.1
Denoising
We first discuss denoising the document. One common noise pattern in the received faxes was long lines. These lines often form due to ink or other debris on the scanner glass or document feeder. It is important to remove these lines so they don’t later register as a mark through a checkbox, and so they do not interfere with proper document deskewing. To detect these lines, we used a Hough transform, which was introduced in Section 2.2.1. However, we only wish to remove lines that are noise (we will call these "noise lines"), and most importantly, avoid removing lines made up of important features such as text and field borders (we will call these "feature lines"). It is therefore necessary to carefully tune the parameters of the Hough transform accordingly.
Qualitatively, there are two main differences between noise lines and feature lines. Firstly, noise lines span close to the entire length of the page, while feature lines are likely to maximally span between the document margins. Secondly, noise lines’ white pixels tend to more uniformly cover their length without large gaps, whereas feature lines may have large continuous white sections followed by large periods of black pixels. OpenCV’s HoughLinesP() function performs a progressive probabilistic Hough transform [8], which provides several parameters that can help select for lines with features that more closely resemble those of noise lines.
The parameter minLineLength rejects line segments shorter than that set value. However, a noise line going across the page horizontally is shorter than one going vertically or diagonally. Therefore, we run HoughLinesP() two times, once with min-LineLength set to the 93% of the document width, and once set to 93% of the (larger) document height. Lines that were longer than the discounted document height (and adhered to the other parameters yet to be discussed) were automatically accepted as noise lines. However, lines that were only longer than the discounted document width were required to be at an angle close enough to the horizontal such that they spanned enough of their maximal potential length.
the parameter maxLineGap to 10 pixels. This allows a maximum of 10 consecutive pixels to be missing from the line (10 consecutive black pixels). The other parameters of the function were a distance resolution of 1 pixel and an angle resolution of 0.5 degrees.
After identifying noise lines, all pixels lying on these lines were set to black. This procedure detected and removed noise lines on 17.1% of the forms used for evaluation.
3.1.2
Deskewing
Next, we will discuss deskewing the document. This task also uses the Hough Trans-form to detect lines, this time using OpenCV’s HoughLines() function. Different pa-rameters were tested on several documents to qualitatively determine what resulted in the best detection of real lines without too many false positives. The parameters were set to return lines containing a number of white pixels at least 45% of the doc-ument width (in pixels), using 0.0029 radians (1/6 degree) angular resolution. After the lines were identified, we take the angle corresponding to the most lines found (the max theta vote) as the skew angle of the document. Finally, rotating by that angle performs deskewing. This is a slightly simpler method than Srihari and Govin-daraju’s approach [6] discussed in Section 2.2.1. Finally, Tesseract, an open source optical character recognition (OCR) tool, rotates the document to the final correct orientation. We were only able to use Tesseract’s rotation functionality for rota-tions of multiples of 90 degrees, so this is useful when the Hough transform approach deskews the document to the correct angle, but upside down.
3.2
Checkbox Detection
3.2.1
Procedure
After the document has been preprocessed, we would like to detect which (if any) checkboxes have been ticked off with high confidence. Because we know the format of the fax, we can use template matching to find the exact locations of each box.
Prescribers occasionally do unexpected things to the form, like placing their own form on top when faxing it. In these cases, it does not make sense to perform checkbox detection because the checkboxes may be covered or unused. Furthermore, a fax may contain too much remaining noise for analysis. We therefore use a threshold to determine whether the template match was successful before continuing.
Following this, we sum the pixel values within each box boundary and compare it against a threshold. We expect that exactly one Authorize Refill box or exactly one Deny Refill box will be checked off by the physician. Therefore, if more than one box’s pixel values are above the threshold, the algorithm does not make a guess.
3.2.2
Results
We performed this process on 2,043 faxes. The algorithm made a guess on 75.0% of the documents, and was correct on 92.2% of its guesses.
3.3
Digit Recognition
When a prescription is renewed, the pharmacist may hand write a digit into the "Number of Additional Refills" box. To determine this digit, our overall strategy was to use the MNIST dataset of handwritten digits [13] to train a convolutional neural network (CNN). However, the MNIST images each have a handwritten digit centered within a small area (28 by 28 pixels), while the digits on the fax forms only have the location constraint of lying somewhere within the guiding box outline. The digits on the forms have varying sizes, and sometimes don’t lie completely within the box border. To apply the CNN trained on MNIST data, it is necessary to isolate the digit on the form and center it within a 28 by 28 pixel area so the dimensions match.
3.3.1
First Attempt: Basic Single Digit Recognition
Procedure
For the first attempt, a CNN was trained directly on images taken from the MNIST dataset using TensorFlow, a machine learning library. We selected hyperparameters for the CNN similar to hyperparameters that have shown success on the MNIST test dataset [17], with the idea that they would also work well on test data from the fax forms of the same dimensions. The CNN had two convolutional layers, each with a kernel size of 5 by 5 and a step size of 1. The first had 32 filters, and the second had 64 filters. The image was padded before each convolutional layer was applied to maintain the same dimensions. Each convolutional layer was followed with the rectified linear unit activation function 𝑅𝑒𝐿𝑈 (𝑥) = max(0, 𝑥), and then with a 2 by 2 max pooling layer with step size of 2. There were two fully connected layers. The first took the output from dimension 3,136 to 1,024, and the second took the output to a dimension of 10 for the 10 digits between 0 and 9 to be classified. Finally, a softmax layer generated confidence values for each digit. Cross entropy loss was used during training.
A challenge with this strategy was identifying the exact location of the digit on the form to obtain an image similar to those in the MNIST dataset. The general strategy used was to take several square snapshots at different locations within the digit box of the form, run each through the CNN, and take the digit guess corresponding to the snapshot with the highest confidence value. There were two approaches to obtain these snapshots. The first was a sliding window, where 4 square snapshots were taken inside of the box lines, moving horizontally across the digit box with a small amount of overlap. The next approach was to calculate the "center of mass" within the digit box to locate the approximate position of the digit, and use a square centered about that location for the snapshot. Each of these snapshots was resized to 28 by 28 pixels and run through the CNN, producing confidence values over all digits. The digit corresponding to the highest confidence value among all snapshots was selected.
(a) Attempt 1 (b) Attempt 2
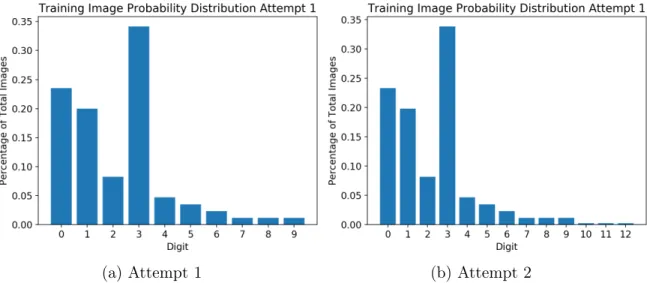
Figure 3-1: Probability distributions over refill amounts for training images used in Attempts 1 and 2. Attempt 2 includes the double digit refill amounts 10, 11, and 12.
for this, we selected the proportion of training images provided for each digit to match the proportion seen overall across all prescriptions. For unlikely digits, this proportion was increased slightly in order to provide enough different images of that digit to for the CNN to learn to recognize it. Double-digit refill amounts were ignored in calculating these proportions, since the training data for this attempt only handles single-digits. Moreover, double-digit refill amounts had low frequency of occurrence in the data compared with most single-digit refill amounts. Figure 3-1a shows these proportions.
Evaluation and Results
When the prescriber intends 0 additional refills, they may write "0" or they may write nothing in the box. Because we are interested in testing the performance of the automatic digit recognition system, we do not include cases where the template matching program detects nothing written in the box in the accuracy calculation. In an actual implementation of the system, it would likely make sense to guess 0 refills for any form classified as a renewal that contains no written digit.
This technique resulted in only 43.3% accuracy. Due to this poor performance, we next tested a different technique.
3.3.2
Second Attempt: Synthetically Modified Training Data
Procedure
Instead of attempting to manually locate the digit in the box, we synthetically mod-ified the training data to include the box outline. To achieve this, we overlay digits from the MNIST database onto box outlines using various scalings and positions for added variance. Altering positions and sizes is similar to the training data augmen-tation technique used in [12].
First, an image containing solely a randomly scaled and shifted box is created. A 64 by 36 pixel image of the template’s box is randomly padded to shift its position between 0 and +-4 pixels independently in both the x and y direction. Then, it is stretched independently in each direction with a scaling factor between 0.93 and 1.07. Finally, the image is restored to its original size of 64 by 36.
Next, the digit portion of each training image is prepared. To obtain different scalings of the digits, first a random vertical dimension (𝑦𝑠𝑖𝑧𝑒) is selected between 17 and 36 pixels. Then, the horizontal dimension (𝑥𝑠𝑖𝑧𝑒) is randomly selected such that
max(17, 𝑦𝑠𝑖𝑧𝑒 − 5) <= 𝑥𝑠𝑖𝑧𝑒 <= min(36, 𝑦𝑠𝑖𝑧𝑒 + 5)
This prevents the horizontal scaling from differing too much from the vertical scaling. Finally, the digit is randomly positioned onto the box image by padding the digit image and summing the pixel values. This technique could often result in high amounts of overlap with the box lines, making digits difficult to visually discern. To ensure the digit is visible, the image-generating program takes the difference be-tween the sum of pixel values for the box image and the sum of pixel values for final image containing both the box and the digit. If this difference is less than 75% of the pixel value sum for the digit image alone, meaning more than 25% of the digit is covered by box lines, then that training image is discarded.
After noticing many failures to detect the digit zero, investigation into the MNIST dataset revealed that it does not include images of zeroes with a line through them,
whereas many prescribers crossed their zeroes. To account for this, we added a cross to 55% of zeroes in the training data. This was done using ones from the training data as crosses, scaled to 1/2 the size of the zero and rotated at a random angle.
Finally, we additionally created training images representing double digit refill amounts that were observed in non-trivial frequency in the data, which were 10, 11, and 12. Figure 3-1b shows the proportions of all refill amounts used in this second attempt’s training images. Similar to the first attempt, these proportions were based off the frequency of each refill amount observed in the data, while slightly increasing the proportion of less common refill amounts to provide enough total training data for each. Each double digit was composed of two single digits from the MNIST dataset, selected at random. Both digits were resized with the same random scaling factor, chosen using the same constraints as the single-digit training images. The horizontal position of the leftmost digit was selected at random, within constraints that would allow the final refill amount to entirely fit on the box image. The horizontal position of the rightmost digit was selected such that the overlap between the two digit images was a randomized percentage of the digit image width between 0 and 50%. The vertical position of the first digit is randomly selected, and the second digit’s vertical position is randomly selected within ±4 pixels. Finally, the same check is performed as for single digits to ensure there isn’t too much overlap between the digits and box lines.
Some examples of synthetically modified digit images are shown in Figure 3-2.
Selecting the number of layers and hyper parameters to use for training the CNN was in part motivated by the idea that with a larger image and more possibilities for location of the digits, performance may be improved by adding more complexity by increasing the number of layers and dimensions. After trying several combinations of layers and hyper parameters, our best results used three convolutional layers. The first had a kernel size of 8 by 8 with 32 filters, the second was 5 by 5 with 64 filters, and the last was 3 by 3 with 64 filters. Similarly to the previous CNN, each layer was followed by a rectified linear unit activation and max pooling layer. Two fully connected layers were used, the first with output dimension 2048, and the second with output dimension 13 for classifying the 13 digits between 0 and 12. The size 13 output was then run through a softmax function to generate a probability value for each digit. Again, cross entropy was used for the loss function during training.
Results
This technique resulted in 78.0% accuracy. While this is a large improvement in comparison to the previous technique, it is still not high enough for reliable auto-matic classification. Figure 3-3 shows more detailed results, showing the frequency of guessed digits for each ground truth digit. Potential reasons for low accuracy, as well as suggestions for further study, are discussed in the following section.
3.4
Discussion
The template matching, deskewing, and denoising operations worked reasonably well. The accuracy achieved for checkbox detection was fairly high. This same technique could extend to additionally recognize whether or not the form is signed. This is important, because legally the form must be signed in order to fulfill the prescription renewal. Detecting a missing signature earlier on in the process saves both employee time and allows for the followup with the prescriber to happen earlier, yielding the best chance at fulfilling the prescription in time for the patient’s needs. Signature detection was difficult to test, since there there was no data recorded on whether a
Figure 3-3: Digit Guess Results for Attempt 2, showing relationship between ground truth and guessed digits
form was signed. While that information can be gained by looking at the document image, it would be time-consuming to manually label a large number of forms. Addi-tionally, it is difficult to outsource data labeling of healthcare forms while ensuring no personal health information is released. However, based on the success with checkbox detection, it is likely that comparing the dark value inside the signature box against a threshold could be used to provide warnings to the data entry technician if the program suspects a missing signature.
There may be simpler ways to deskew the document. In particular, each form has a QR code in the top corner used to match the document to the correct customer and prescription. For this project, we found it difficult to access the code that performed this task to use the QR code locator for deskewing, leading to our Hough Transform approach. Future work could explore this possibility. Our deskewing technique, however, has the benefit that it would work on a wider variety of templates.
Digit recognition did not achieve high accuracy. Mild improvements may be pos-sible by limiting guesses to only the most popular digits, eliminating the less common
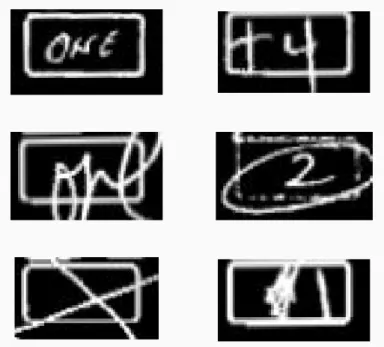
ones such as 10, 11, and 12. However, this guarantees that these number of additional refills will never be correctly detected. Figure 3-3 shows that 10 is often guessed when 0 is correct. While this is likely in part due to the synthetic crossed zero training data which uses both a 1 and 0, using the crossed zeroes did improve 0 detection overall. Upon investigation of the cases where the CNN failed, there are many cases where the prescriber wrote something unexpected in the box. Some examples are shown in Figure 3-4. An alternative approach is to train the CNN on actual images taken from the fax forms themselves. Obtaining this data would require running the template matching program over tens of thousands of forms to extract the correct area to use as training data. Due to the time this would take, this was not explored in this project.
Another potential solution to this could simply be a redesign of the form. Instead of having the prescriber handwrite a digit, they could fill in a bubble for the most common refill amounts which could be automatically detected via the more success-ful checkbox detection technique. Other refill amounts could be handwritten and manually entered by data entry technicians.
Chapter 4
Unknown Format: Introduction
4.1
Overview
Besides faxes where the format is known in advance, the remaining documents re-ceived by fax are of unknown format. Typically these are faxes specific to a pre-scriber’s office, and often they are for new prescriptions. These forms require different techniques, because information can be located anywhere on the document.
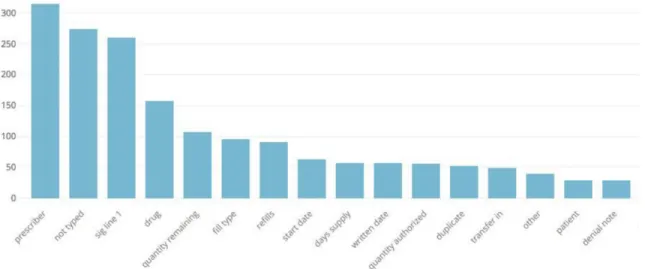
Figure 4-1 shows a relative comparison of the highest error types for fax documents of unknown format. The most common error is the prescriber. The next most common error, "not typed", refers to instances where multiple prescriptions exist on the same document and at least one is missed. "Sig line 1" relates to incorrect directions being typed. We decided to target error categories based on frequency of occurrence, significance of the error when it occurs, and feasibility of correcting the error with automatic form reading techniques. We select types of information to extract based on a combination of frequency of error, impact of error, and ease of search.
Prescriber, while not a critical mistake, is the most error-prone category. Errors in the Patient category, while infrequent, do occur and can have extreme negative consequences. A patient could miss important doses of their medication, or be given incorrect medication. Finally, Drug is the fourth most common error, and can also be a critical error. The second-most common error, "not typed," occurs when a document contains multiple prescriptions and at least one is missed by the data entry
Figure 4-1: Comparative frequency of data-entry error types for faxes of unknown format
technician. In such a case, multiple drug names and/or customer names are present on the document, so extracting customer and drug information will help address this error. The third-most common error, sig line, is a more difficult problem. The sig line contains a phrase of directions, and it is challenging to normalize these phrases to check whether automatic extraction was correct. In this project, we therefore explore techniques to extract prescriber, customer (patient), and drug name.
4.2
Literature Review
In this section, we provide an overview of topics and methods that are relevant to processing data on fax forms of unknown format.
4.2.1
Optical Character Recognition (OCR)
Optical Character Recognition (OCR) is the process of computer recognition of printed or handwritten text in images. Applications of OCR are far-reaching, in-cluding automatic reading of license plates [18] and addresses on mail [19].
While many techniques have been explored to perform OCR, we present an overview of the open-source OCR system called Tesseract [20] to serve as an example of an
OCR pipeline. First, connected component analysis stores outlines of text and other markings and groups them into blobs. Next, page layout analysis is used to help filter out noise blobs and identify lines. The next step is to separate characters, where the specifics of the method depend on whether the font is fixed pitch (equally-spaced characters) or proportional (characters having different widths). Tesseract tries sepa-rating joined characters by chopping blobs with the worst confidence, checking if the chop succeeded in increasing confidence. Similarly, Tesseract tries rejoining potential segments of broken characters to improve confidence. The character classifier uses a polygon approximation for training features, but uses smaller line fragments for recognition. This helps the classifier remain robust against damaged images. Some linguistic analysis is used to help word recognition. Words determined to be satisfac-tory are used to train an adaptive classifier, which learns specifics of the text features to help recognize the rest of the image. Two recognition passes over the image are performed to adequately train the adaptive classifier.
4.2.2
Approximate String Matching
A simple way to define the distance between two strings is to go through each character sequentially, checking if they match. The number of character differences counted with this technique is analogous to the Hamming Distance [21]. Two identical strings would have Hamming Distance of 0. However, consider a comparison between the strings "medicine" and "mdicines". These strings are very similar, but the Hamming Distance is 7, since only the first "m" of each string matches. The Hamming distance only considers character replacements. A more useful metric is the edit distance between two strings, often called the Levenshtein Distance, which was introduced by Vladimir Levenshtein in 1965 paper [22]. This distance is the minimum number of insertions, deletions, and replacements of single characters needed to transform one string into the other. To transform "medicine" to "mdicines", the first "e" is deleted and "s" is inserted at the end, so the Levenshtein Distance is 2.
One method to calculate this distance is called the Wagner-Fischer algorithm [23]. For a string of length 𝑛 and a string of length 𝑚, it uses dynamic programming to
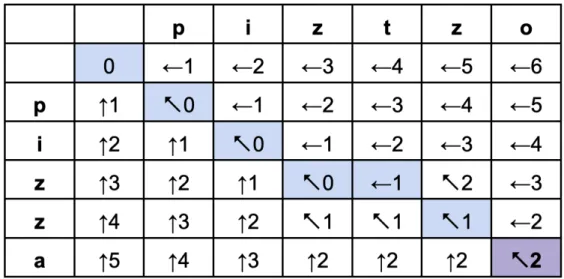
find the Levenshtein distance in 𝑂(𝑚𝑛) time. First, an (𝑛 + 1) × (𝑚 + 1) matrix 𝐴 is constructed, which we will index starting at 0. It is helpful to think of the first string going vertically down aligning with position 𝑖 = 1 to 𝑖 = 𝑛, and the second string going horizontally across aligning with position 𝑗 = 1 to 𝑗 = 𝑚. An example matrix, along with the weights resulting from the algorithm about to be described, is presented in Figure 4-2.
The algorithm begins in the top left corner of the matrix, working across each row and then moving down to the next. At each step, 𝐴𝑖,𝑗 is updated with a weight
representing the number of operations it would take to transform the current prefix of the first string (the first 𝑖 characters) to the current prefix of the second string (the first 𝑗 characters). For the first row, this is equivalent to transforming the null string into the current prefix of the second string, so the first row is initialized with weights 0 to 𝑚.
Dynamic programming is used to calculate this quickly at each step, only need-ing to examine 𝐴𝑖−1,𝑗, 𝐴𝑖−1,𝑗−1, and 𝐴𝑖,𝑗−1. These are the elements above,
diago-nally above and to the left, and to the left of the current element, respectively. If the final characters of each current string prefix are the same, then 𝐴𝑖,𝑗 is updated
to be the same as 𝐴𝑖−1,𝑗−1. If the characters are different, 𝐴𝑖,𝑗 is updated to be
min(𝐴𝑖−1,𝑗, 𝐴𝑖−1,𝑗−1, 𝐴𝑖,𝑗−1) + 1. Those three options in the minimization function
represent each of the three operations of insertion, replacement, and deletion. Main-taining pointers throughout this process to keep track of the path through the matrix allows for retrieval of the operations used to transform the first string into the second. The final Levenshtein distance is equal to 𝐴𝑛+1,𝑚+1.
Sellers [24] developed a method that can perform a fuzzy search for a string of length 𝑛 in a text of length 𝑚 in time 𝑂(𝑚𝑛), identifying the optimal position for the string and the related Levenshtein distance. For example, for the string "puppy" and the text "I took my pup pi to the park", Seller’s algorithm would identify the optimal position for "puppy" (starting with the "p" in "pup" of the text), and a Levenshtein distance of 2 (the insertion of a space between the "p"s and a replacement of "y" with "i" to transform "puppy" into "pup pi"). Seller’s algorithm is in fact extremely similar
to the Wagner-Fischer algorithm, starting with an (𝑛 + 1) × (𝑚 + 1) matrix. The main adjustment is that instead of the first row being initialized 0 to 𝑚, it is initialized with all zeroes. From there the algorithm is followed as before. However, each weight 𝐴𝑖,𝑗 now represents the Levenshtein distance required to transform the current prefix
of the string (the first 𝑖 characters) into the optimal portion of text ending at its (𝑗 − 1)’th character (indexing the text starting with 0). Once all matrix elements have been updated, the element in the final row with the lowest weight corresponds to the optimal position at which the string ends in the text. That element’s weight is the corresponding Levenshtein distance.
Figure 4-2: Example of the Wagner Fischer algorithm for the strings "pizza" and "piztzo". Each matrix element shows its weight as well as a pointer to the element used in calculating its weight. The optimal path is highlighted in blue, with the final element in purple with Levenshtein distance of 2.
Chapter 5
Unknown Format: Methods and
Results
This chapter describes the method of extracting information from forms of unknown format, and discusses the results. The chapter first includes a summary of the code written for approximate string matching, prefaced by the motivation for a custom implementation. It then presents the OCR tool and preprocessing techniques used. Finally, it details methods of extracting information, focusing on customer, prescriber, and drug, and discussing results within each subsection.
5.1
Approximate String Matching
To find information in the fax document, we use approximate string matching. We design a program to allow for searching the OCR text output for specific words and phrases in a list, finding the best match within that list.
5.1.1
Motivation for Custom Implementation
The existing code infrastructure we had access to was written with Ruby on Rails. However, an existing fuzzy matching library for Ruby performed slowly. To increase speed, we decided to implement our own version of the algorithm using C++. A
software package called Rice [25] links this code with the Ruby code. The C++ implementation achieved a 3x speed up compared with the Ruby package.
Our own implementation also allowed for useful customization. First, the Ruby package searches the source text word by word. However, an observed problem with the OCR output was that extra spaces could be detected, or spaces could be missed. Ideally misreading a space would count the same as or similar to misreading a char-acter. However, the Ruby fuzzy match function depends upon words being correctly separated. If it is searching for "January" and the words are split into "Jan" and "uary", it will find that "uary" is the best match with distance 3, vs. the reality of "Jan uary" being the closest match with distance 1. Seller’s algorithm, as described in section 4.2.2, allows for search through an entire block of text to find the optimal location of a word. We based our implementation on this algorithm.
Writing our own approximate string matching function also allowed for customiza-tion of the edit distance calculacustomiza-tion. The Levenshtein distance punishes equally for every replacement, insertion, and deletion. However, we might expect some OCR er-rors to be more common than others. For example, "JOHN" may be more likely to be misread as "J0HN" than "JWHN" because of the similarity between the characters 0 and O. Therefore, it makes sense to weight such a mistake less heavily.
5.1.2
Description of Code Structure
We now discuss the code structure for our implementation of approximate string matching, based on Seller’s algorithm as discussed in section 4.2.2. The code descrip-tion is organized into each class and funcdescrip-tion.
Classes: Replacement, Delete, and Insert
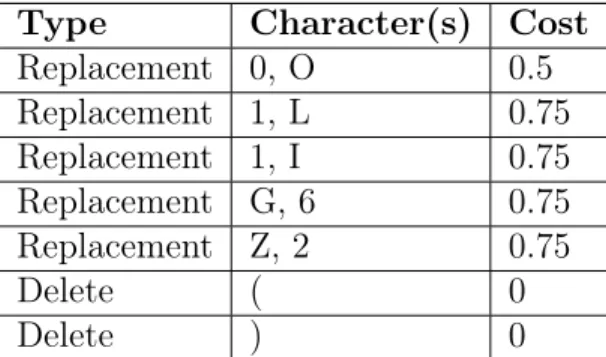
The default cost for any replacement, insertion, or deletion is set as 1.0. In order to customize particular alterations, we created the classes Replacement, Delete, and Insert. Each class instance is initialized with the relevant characters involved, named toChar and fromChar, and the custom weighting, named scoreFloat. For example,
Type Character(s) Cost Replacement 0, O 0.5 Replacement 1, L 0.75 Replacement 1, I 0.75 Replacement G, 6 0.75 Replacement Z, 2 0.75 Delete ( 0 Delete ) 0
Table 5.1: Custom weighting scheme used for approximate string matching. The replacements are bidirectional. All other edit costs are 1.
Replacement("O", "0", 0.5) represents replacing a "0" with an "O" in the text costing 0.5 as opposed to 1.0.
Class: SpecialRule
The class SpecialRule maintains maps from character(s) to their scoreFloat in or-der to make instances of Replacement, Delete, and Insert accessible. SpecialRule is initialized in the Ruby script with our custom weighting scheme, seen in Table 5.1. The replacements were chosen due to visual similarity to each other, and/or observed mistakes in initial OCR tests. Deletions of parentheses are assigned a weight of 0
The class also contains the method findMinChoice, which is called at each step of Seller’s algorithm to calculate the best choice between a replacement, insert, or delete using the customized weights.
Function: sellers and Class: SellersResult
The function sellers performs Seller’s fuzzy string matching algorithm as described in Section 4.2.2. The first arguments are text and word, representing the document text and the word (or phrase) to search for. The function maintains a cost matrix and a length matrix that is used to keep track of the length of the word (or phrase) as it appears in the text ending at that position. For example, for the word "horse" at a point where the text is "hoarse", that length matrix element would be 1 for the 1 deletion required to get from "hoarse" to "horse". At the end of the function, the
element of the length matrix corresponding to the minimum cost location is added to the word length, resulting in the total length of the text’s best match. In the example, 1 would be added to the length of "horse" for a final length of 6, which matches the length of "hoarse".
Updating the length matrix is similar to updating the score matrix. Inserts sub-tract 1 from the length of the above element, deletes add 1 to the length of the left element, and replacements maintain the length of the diagonal element.
To save space, each of these matrices is 2 by 𝑛 instead of 𝑚 by 𝑛, since information is only ever needed from the previous or current row. The function alternates which row to write new information to. This reduces space from 𝑂(𝑛𝑚) to 𝑂(𝑛).
Beyond the arguments text and word, the function also takes in an instance of SpecialRule. While performing the algorithm, if the current characters do not match, it calls SpecialRule’s findMinChoice method. The input arguments are the current text character, the current word character, and the relevant three scores in the matrix. findMinChoice returns an integer representing whether an insertion, deletion, or replacement is best (defaulting to replacement to break ties), and the score associated with it. sellers uses this output to update the score matrix and length matrix.
sellers returns an instance of SellersResult, which holds information pertain-ing to the position and length of word in text, as well as the Levenshtein distance. This edit distance is stored as normalizedScore, which is computed by taking 1 minus the ratio of the Levenshtein distance to the original word length. normalizedScore therefore ranges from 1 (the word exists perfectly in the text) to 0 (no similarity between the word and its optimal text position).
Function: findBestMatch and Class: BestMatchResult
The function findBestMatch is written with customer matching in mind, although we apply it to more tasks. Variable names refer to customer information, and for the sake of explanation we will describe the function as it applies to the customer matching task.
One of its arguments, text, is a string containing the document’s text that we will be searching through. It also has an argument called customerInfo which is a list of items corresponding to each customer we are checking. For example, an item might contain a customer’s first name, last name, and birthday. findBestMatch also takes in an instance of SpecialRule to specify the unique scoring method to use.
The function loops through each customer item in customerInfo, and then runs sellers on each string in that customer item. findBestMatch has one final ar-gument, a string called scoringMethod, which takes the value "customer", "pre-scriber", or "drug" to allow for a different scoring technique depending on what is being searched for in the document. Throughout the loop, the scoring method keeps track of information corresponding to the best match so far.
It returns an object of the type BestMatchResult, which stores the index of the best customer item, the weighted score of that customer item, and the locations of each string in the customer item.
5.2
Optical Character Recognition
We experimented with two different OCR engines, Tesseract [20], which is open source software, and Google Vision API [26]. Our tests showed better performance with Google Vision API.
We first rotate the images using the same technique as section 3.1.2. We do not make attempts to denoise the documents, as this could delete parts of characters important to the OCR task. Furthermore, the API was trained on real images, so there is some amount of noise tolerance built in. This platform provides detected text as objects in a decreasing hierarchy: page, block, paragraph, word, and symbol. Besides the text, it gives coordinates for the bounding box of each symbol. We first perform some preprocessing on this output to put it into a more useful format and to eliminate unnecessary text.
The function prepare_rawText deletes the symbol category, assigning each "word" object an attribute "text" containing that word as a string. We do this for ease of
access to the detected text, instead of the original format where a word was a list of symbol objects, each with a text attribute for accessing each individual character string.
For the most part, these forms did not have much extraneous information, making it possible to do a fairly simple search for information of interest. However, many faxes contained legal paragraphs that could contain close to the same amount of words as the rest of the form. Deleting these paragraphs from the search space is useful in that it speeds up the search by decreasing 𝑛 in 𝑂(𝑛𝑚). It also decreases the chances of identifying, for example, a customer with a last name similar or the same as a word in the paragraph. This type of error did occur on more than one instance in early tests.
To delete these paragraphs, we define the function delete_irrelevant_paragraphs. For each paragraph, it performs a fuzzy match to check if there are at least a certain number of words from a set list of 43 words commonly seen in these paragraphs. Examples of some of these words include "confidential", "protected", "communica-tion", and "prohibited". After some experimentation, we set the required number of found words to 5, and allow a Levenshtein distance of at most 1 for each word. If the paragraph meets these criteria, it is identified as irrelevant and deleted from its block so that it will not be searched through.
We also use a very similar process to delete words containing the current year. The faxes often contain the date they are created. We found that this could some-times interfere with searching for customer birthdays, resulting in incorrect customer identifications.
5.3
Information Extraction and Results
In the tests, each fax page was stored as a png named by the fax id and the page number, and the OCR raw output file This allowed us to easily access all information in the database corresponding to a fax just from the file name. Section 4.1 describes the decision process for which types of information to extract. We decided to target
prescriber (as the most frequent error type), drug (related to the second and fourth most frequent error type), and patient/customer (low frequency of occurrence, but very significant if the error is not corrected).
All results are reported for a test size of 403 prescription faxes.
5.3.1
Customer and Prescriber Matching
The search space for all customers in our pharmacy’s database is large, and would take a long time to search through. It is therefore helpful to narrow the search space. One piece of information about a document that is easy to obtain without OCR is the fax number it was sent from. Customers are likely to have prescribers close to their homes. 78% of users in our pharmacy’s database have never had a prescriber outside of their state of residence. We therefore restrict our search space to only include customers in the state corresponding to the area code of the fax number. If a fax number does not have an area code associated with a state, we do not attempt any guesses for that document.
We use a customer’s first name, last name, and birthday as items to search for in the document text. These fields are used for customerInfo in findBestMatch. For our scoring method, we sum together the normalized scores for each of these three fields, and then multiply by the smallest normalized score. This heavily punishes any customers who don’t closely match all three fields. The program only guesses the customer returned by findBestMatch if the score is greater than a threshold of 2.2.
On customer identification, this technique guessed on 54% of test faxes, and was correct on 97.7% of those guesses. That means there were 5 total incorrect guesses. For all 5 mistakes, the correct user was not in the narrowed search space.
∙ One error was due to duplicate user accounts, which isn’t actually an error with our process. It guessed the correct customer, but it happened to guess the wrong account associated with that customer.
∙ The second error was due to a name and birthday collision. This means there were two customers in the same state with the same name and birthday. This
is an interesting issue, and becomes more relevant for increasing numbers of customers. One potential solution to handle these cases is to look for additional information, such as address, to discriminate between such customers. Another, perhaps safer, idea is for the program to flag these instances and require that a data entry technician make the final decision.
∙ The third error was due to multiple users associated with one document. During testing, we only allow the program to guess one customer per document, as our ground truth data only linked each document to one customer.
∙ The final two errors were actual errors, where a customer’s name and birthday were close enough to words found in the text to
We use a very similar technique for prescriber identification. First name, last name, national provider identifier (NPI) number, and drug enforcement admin-istration (DEA) number. Often the NPI or DEA number will appear on a form, but not necessarily both. The prescriber scoring method therefore takes the maximum normalized score between NPI and DEA number. As in customer scoring, the program sums the three normalized scores and multiplies by the minimum. It uses the same threshold of 2.2, below which the program does not make a guess.
On prescriber identification, it guessed on 40% of test faxes and was correct on 87%. The results are summarized in Table 5.2.
One idea for future work is to use the prescriber information to help identify the customer, and vice versa. For example, if we know the prescriber, we can first search through their known customers to potentially speed up the customer identification search. Another idea to investigate is to use knowledge of the position of information on the form, which the Google Vision API provides. For example, first and last names could only be valid within a certain area of each other. This would require trial and error for the settings, as occasionally first and last name are separate entries of a form and may not be extremely close to each other.