HAL Id: cirad-01952858
http://hal.cirad.fr/cirad-01952858
Submitted on 12 Dec 2018
HAL is a multi-disciplinary open access archive for the deposit and dissemination of sci-entific research documents, whether they are pub-lished or not. The documents may come from teaching and research institutions in France or abroad, or from public or private research centers.
L’archive ouverte pluridisciplinaire HAL, est destinée au dépôt et à la diffusion de documents scientifiques de niveau recherche, publiés ou non, émanant des établissements d’enseignement et de recherche français ou étrangers, des laboratoires publics ou privés.
Driving forces of recent vegetation changes in the Sahel:
lessons learned from regional and local level analyses
Louise Leroux, Agnès Bégué, Danny Lo Seen, Audrey Jolivot, Francois
Kayitakire
To cite this version:
Louise Leroux, Agnès Bégué, Danny Lo Seen, Audrey Jolivot, Francois Kayitakire. Driving forces of recent vegetation changes in the Sahel: lessons learned from regional and local level analyses. Remote Sensing of Environment, Elsevier, 2017, 191, pp.38-54. �10.1016/j.rse.2017.01.014�. �cirad-01952858�
Driving forces of recent vegetation changes in the Sahel: lessons learned from regional and local level 1
analyses 2
Louise Lerouxa*, Agnès Béguéb, Danny Lo Seenb, Audrey Jolivotb, Francois Kayitakirec 3
a
CIRAD, UR AÏDA, Avenue Agropolis, 34938, Montpellier, France 4
b
CIRAD, UMR TETIS, 500 rue Jean-François Breton, 34093, Montpellier, France 5
c
European Commission, Joint Research Centre, Institute for Environment and Sustainability, Via E. 6
Fermi 2749, I-21027 Ispra, VA, Italy 7
8 *
Corresponding author: Louise Leroux, [email protected], +33467617128 9
E-mail addresses: [email protected] (Louise Leroux), [email protected] (Agnès Bégué), 10
[email protected] (Danny Lo Seen), [email protected] (François Kayitakire) 11
12
Abstract
13
A wide range of environmental and societal issues such as food security policy implementation 14
requires accurate information on biomass productivity and its underlying drivers at both regional and 15
local scales. While many studies in West Africa are conducted with coarse resolution earth observation 16
data, few have tried to relate vegetation trends to explanatory factors, as is generally done in land use 17
and land cover change (LULCC) studies at finer scales. In this study we proposed to make a bridge 18
between vegetation trend analysis and LULCC studies to improve the understanding of the various 19
factors that influence the biomass production changes observed in satellite time series (using 20
integrated Normalized Difference Vegetation Index [NDVI] as a proxy). The study was conducted in 21
two steps. In the first step we analyzed MODIS NDVI linear trends together with TRMM growing 22
season rainfall over the Sahel region from 2000–2015. A classification scheme was proposed that 23
enables better specification of the relative role of the main drivers of biomass production dynamics. 24
We found that 16% of the Sahel is re-greening—but found strong evidence that rainfall is not the only 25
important driver of biomass increase. Moreover, a decrease found in 5% of the Sahel can be chiefly 26
attributed to factors other than rainfall (88%). In the second step, we focused on the “Degré Carré de 27
Niamey” site in Niger. Here, the observed biomass trends were analyzed in relation to land cover 28
changes and a set of potential drivers of LULCC using the Random Forest algorithm. We observed 29
negative trends (29% of the Niger site area) mainly in tiger bush areas located on lateritic plateaus, 30
which are particularly prone to pressures from overgrazing and overlogging. The significant role of 31
accessibility factors in biomass production trends was also highlighted. Our methodological 32
framework may be used to highlight changing areas and their major drivers to identify target areas for 33
more detailed studies. Finer-scale assessments of the long-term vulnerability of populations can then 34
be made to substantiate food security management policies. 35
Keywords: Sahel, NDVI time series, trend, drivers of change, food security, land cover changes
36
1. Introduction 37
While the population of Africa is set to exceed 3 billion by 2050 (United Nations, 2013), increasing 38
climate variability, as expressed by extreme climatic events (e.g., droughts or floods) threatens 39
agricultural production and enhances household vulnerability and food insecurity. Schlenker and 40
Lobell (2010) estimated that climate change would be responsible for yield declines of up to 22% in 41
major food staples. However, the dynamics of agricultural production are not solely a result of 42
climatic factors; they depend on many factors, including agricultural practices, population density and 43
environmental and social constraints (type of soil, land accessibility, etc.). In the context of increasing 44
food demand, the identification of areas particularly prone to degradation in agricultural production 45
conditions, and a better understanding of the underlying drivers is increasingly important for long-term 46
mitigation and adaptation strategies (Pricope et al., 2013). 47
The Sahel belt, a transition zone between the Sahara Desert and the tropical savannas, is characterized 48
by substantial rainfall variability and is particularly prone to food insecurity because most of the 49
agropastoralist local population rely on low productivity rainfed agriculture (mainly millet and 50
sorghum) for their livelihoods. Food crises caused by severe droughts are recurrent, some amounting 51
to extreme starvation of the populations (e.g., in the late 1960s and 1980s; Hulme, 2001; Nicholson et 52
al., 1998). Since the late 1990s, however, the Sahel region has seen a general increase in rainfall (Ali 53
and Lebel, 2009; Nicholson, 2005), and the ensuing vegetation recovery, as viewed from space, has 54
been termed a “re-greening” of the region (Eklundh and Olsson, 2003; Olsson et al., 2005; Prince et 55
al., 2007, 1998). Most studies on the re-greening of the Sahel are founded on the Normalized 56
Difference Vegetation Index (NDVI), a spectral ratio index based on the red and infrared bands 57
(Tucker, 1979) and closely linked to vegetation productivity (Asrar et al., 1984; Pettorelli et al., 2005). 58
The relationship between the Above Net Primary Production (ANPP) and NDVI relies, on one hand, 59
on the close relationship between the fraction of Absorbed Photosynthetically Active Radiation 60
(fAPAR) integrated over a time period and the growing season ANPP (Prince, 1991) and, on the other 61
hand, on the linear correlation between NDVI and fAPAR, due to their similar functional responses to 62
leaf orientation, solar zenith angle and atmospheric optical depth (Myneni and Williams, 1994). Thus, 63
NDVI trends integrated over a time period have been widely used as a proxy to monitor changes in 64
vegetation productivity. To date, the most frequently utilized NDVI dataset is the Advanced Very 65
High Resolution Radiometer (AVHRR) dataset from the National Oceanic and Atmospheric 66
Administration (NOAA) satellite due to its high temporal resolution and its availability since the 67
beginning of the 1980s. This technology has enabled the monitoring of vegetation trends over nearly 68
thirty-five years at a spatial resolution of 8 km (e.g., Anyamba et al., 2014; Dardel et al., 2014b; 69
Herrmann et al., 2005; Huber et al., 2011). Most of these studies reported an increase in the greenness 70
of vegetation over the whole Sahel since the 1980s and helped to fuel the debate on the "irreversible" 71
desertification of the Sahel. However, recent studies based on Moderate Resolution Imagery 72
Spectroradiometer (MODIS) data, which have supported vegetation monitoring at a 250 m spatial 73
resolution since 2000, have highlighted the spatial heterogeneity of trends, with some areas showing 74
negative trends or non-significant trends (Leroux et al., 2014; Rasmussen et al., 2014). 75
Currently, one of the main challenges in analyzing biomass productivity dynamics is to document the 76
underlying drivers consistently. On a global scale, it has recently been shown that the main driver of 77
the greening of Earth may be increases in CO2, which augments photosynthesis and, consequently, 78
increases the water use efficiency in water limited environments (Donohue et al., 2013; Zhu et al., 79
2016). At the Sahelian scale, however, although it is generally acknowledged that variations in 80
vegetation depend on rainfall, several studies have indicated that local NDVI trends might not be fully 81
explained by global drivers such as rainfall and have suggested other causal local factors (Boschetti et 82
al., 2013; Fensholt et al., 2013; Helldén and Tottrup, 2008; Herrmann and Hutchinson, 2005; Hoscilo 83
et al., 2014; Huber et al., 2011; Rasmussen et al., 2014) such as shifts in land use, as shown in Mali 84
by Bégué et al. (2011) or many non-anthropogenic factors (e.g. intra-annual distribution of rainfall 85
events, humidity or temperature) as recently shown in Rishmawi et al. (2016). Characterization of the 86
main drivers of vegetation dynamics therefore relies mainly on the distinction between climate-87
induced biomass changes and changes induced by other factors (both anthropogenic and natural) 88
(Knauer et al., 2014; Mbow et al., 2015). For instance, Hickler et al. (2005) and Seaquist et al. (2009) 89
used a process-based vegetation model in which vegetation dynamics predicted by the model without 90
any human influence were compared to vegetation trends observed by remote sensing. The climate 91
contribution can also be assessed with the Rain Use Efficiency (RUE) measure; however, the RUE has 92
been widely questioned due to several limitations (Dardel et al., 2014a; Hein and Ridder, 2006; Hein 93
et al., 2011; Prince et al., 2007). For regions where rainfall is the main limiting factor of vegetation 94
growth, another method, considered robust and more widely accepted, is the residuals method (also 95
called the RESTREND; Wessels et al., 2007) proposed by Evans and Geerken (2004), which is based 96
on the trend analysis of the residuals between the observed NDVI and precipitation-normalized NDVI. 97
While RUE is often considered as the relationship between rainfall and NDVI, RESTREND in turn is 98
simply a rearrangement of RUE into a temporal sequence (Rishmawi and Prince, 2016). Trends in the 99
residuals indicate deviations of NDVI from the NDVI-rainfall relationship and express land 100
improvements or degradations greater than those that can be explained by rainfall alone. Thus, such 101
changes are a potential effect of human activities. Several studies have tested the RESTREND method 102
to identify potential changes in ecosystem conditions over Africa (Dardel et al., 2014a; Huber et al., 103
2011; Ibrahim et al., 2015; Kaptué Tchuenté et al., 2015; Wessels et al., 2007). However, an important 104
but often ignored conceptual limitation of using the RESTREND method is that the biophysical 105
relationship between NDVI-based vegetation productivity and rainfall is supposed to be constant over 106
the time. Yet, Hein et al. (2011) showed that in the Sahelian semi-arid areas, this relationship is far 107
from being linear. In addition, RESTREND will not be able to account for other processes, such as 108
changes in Water Use Efficiency induced by increases in CO2 that also have impacts on vegetation 109
productivity (Donohue et al., 2013). Finally, in addition to the use of NDVI trends to understand 110
vegetation dynamics, new opportunities are appearing in the understanding of vegetation dynamics in 111
drylands by jointly using NDVI and Vegetation Optical Depth (VOD) trends, as attested by Andela et 112
al. (2013) and more recently by Tian et al. (2016) in the Sahel. In particular, it has been shown that 113
NDVI is more sensitive to herbaceous vegetation, while VOD can be used as a proxy for woody 114
vegetation (Andela et al., 2013). 115
Due to the scarcity of reliable long-term ground observations to validate and interpret the low-116
resolution vegetation index trends, analyses of the underlying processes other than climate are rare. 117
Dardel et al. (2014b) related GIMMS-3g NDVI trends with in situ observations of aboveground 118
herbaceous biomass over the Fakara region in Niger and Gourma region in Mali and found a good 119
agreement between the two datasets. By relating these vegetation trends to ground observations, the 120
authors concluded that soil types and soil depth significantly impacted biomass production in Gourma, 121
while no clear pattern could be found for the Fakara site. In Senegal, based on ground-based biomass 122
estimation and a botanical inventory of woody vegetation species, Brandt et al. (2015) assumed that 123
the greening trends come from an increase in tree density. 124
Meanwhile, in line with the emergence of “Land Change Science” (Verburg et al., 2013a) aims at 125
understanding the land system change as resulting from dynamic interplay of the sociological and 126
ecological systems, a myriad of research on Land Use/Land Cover changes (LULCC) and their related 127
drivers has been undertaken in Africa (e.g., Brinkmann et al., 2012; Estes et al., 2012; Kindu et al., 128
2015; Nutini et al., 2013; Pricope et al., 2013; Teferi et al., 2013). These studies make use of different 129
sources of data such as LULCC maps derived from remote sensing data, statistics, surveys or other 130
geospatial data related to accessibility, biophysical or demographic factors (Brinkmann et al., 2012; 131
Kindu et al., 2015; Mutoko et al., 2014; Teferi et al., 2013). While it is acknowledged in the literature 132
that land system changes result from changes occurring in biophysical, social and economic systems 133
across various spatial and temporal scales (van Asselen and Verburg, 2013; Verburg et al., 2013b), the 134
incorporation of long-term vegetation trends observed at regional scale as a way to characterize 135
LULCC has rarely been made in LULCC studies (e.g. Nutini et al., 2013). 136
2. Objectives and overall approach 137
In line with previous studies on the driving forces of vegetation changes in the Sahel, the overall aim 138
of this study was to gain a better understanding of the factors involved in biomass production 139
dynamics (using NDVI as a proxy) between 2000 and 2015, on both a regional (western Sahel) and 140
local (degree square in southwestern Niger) levels, using a combination of remote sensing and various 141
existing geospatial datasets. The specific objectives of this paper are to: 142
(1) Identify areas of significant recent monotonic NDVI trends in the western Sahel zone. 143
(2) Further specify the relative role of rainfall and human factors in NDVI changes on a regional 144
level. 145
(3) Further explore the importance of various types of potential climatic- and LULCC-related 146
drivers of NDVI changes on a local level. 147
Few analyses have been conducted combining regional and local approaches to disentangle the main 148
drivers of biomass production trends at the level of the Sahel. Among them, we can mention the recent 149
study of Brandt et al. (2016), which aimed to assess and understand the woody vegetation trends over 150
the Sahelian belt. Here, we proposed an analysis of biomass production trends on a regional level 151
based on NDVI data together with a more detailed analysis on a local level of the underlying processes 152
by relating vegetation trends with rainfall and the related drivers of LULCC. However, while the 153
Brandt et al. (2016) study focused on the woody vegetation cover during the dry season, the present 154
study focuses on the green herbaceous layer and provides a more extensive analysis at the local level. 155
Figure 1 presents the overall approach developed in this study. We have first analyzed the biomass 156
production trends over a 16-year period (2000–2015) in the western Sahel using growing season 157
integrated NDVI (MOD13Q1 collection 6) time series (iNDVI; Figure 1-1). Then, to assess the role of 158
rainfall and human factors, a classification scheme based on (i) the iNDVI trends, (ii) the correlation 159
between iNDVI and growing season rainfall (iRAIN; hereafter merely referred as rainfall) derived 160
from the TRMM3B43 product, and (iii) the iNDVI residual trend was proposed (Figure 1-2). While it 161
is acknowledged that vegetation productivity may be affected by climate variables other than rainfall, 162
over the Sahel, growing season rainfall, however, remains the primary factor as recently evidenced in 163
Rishmawi et al. (2016) among others. Thus, we chose to restrict our analysis to the study of the 164
relationship between NDVI and growing season rainfall alone. After the main drivers of iNDVI trends 165
were identified over the western Sahel, we conducted a local analysis over a southwestern Niger site to 166
explain the observed iNDVI trends through detailed environmental (rainfall, topography and soil), 167
human (demography, physical accessibility), and land cover change variable analysis using the 168
Random Forest (Breiman, 2001) algorithm. 169
170
Figure 1. Flowchart of the approach adopted in the study: links between the regional and local analyses. The first part
171
(labeled ) corresponds to the first objective of the study, which is the iNDVI trend analysis over the western Sahel.
172
The second part (labelled ) corresponds to the second objective: the identification of the main drivers of iNDVI
173
trends over the western Sahel. The third part (labelled ) corresponds to the identification of the main drivers of
174
iNDVI trends over the Niger site.
175
3. Study site and material 176
3.1. Study site 177
We focused our study on two spatial levels: the regional level, the western Sahel zone, which is 178
defined as the area receiving an annual rainfall ranging from 150 to 750 mm/year, and the local level, 179
southwestern Niger (Figure 2). 180
The western Sahel is characterized by marked seasonality with a long dry season and a short wet 181
season lasting from 1–4 months depending on the latitude. The climate is mainly controlled by the 182
timing, amount, and distribution of rainfall by the progression of the Intertropical Convergence Zone 183
during the well-known West African Monsoon (Lebel and Ali, 2009). Consequently, the vegetation 184
pattern over the Western Sahel area closely follows the rainfall gradient: the northern parts of the 185
western Sahel are dominated by sparse vegetation cover (open sparse grassland and shrubland), and 186
the land is used primarily for grazing, while the southern parts are characterized by a larger amount of 187
vegetation cover with woodland and savanna. Rainfed agriculture and grazing are the main land uses 188
observed in the area (Tucker, 1985). Over the whole western Sahel area, the climatic constraint (i.e., 189
annual rainfall and its spatio-temporal variability) is considered as the most important controlling 190
ecosystem driver. 191
At the local level, we focused on an agropastoral site located in southwestern Niger (12.9°-13.6°N; 192
1.6°-3.1°N), namely, the “Degré Carré de Niamey” (hereafter referred to as the DCN site), which 193
covers an area of approximately 18,000 km². Niger was chosen as a study site because it appears as “a 194
Sahelian exception.” While, overall, greening has been observed over the western Sahel, southwestern 195
Niger has been marked by significant browning trends despite an increase in rainfall (e.g., Anyamba et 196
al., 2014; Dardel et al., 2014b; Fensholt and Rasmussen, 2011a). In addition, between 2000 and 2015, 197
Niger has suffered six major food crises. Thus, a better understanding of the role played by the 198
underlying drivers of biomass productivity changes is essential for such a country for managing food 199
security over the long term. The climate over the DCN site is typically Sahelian and is marked by a 200
high latitudinal gradient with an average annual rainfall ranging from 480 to 630 mm/year despite the 201
area's narrow ranges in latitude and longitude (about 160 km x 110 km). According to D’Herbès and 202
Valentin (1997), the vegetation cover is highly fragmented and composed of three main units: tiger 203
bush on the lateritic plateaus, fallow savanna, and crop fields on the sandy soils. The agricultural 204
production system is dominated by rainfed pearl millet. The area is particularly vulnerable to climate 205
variability because of its strong dependence on rainfall for both livestock and farming. In addition, 206
because of rural population increases in recent decades, most of the arable land is already under 207
cultivation (Hiernaux et al., 2009). 208
209
Figure 2. The study sites. a) Mean integrated NDVI between July and October over the western Sahel zone; b) Main
210
land cover classes (MODIS Land Cover Product, MCD12Q1), c) Landsat 8 image of the DCN site in September 2013
211
(red-green-NIR color composition), and d) anomalies of cumulated rainfall between June and October (deviation
212
from the mean values over the 2000–2015 period) from the TRMM3B43 product over the western Sahel (bar) and the
213
DCN site (line).
214
3.2. Data sources and pre-processing 215
3.2.1. MODIS NDVI 16-day composite collection 6 data 216
A set of 16-day images of NDVI from the new MODIS products available at 250 m (MOD13Q1 217
collection 6; Didan, 2015) was downloaded. The images cover a period from 2000 to 2015 over the 218
western Sahel zone. These images were used to analyze the NDVI trends as a proxy for biomass 219
productivity changes. The MODIS product is corrected for atmospheric effects, including cirrus clouds 220
and aerosols (Vermote et al., 2002) and preprocessed with the CV-MVC (Constrained View angle-221
Maximum Value Composites) algorithm to retain the best observations during each 16-day period 222
using pre-composited (8-day) surface reflectance data (Didan, 2015). However, in areas with a marked 223
rainy season such as the Sahel, residual noise can still be present due to remnant cloud cover, which 224
tends to decrease NDVI values. Thus, in addition to the abovementioned preprocessing, a Savitzky-225
Golay filter was applied to reduce the noise in the NDVI time series(Chen et al., 2004) which allowed 226
matching the upper envelope of the NDVI time series. Finally, the temporal resolution of the NDVI 227
time series was reduced by cumulating the 16-day NDVI values on an annual basis to focus on 228
vegetation growth and avoid noise related to non-vegetated areas or soil moisture contamination. 229
Several methods have been proposed to compute “annual” NDVI values (e.g., Mbow et al., 2013) 230
including NDVI annual sum (Brandt et al., 2015; Nicholson et al., 1998), the maximum growing 231
season NDVI values (Eklundh and Olsson, 2003; Hickler et al., 2005) and the NDVI cumulated over 232
the growing season after removing the dry season NDVI values (Anyamba and Tucker, 2005; Dardel 233
et al., 2014a; Fensholt and Rasmussen, 2011; Tian et al., 2016). To minimize the potential impacts of 234
woody cover (particularly evergreen species) on the NDVI trend analysis (Brandt et al., 2015; Mbow 235
et al., 2013), we restrict our analysis to the annual herbaceous growth season (both rangelands and 236
croplands dominant in the Sahel; including also deciduous trees and shrubs). Thus, NDVI was 237
integrated over the growing season (iNDVI), which takes place in the Sahel between July and October 238
(Anyamba et al., 2014; Anyamba and Tucker, 2005; Dardel et al., 2014a; Fensholt and Rasmussen, 239
2011; Huber et al., 2011). 240
3.2.2. TRMM3B43 rainfall data 241
In the absence of a dense rain gauge network in the study area, a satellite rainfall estimation product 242
was used in this study as a proxy for rainfall (Herrmann et al., 2005), namely, the merged TRMM 243
(Tropical Rainfall Measuring Mission) 3B43v7 dataset, which delivers rainfall estimates at monthly 244
intervals and with 25 km spatial resolution. It combines infrared and microwave information from 245
different sources and is calibrated with monthly rain gauge data to adjust for bias (Huffman et al., 246
2007). The TRMM data were downloaded from 2000 to 2015 and cumulated over 5 months (iRAIN, 247
June-October) to take the time lag between rainfall and vegetative response into account (Fensholt and 248
Rasmussen, 2011; Helldén and Tottrup, 2008). To allow the comparison between iNDVI and iRAIN, 249
the nearest neighbor resampling method was applied to the TRMM3B43 data to match the spatial 250
resolution of the MODIS NDVI data. 251
3.2.3. Other geospatial data 252
As mentioned in the introduction, apart from the climate factors, land use and land cover changes 253
(LULCC) are also considered as change factors in biomass productivity at the local scale. Thus, based 254
on a literature analysis regarding the main drivers of LULCC changes in semi-arid areas (e.g., 255
Brinkmann et al., 2012; Lambin et al., 2001; Teferi et al., 2013) and the availability of data, a set of 256
nine variables was selected that covered three categories (Table 1): (1) natural constraints (slope, 257
toposequence, and type of soil), (2) accessibility (Euclidean distances from roads, rivers, and villages, 258
and traveling time to market), and (3) demography (mean population density for the 2000–2015 period 259
and the change in population density between 2000 and 2015). Among natural constraints, slope is a 260
determinant of soil erosion because it leads to soil fertility loss and chemical soil degradation (e.g., 261
Okou et al., 2016), which, in turn, has an impact on vegetation growth. Slope and toposequence 262
together act as a constraint for land management for cropland expansion in particular, because gentle 263
slopes and low elevations are generally more suitable for agricultural activities (e.g., Teferi et al., 264
2013; van Asselen and Verburg, 2012). Lastly, soil type is recognized as one of the most important 265
factors for vegetation growth and crop production due to nutrient availability, water retention 266
capability or root conditions. Thus, soil type determines the probability of agricultural use. 267
All the variables related to accessibility are considered as drivers of agricultural expansion or 268
intensification, with (1) transportation cost and physical accessibility to a piece of parcel (distance 269
from roads), (2) suitability of land for agricultural use through water availability (distance from 270
rivers), and (3) proximities of farms to markets, which determine the availability of farming inputs and 271
the possibility of selling harvest products (distance from a city and travelling time to market; e.g., 272
Brinkmann et al., 2012; Geist and Lambin, 2002, 2004; van Asselen and Verburg, 2012). Lastly, 273
population density and changes in population density can be considered as proxies for potential 274
pressures on natural resources induced by a growing need to increase food production or fuelwood 275
(e.g., Geist and Lambin, 2002; Kindu et al., 2015; Lambin et al., 2001). 276
In addition to these variables, two climatic variables were also considered: trends in rainfall between 277
2000–2015 growing periods and mean rainfall for the 2000–2015 growing periods. These variables 278
can have a direct impact on biomass productivity because they determine the type and the 279
development of natural and cropped vegetation. They can give rise to LULCC due to a potential shift 280
in land management (e.g., adaptation of cropping practices and strategies). When persistent changes in 281
rainfall patterns occur (e.g., Keys and McConnell, 2005; Nutini et al., 2013; van Asselen and Verburg, 282
2012), changes in biomass productivity may also be the result. 283
Table 1. Variables used as possible drivers of biomass productivity changes over the DCN site.
284
Variable class Variable name Definition and units Data source Spatial resolution
Climatic
RAIN_M Mean growing period rainfall 2000-2015 (mm/year)
TRMM3B43 25 km RAIN_TREND Growing period rainfall trend (OLS)
2000-2015
TRMM3B43 25 km
Natural constraints
SLOPE Slope (degree) SRTM DEM 30+ 30 m TOPO Toposequence SRTM DEM 30+
SOIL Type of soil Harmonized World Soil Database-IIASA 1
1 km
Accessibility
DIST_RIV Euclidean distance from river (meters) SRTM DEM 30+ vector DIST_CIT Euclidean distance from villages with
more than 1000 habitants (meters)
National Institute of Statistics, Niger
vector DIST_ROAD Euclidean distance from road (meters) GIST Portal 2 vector
MARKET Traveling time from city market with a population > 20,000 (hours)
HarvestChoice 3 1 km
Demography
POP_DENS Mean population density for the
2000-2015 period AfriPop
4 1 km
POP_DIFF Population density difference between 2000 and 2015
AfriPop4 1 km
Land Cover Changes
LAND_COV Land Cover Changes between 2001 and 2013 (10 classes) Landsat 5 and Landsat 8 30 m 1 http://webarchive.iiasa.ac.at/Research/LUC/External-World-soil-database/HTML/ 285 2 https://gistdata.itos.uga.edu/ 286 3 http://harvestchoice.org/data/tt_20k 287 4 http://www.worldpop.org.uk/ 288 289
Finally, a map of land cover change between 2001 and 2013 was used to analyze the hypothetical link 290
between the iNDVI trends and the land cover change types. Classes of land cover change acquired 291
from this map were also considered as a possible direct explanatory variable of biomass productivity 292
changes (Figure 3). The land cover change map was obtained by using a post-classification 293
comparison approach of two land cover classifications derived from Landsat images. The images were 294
classified using a supervised object-based expert classification, and the resulting land cover maps 295
(2001 and 2013) were validated against a set of 1200 independent validation objects randomly selected 296
over the DCN site. The observed land cover classes of each object were manually labelled through 297
visual interpretations of Google Earth® high resolution satellite images and Landsat images for each 298
date. An overall accuracy of 88% for 2001 and 82% for 2013 was obtained assuming that the 299
validation dataset obtained by photo interpretations was free of error. The resulting land cover change 300
map was composed of six land cover classes characterized by no change between 2001 and 2013 301
(plateaus, waterbodies, cropland—both fallow and grassland—degraded hillslopes, bare soil and 302
natural vegetation) and three classes characterized by changes: areas of cropland loss (cropland in 303
2001 and degraded hillslopes, bare soil or natural vegetation in 2013), areas with natural vegetation 304
expansion (degraded hillslopes or bare soil in 2001 but natural vegetation in 2013), and areas of 305
cropland expansion (degraded hillslopes, bare soils or natural vegetation in 2001 and cropland in 306
2013). 307
308
Figure 3. Map of the land cover changes over the DCN site between 2001 and 2013 derived from Landsat images.
309
4. Methods 310
4.1. NDVI trends 311
To investigate the NDVI changes, pixel-wise temporal trends (iNDVI) were computed over the 312
western Sahel zone during the 2000-2015 period using an Ordinary Least Squares (OLS) regression. 313
OLS is considered as a simple but robust way to detect long-term trends in NDVI time series (e.g., 314
Anyamba et al., 2014; Helldén and Tottrup, 2008; Ibrahim et al., 2015). OLS measures the 315
relationship between the iNDVI as a dependent variable and time (i.e., in the present case 16 years) as 316
an independent variable and is represented by the following equation: 317
Linear model (1)
where is the y-intercept, which gives values at the start of the observed period, and 318
is the slope coefficient, which measures the rate of change of per unit of . 319
By using Ordinary Least Squares regression as a means to measure change in iNDVI, we assumed in 320
this study that changes in biomass productivity occur as gradual and linear processes through time. 321
However, this approach cannot detect abrupt breaks in the time series and will necessarily obscure the 322
existence of short-term trends as previously mentioned by Jamali et al. (2014). 323
To examine the consistency of trends over time, the p-values of two-sided Student’s t-tests were 324
computed for the slope coefficients ( ). While it has recently been suggested by Colquhoun (2014) to 325
consider at least a p-value < 0.001 to make conclusions concerning the significance of obtained 326
results, to be consistent with most of studies on NDVI trend analysis, all trends at the 95% confidence 327
level (p-value<0.05) or higher were considered statistically significant (i.e., null hypothesis H0: = 0). 328
Nonetheless, different classes of significance (0.01<value<0.05, 0.001<value<0.01 and p-329
value<0.001) are also presented. The direction of change (an increase or decrease in biomass 330
production) was determined by analyzing the sign of the slope coefficient. 331
4.2. Drivers of NDVI trends at the regional level 332
4.2.1. NDVI-rainfall correlation 333
In semi-arid areas such as in the Sahel, the biomass production, and thus NDVI, is known to be highly 334
dependent on rainfall, both the inter-annual rainfall variability as well as the timing and intra-335
seasonnal distribution of rainfall events. Since annual rainfall is usually considered as the main driver 336
of biomass production, we focused this study only on the growing season rainfall. The pixel-wise 337
Pearson correlation coefficient (r) between iNDVI (July–October NDVI) and iRAIN (June–October 338
RAIN) over the 2000–2015 period was calculated for each pixel to evaluate the nature and strength of 339
the NDVI-rainfall relationship. The iNDVI-iRAIN relationship was considered statistically significant 340
at the 95% level (p-value<0.05, corresponding to r =0.49). The predicted values of iNDVI for each 341
year and each pixel from the observed iRAIN were then computed. 342
4.2.2. Residual NDVI trends (RESTREND) 343
Because biomass production is greatly controlled by inter-annual rainfall variability in semi-arid 344
environments, the trends in iNDVI contain a significant rainfall signal. As suggested by Evans and 345
Geerken (2004), to distinguish rainfall-induced changes from changes induced by other factors, the 346
rainfall component must be removed from the iNDVI signal. To isolate the iNDVI trends not 347
explained by rainfall, we computed the pixel-wise iNDVI residuals (RESTREND; Wessels et al., 348
2007)—the difference between the observed iNDVI and the predicted iNDVI. However, while it has 349
been suggested that RESTREND is a useful method for detecting vegetation changes independent of 350
rainfall (e.g. Wessels et al., 2007), it is not without inherent limitations and its validity is subjected to 351
several requirements owing to its dependence to RUE, as recently discussed in Rishmawi and Prince 352
(2016). Particularly, the use of RESTREND is relevant only in cases where significant linear 353
relationships between iNDVI and iRAIN are observed (Fensholt et al., 2013; Fensholt and Rasmussen, 354
2011; Wessels et al., 2012). For cases with high levels of changes, the relationship between iNDVI 355
and iRAIN sometimes becomes weak, thus making the RESTREND method unreliable (Wessels et al., 356
2012). In the present study, pixels with no significant vegetation productivity to rainfall correlation 357
(r<0.49) were excluded from the residual analysis. Any trend in the iNDVI residuals could then be 358
interpreted as a change in biomass production independent of growing seasonal rainfall, assuming 359
other causative factors such as land cover or land use changes. Trends in the iNDVI residuals were 360
computed following the approach used for the iNDVI and assuming that the MODIS NDVI and 361
TRMM3B43 measurements were error-free thus not affecting the significance of the RESTREND 362
regression line. However, if rainfall data are accompanied by a measure of errors, a correction can be 363
applied in the process to test the significance of RESTREND values as in Rishmawi and Prince 364
(2016). 365
4.2.3. Mapping the main drivers of NDVI trends over the Sahel 366
The conceptual approach developed in this study relies on the fact that biomass productivity dynamics 367
(using iNDVI trends as a proxy) on a per-pixel basis result mainly from interactions with climate (i.e. 368
rainfall) and human factors. Thus, we postulated that if we could isolate the climatic factors from the 369
human factors, the relative roles of both factors in NDVI trends could be assessed and mapped. 370
While most studies isolate rainfall-driven biomass production changes from changes induced by 371
human factors (hereafter referred to as "other factors") using either RUE or RESTREND analyses (e.g. 372
Evans and Geerken, 2004; Ibrahim et al., 2015; Prince et al., 2007; Wessels et al., 2007), this study 373
proposes a classification scheme to assign relative roles to rainfall and other causative factors in NDVI 374
changes. 375
This classification scheme results in a set of 6 possible decision rules based on the slope of the iNDVI 376
trend, the iNDVI-iRAIN coefficient of correlation and the slope of the iNDVI residual trend (Table 2). 377
It reflects the assumption that biomass production could be driven (i) only by rainfall, (ii) only by 378
factors other than rainfall, or (iii) by a combination of both factors (rainfall and other factors). The 379
combination case was not taken into account when considering the first two methods. The impact of 380
other factors is assessed using the slope of the iNDVI trend corrected from the rainfall effect (i.e., 381
NDVI residual trend), for which a positive trend (slope >0) means that vegetation productivity 382
increases more than can be explained by rainfall alone, and a negative trend (slope < 0) means that 383
vegetation productivity decreases more than can be explained by rainfall alone (Table 2). Thus, a 384
positive iNDVI trend (i.e., an increase in biomass productivity) associated with a significant iNDVI-385
iRAIN correlation (r > 0.49) and a significant positive trend in iNDVI residual (slope > 0) indicates 386
that the vegetation growth benefits both from rainfall and from other factors because—after removing 387
the rainfall effect—a positive trend can still be observed in iNDVI (Table 2). In contrast, if a 388
significant iNDVI-iRAIN correlation is observed together with an iNDVI residual negative (slope <0) 389
or non-significant trend (p-value <0.05), the observed vegetation growth is due mainly to the rainfall 390
factor. Finally, when there is no iNDVI-iRAIN correlation, it means that vegetation growth benefits 391
only from factors other than rainfall (Table 2). The same reasoning is followed to interpret a negative 392
iNDVI trend. 393
The results of the iNDVI trends main drivers’ map over the Sahel are then illustrated through different 394
case studies extracted from the literature. 395
Table 2. Classification rules to disentangle rainfall-driven NDVI changes from changes induced by other factors.
396 iNDVI trend (p-value<0.05) Coefficient of correlation iNDVI-iRAIN
iNDVI residual trend (p-value<0.05)
Interpretation of the iNDVI trend
Positive iNDVI trend (slope>0)
r>0.49 Slope>0 Rainfall factor and other factors r>0.49 Slope<0 or Slope
(p-value>0.05) Rainfall factor r<0.49 Other factors
Negative iNDVI trend (slope <0)
r>0.49 Slope<0 Rainfall factor and other factors r>0.49 Slope>0 or Slope
(p-value>0.05) Rainfall factor r<0.49 Other factors
4.3. Drivers of NDVI trends over the DCN site 397
To extend the analysis of the underlying factors of the iNDVI trends, a Random Forest algorithm (RF) 398
was used to classify and identify the most important factors at the local level. To accomplish this, the 399
previous two classes (i.e., “rainfall factor” and “other factor” used at the regional level) were 400
disaggregated into 14 potential drivers and used as explanatory variables in RF (Table 1), while 401
iNDVI trend classes (negative, positive, or no significant trends) were treated as the variables to be 402
explained. RF is an ensemble learning method based on bagging (repeated selecting of random 403
sampling with replacement) and used for classification. It combines large numbers of classification 404
trees to optimize classification accuracy (Breiman, 2001). RF fits several small classification trees 405
based on random samples of observations and a random sample of variables. These small 406
classification trees are then aggregated, and the resulting class is elected by a majority vote (Breiman, 407
2001). Here, first and foremost, we were interested in identifying the drivers with the most important 408
contributions in distinguishing the different iNDVI trend classes. Thus, we benefited from the capacity 409
of RF to determine variable importance in a classification process using the RF internal variable 410
importance measures. In the present study, we focused on the mean decrease in accuracy. The mean 411
decrease in accuracy consists of a random permutation of explanatory variables in the construction of 412
the classification trees. It then measures the difference in the accuracy (named Out-Of-the-Bag error 413
and computed internally on the samples not used during tree construction) before and after the 414
switching process (Cutler et al., 2007). Thus, in our case study, the larger the decrease in accuracy is, 415
the higher the importance of the drivers is in explaining iNDVI trends. In this study, the RF algorithm 416
was implemented using the RandomForest package available in R (Liaw and Wiener, 2002). 417
5. Results 418
5.1. NDVI trends analysis 419
We found that 79% of the pixels of the western Sahel zone are characterized by no significant iNDVI 420
trend (Table 3; Figure 4a) and that most of the significant trends were positive (16%). Among these, 421
20% were highly significant (p-value < 0.001; Table 4; Figure 4a). When analyzing the spatial pattern 422
of the iNDVI trends (Figure 4a), we observed that the changes in iNDVI across the western Sahel zone 423
are spatially heterogeneous. The iNDVI trends were positive over the western Sahel (mainly in Mali, 424
Mauritania and Burkina Faso, < 2°W) while the eastern part of the western Sahel (> 0°, mainly Niger 425
and Nigeria) is predominantly characterized by a strong reduction in iNDVI over the period 2000– 426
2015 (p-value< 0.001 or p-value <0.01; Table 4). This spatial distribution of iNDVI trends appears to 427
be the result of a recent process because it is generally observed only in studies conducted from 428
approximately 2011 or later (e.g., Dardel et al., 2014b) and not in older studies (those conducted 429
before 2007) (e.g., Herrmann et al., 2005; Huber et al., 2011). It is also in agreement with a study 430
(Brandt et al., 2016) that covers the same period (2000–2014) but focuses on woody vegetation land 431
cover changes. When analyzing the DCN site level, the spatial distribution of trends differed from 432
those at the western Sahel level (Figure 5a; Table 3). While the western Sahel zone exhibits mainly 433
linear positive trends (i.e., a greening trend), the distribution of linear trends was reversed for the DCN 434
site, where negative linear trends accounted for 29% of the study area. Among these, 31% were highly 435
significant (p-value < 0.001; Table 4; Figure 6a) meaning that the last 16 years (2000–2015) have been 436
marked by a reduction in biomass productivity (i.e., a “browning” trend). 437
Table 3. Distribution of the iNDVI and iNDVI Residual trends (p-value < 0.05) over the western Sahel region and the
438
DCN site obtained using MODIS NDVI and TRMM3B43 time series images between 2000 and 2015.
439
Trend types (p-value < 0.05)
Linear Negative Linear Positive No trend western Sahel NDVI trend (%) 5 16 79 Residual trend (%)* 2 13 85 DCN site NDVI trend (%) 29 4 67 Residual trend (%)** 10 5 85
* Among the 56% of pixels with a significant NDVI-rainfall correlation over the western Sahel
440
** Among the 7.6% of pixels with a significant NDVI-rainfall correlation over the DCN site
441
Table 4. Distribution of the iNDVI trends types according to their significance level over the western Sahel region and
442
the DCN site using MODIS NDVI time series between 2000 and 2015.
443
Trend types (p-value < 0.05)
Linear Negative Linear Positive
p-value<0.001 0.001<p-value<0.01 0.01<p-value<0.05 p-value<0.001 0.001<p-value<0.01 0.01<p-value<0.05
western Sahel
NDVI trend (%) 20 30 50 11 29 60
DCN site
NDVI trend (%) 31 32 37 14 30 57
5.2. Drivers of NDVI trends at the regional level 444
5.2.1. The NDVI-rainfall relationships 445
Slightly over half (56%) of the Sahelian belt exhibited significant iNDVI-iRAIN linear relationships, 446
but this proportion fell to 7.6% for the DCN site. The spatial pattern of the iNDVI-iRAIN correlation 447
showed that the area with low correlation seemed to be associated with highly significant negative 448
changes (p-value < 0.001 and in biomass production. This is particularly visible in Niger, as 449
already noted by Fensholt and Rasmussen (2011) (Figure 5a and Figure 5b). 450
451
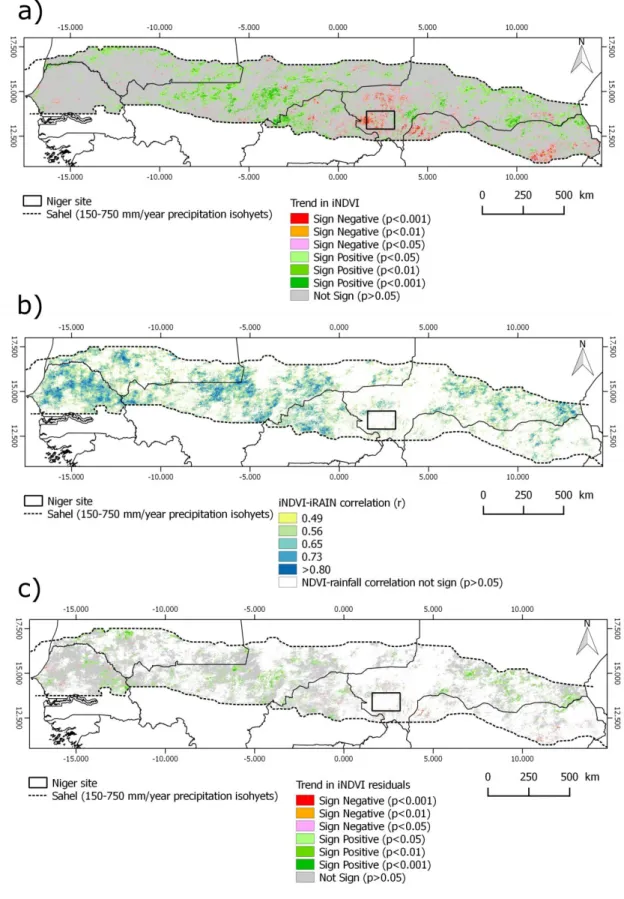
Figure 4. Spatial distribution over the western Sahel of a) the MODIS trends; b) the correlation coefficient
452
between MODIS and TRMM3B43 June–October rainfall (significant at the 5% level for r=0.49); c) the iNDVI
453
residual trends obtained for pixels with a significant linear NDVI-rainfall relationship during the 2000–2015 period.
5.2.2. NDVI residual trends analysis 455
For pixels marked by a significant vegetation productivity-rainfall relationship, the iNDVI residuals 456
represent the part of herbaceous biomass production that is not fully explained by rainfall variability 457
during the growing season. Figure 4c shows the geographical distribution of trends in the iNDVI 458
residuals throughout the western Sahel; Figure 5c shows the same trends for the DCN site, and Table 3 459
lists the distribution of the trend types. Large areas without significant trends were detected (85%); 460
however, some areas (e.g., east of Senegal or central part of Mali) displayed highly positive trends in 461
the iNDVI residuals (13% of the residual trends). These correspond to spatially consistent areas where 462
the herbaceous biomass production increased more than could be explained by rainfall only. When 463
looking at the distribution of iNDVI residual trend types over the DCN site (Table 3), only 15% 464
consisted of significant trends, of which approximately two-thirds were highly negative. Some authors 465
have suggested that this NDVI decline trend may be due to land use or land cover changes around the 466
city of Niamey (Anyamba et al., 2014; Kaptué Tchuenté et al., 2015), an assumption explored 467
hereafter. 468
5.2.3. Mapping the main drivers of NDVI over the Sahel 469
The respective roles of rainfall and other factors of change in iNDVI changes were assessed following 470
the rule sets presented in Table 2. Figure 6a shows that half the increase in biomass production over 471
the 2000–2015 period is explained by factors other than rainfall only (52%; Figure 6b), and the other 472
half is explained by rainfall alone or rainfall combined with other factors. The rainfall factor-driven 473
trends occurred over a specific area: from the south of Mauritania to the north of Burkina Faso. The 474
decrease in biomass production was mainly explained by the impacts of factors other than rainfall 475
(88%), while the combination of both rainfall and other factors accounted for 11% of the negative 476
iNDVI trends and could be pinpointed in the north of Nigeria. Figure 5c shows a zoomed area of the 477
DCN site, making it clear that both increases and decreases in biomass production seemed to be 478
mainly driven by factors other than rainfall only (90% and 98%, respectively). However, increases in 479
biomass production occurred in only a few areas—mainly in the eastern portion of the site—while the 480
rest of the DCN site was dominated by a degradation in vegetation conditions. 481
482
483
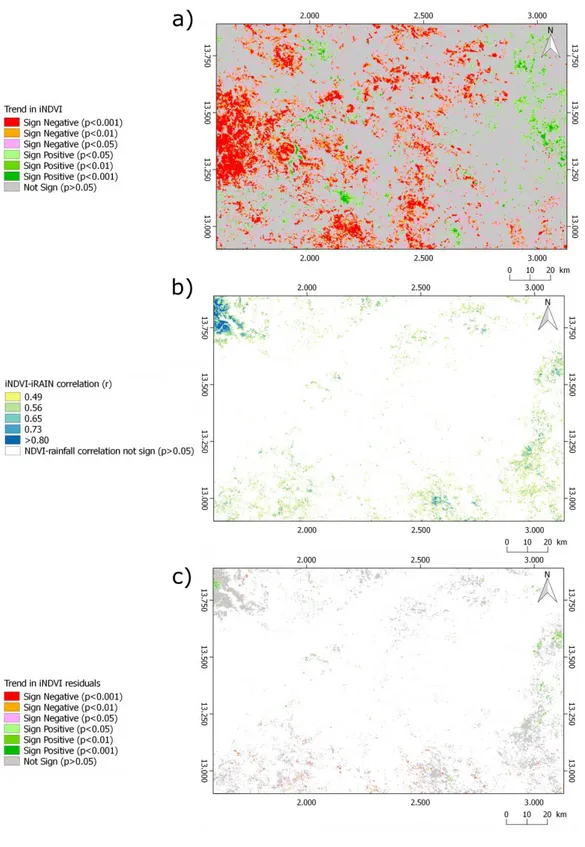
Figure 5. Spatial distribution over the DCN site of a) the MODIS iNDVI trends; b) the correlation between MODIS
484
iNDVI and TRMM3B43 June–October rainfall (significant at the 5% level for r=0.49); and c) the iNDVI residual
485
trends obtained for pixels with a significant NDVI-rainfall linear relationship during the 2000–2015 period.
487
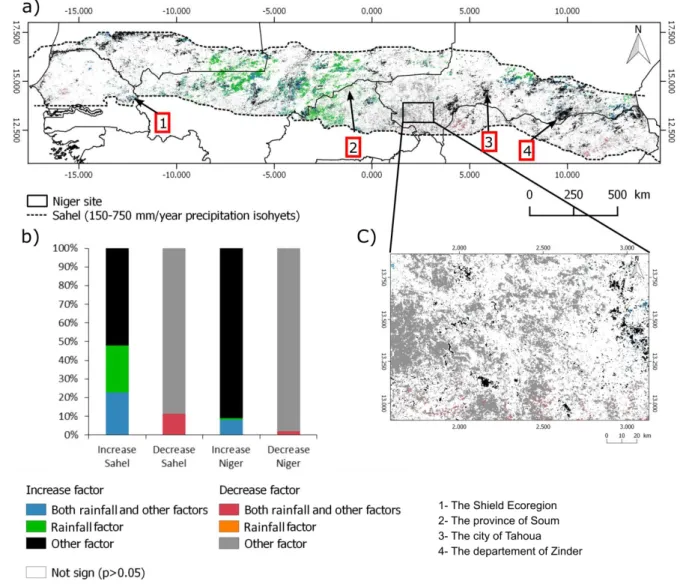
Figure 6. a) Spatial distribution of the main drivers of the biomass production changes over the western Sahel; b)
488
distribution of driver types according to the direction of changes (increase or decrease) for western Sahel and the
489
DCN site; and c) zoomed area of the DCN site.
490
5.3. Drivers of NDVI trends at the local level 491
As noted previously, the DCN site presented large areas of negative iNDVI trends for which rainfall 492
did not appear to be the main driver (Figure 6c). A local analysis was conducted to explore the 493
interpretation of potential underlying causes more deeply. 494
As a first overview, we analyzed the distribution of trend types on the basis of land cover changes. 495
From Table 5, it can be observed that lateritic plateaus, degraded hillslopes, natural vegetation and, to 496
a lesser extent, cropland loss (Figure 3) are land cover classes where a clear pattern in the distribution 497
of trend types is particularly notable. Specifically, these classes experienced a strong decrease in 498
biomass production between 2000 and 2015 (47% for plateaus, 38% for degraded hillslopes, 29% for 499
natural vegetation and 25% for cropland loss). For the other types of land cover classes, no clear trend 500
patterns were observed. 501
Then, a RF algorithm was employed to identify the most important drivers of iNDVI changes based on 502
the importance variable measures provided. The importance variables were used for both the general 503
model (i.e., for all types of trend) and for each trend class separately, allowing a specific assessment of 504
drivers. The overall accuracy of the final RF model was estimated at 80%. Figure 7 shows the relative 505
importance of the contribution of the five most important variables to the RF classification model 506
generated by considering rainfall, natural constraints, accessibility, demography and land cover data. 507
For trend types or for the overall RF model, the three most contributions are, in order of importance, 508
the mean growing period rainfall, the distance from villages, and the type of soils. Other contributing 509
variables are the travel time from markets and the distance of farms from rivers, except for linear 510
negative trends for which land cover changes and topography are the most important variables, in 511
accordance with the results shown in Table 5. 512
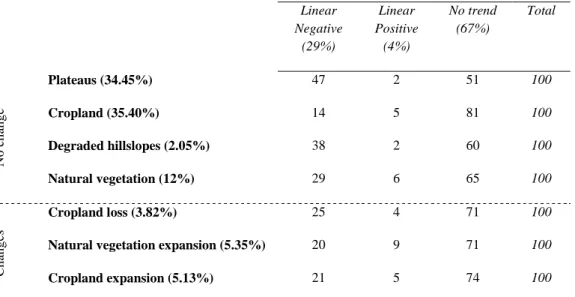
Table 5. Distribution of trend types according to land cover and land cover changes* between 2001 and 2013.
513 Linear Negative (29%) Linear Positive (4%) No trend (67%) Total No c h an g e Plateaus (34.45%) 47 2 51 100 Cropland (35.40%) 14 5 81 100 Degraded hillslopes (2.05%) 38 2 60 100 Natural vegetation (12%) 29 6 65 100 Ch an g es Cropland loss (3.82%) 25 4 71 100
Natural vegetation expansion (5.35%) 20 9 71 100
Cropland expansion (5.13%) 21 5 74 100
* Waterbodies and bare soil classes were excluded from the analysis because they represent a non-significant area (less than
514
1%).
516
Figure 7. Importance of variables in the Random Forest model according to NDVI trend classes over the DCN site: a)
517
all classes; b) no trend; c) linear negative trend; and d) positive linear trend. Only the first five variables are
518
displayed. Their importance is given in the “Mean decrease in accuracy”. See Table 1 for variable abbreviations.
519
The analysis of the distribution of trend types for the five RF most important variables (Figure 8) 520
indicates that areas far from villages (> 6 km), from rivers (> 8 km) and from markets (> 2 h) were 521
more prone to undergo decreases in biomass production (i.e., a linear negative trend). In contrast, the 522
areas with increased biomass production (i.e., a linear positive trend) generally occurred around 523
villages (<6 km) and close to rivers (< 8 km) and markets (< 2 h). 524
525
Figure 8. Distribution of trend types for the five most important Random Forest variables a) mean growing period
526
rainfall; b) Euclidean distance from villages; c) type of soil; d) Euclidean distance from rivers; and e) travelling time
527
from city market; for the DCN site.
528
6. Discussion 529
6.1. NDVI trends between 2000 and 2015 530
For the period 2000–2015, our results revealed that linear positive iNDVI trends occurred mainly in 531
the central part of Mali or southern portion of Mauritania. These results correspond with recent 532
greenness trends reported by Hoscilo et al. (2014), who considered the 2001–2010 period based on 533
SPOT-VGT NDVI time series, and with Cho et al. (2015), based on MODIS EVI acquired between 534
2000 and 2009. Our results also agreed with previous regional-scale findings that analyzed NDVI 535
trends over longer time periods based on GIMMS NDVI data (Anyamba et al., 2014; Dardel et al., 536
2014b; Herrmann et al., 2005; Huber et al., 2011; Seaquist et al., 2009), thus verifying a longer-term 537
process. 538
In contrast, hotspots of highly significant negative iNDVI trends were highlighted along the western 539
Niger and the Niger-Nigeria border. In this area, regardless of what period is considered, what data is 540
used, or which analysis techniques were employed, western Niger (corresponding to the Tillaberi 541
province) has been recognized as an area of consistent degradation in biomass production since at least 542
the beginning of the 21st century, according to the works of Boschetti et al. (2013) over the 1998– 543
2010 period, or Hoscilo et al. (2014) over the 2001–2010 period. More generally, however, this 544
browning trend has been observed since the 1980s (e.g., Huber et al., 2011 over the 1982–2007 period 545
or Dardel et al., 2014b over the 1982–2011 period). 546
One salient point of difference between this study and previous studies concerned Senegal. This 547
country has been considered as a hotspot of greening trends regardless of which period is considered 548
(e.g., Brandt et al., 2014; Fensholt and Rasmussen, 2011; Huber et al., 2011), but we found mainly 549
non-significant iNDVI trends. Based on the findings of a recent study, conducted over the same period 550
but focusing on woody cover changes during the dry season (Brandt et al., 2016), we can assume that 551
the generally observed greening trend in Senegal is probably more closely linked to a positive trend in 552
vegetation productivity of long-living woody cover (evergreen species), while annual herbaceous layer 553
(including also some deciduous trees and shrubs) has probably had inter-annual variations (i.e., no 554
trend) as shown in our study. This assumption is supported by the studies of Brandt et al. (2015), 555
which are based on ground-based herb biomass estimations, and of Kaptué Tchuenté et al. (2015). 556
6.2. Drivers of NDVI at the regional level 557
6.2.1. The mitigating impact of rainfall on NDVI trends 558
As expected, iNDVI in the Sahel was found to be correlated with iRAIN over a large part of the study 559
area. Nevertheless, this dependence on growing season rainfall is not general, because areas of low 560
correlation (i.e., r <0.49) were found in Niger and in northern Mali, among others. For those areas, 561
observed changes in biomass production are due to factors other than rainfall (e.g., temperature) or 562
human factors (e.g., LULCC) that could have a stronger influence than rainfall variability. In the 563
northern part of the western Sahel (the arid zone), this low correlation could be explained by the very 564
patchy distribution of vegetation as well as the low annual rainfall: both are factors that are not 565
correctly captured by satellite sensors. For the remaining portion of the western Sahel, when 566
considering water availability as the sole driver ignoring, for now, other potential drivers, the low 567
iNDVI-iRAIN correlation could be explained by: (i) greater dependence of herbaceous biomass 568
production on intra-annual rainfall distribution and its timing rather than the total amount of annual 569
growing season rainfall or (ii) a possible water supply other than rainfall. For the latter case, for areas 570
such as the inner Niger delta (Mali) or along the river in southwest Niger, we can assume that 571
vegetation production is less rainfall-limited due to exogenous stream flows, as already mentioned by 572
Huber et al. (2011). In any case, this is valid only if water availability is the single determinant of 573
vegetation growth, which is rarely the case at local scales where vegetation growth is determined by 574
complex interactions between multiple drivers. By focusing our study on the 2000–2015 period, we 575
provided a new insight on the impact of rainfall on vegetation over recent years. In contrast to studies 576
conducted over earlier periods that generally showed an overall positive NDVI-rainfall correlation 577
(e.g., Fensholt et al., 2012; Herrmann et al., 2005), this study showed that in recent years, only 56% of 578
the area has a significant NDVI-rainfall correlation, meaning that for a large part of the Sahelian areas, 579
the broadly accepted predominance of annual rainfall variability on vegetation growth and dynamics is 580
now challenged by other factors. 581
This is reinforced by the analysis of the NDVI residual trends that were used to detect trends in 582
biomass production induced by factors other than rainfall such as land use changes or population 583
pressure. Our study revealed mainly areas of positive iNDVI residual trends in the eastern part of the 584
western Sahel (e.g., Senegal or Mali) meaning that biomass production has increased more than can be 585
explained by rainfall. This result was also consistent with the findings of Fensholt and Rasmussen 586
(2011), who found positive trends in the western part of the Sahel based on a RUE linear trend 587
analysis using residual NDVI estimates (which can be considered equivalent to the RESTREND 588
method) for the 1982–2007 period. For these areas, this suggests that iNDVI positive trends are 589
temporally and spatially constant. The iNDVI residual trends obtained in this study were also spatially 590
consistent with the study of Kaptué Tchuenté et al. (2015) and Ibrahim et al. (2015) who found areas 591
of positive residual trends located mainly in Senegal and Mali over two 30-year periods (1983–2012 592
and 1982–2012, respectively). 593
6.2.2. Case study analyses of NDVI trends from the literature 594
A classification scheme based on iNDVI trend, the iNDVI/iRAIN correlation and iNDVI residual 595
trend was proposed as an original contribution to the existing literature on the underlying drivers of 596
vegetation changes over the Sahelian zone. Here, we illustrate our results in the light of available 597
independent knowledge. Four specific sites (numbered from 1 to 4 in Figure 6a) where studies have 598
previously been carried out were identified in the literature and used here. 599
In Senegal (zone 1, Figure 6a), we found some areas that were characterized by an increase in biomass 600
production due to a combination of rainfall and other factors. In this study, these other factors were 601
found to be dominant for biomass production increases in the western part of the Sahel. However, in 602
some areas (close to where Senegal, Mauritania and Mali meet), rainfall and other-induced factors all 603
played a significant role. For the Senegalese part, according to Tappan et al. (2004), this corresponds 604
to the Shield ecoregion, which is characterized by low human population density and low 605
environmental pressures, leading to a high degree of biodiversity for both fauna and flora. Thus, we 606
could assume that the relatively high rainfall and the relative stability of summer rainfall since the 607
2000s (Funk et al., 2012) have favored the growth of woody and crop vegetation. 608
The second site we identified is situated in Soum province in northern Burkina Faso (zone 2, Figure 609
6a) for which we found a predominance of negative iNDVI trends explained by other factors. This 610
corresponded to the area studied by Rasmussen et al. (2014), according to whom the NDVI trends 611
observed in the northern part of their study area were closely linked to landscape elements (plateaus 612
and slopes). They suggested that a possible explanation was a loss of woody cover, possibly induced 613
by increased grazing. 614
Third, near the city of Tahoua in Niger (zone 3, Figure 6a), we found a small area of increase in 615
biomass production due to other factors. This corresponded to the area of the “Keita Project,” which 616
was launched in 1982 with the objective of increasing food security while combating desertification by 617
promoting soil and water conservation, natural resource management, and reforestation (Tarchiani et 618
al., 2008), as mentioned previously by Herrmann et al. (2005). 619
Finally, the region of Zinder in south Niger (zone 4, Figure 6a) also displayed a significant increase in 620
biomass production induced by other factors. Since the late 1980s, farmers from the Zinder region 621
have been encouraged to reforest their fields through the Farmer-Managed Natural Regeneration 622
(FMNR) project, which concentrates on protecting and managing the regeneration of small trees and 623
shrubs among cropped fields (Reij et al., 2009). In the mid-2000s, it was estimated that nearly 1 624
million ha have been affected by FMNR, with a tree density ranging between 20–120 trees/ha 625
(Larwanou et al., 2006). Thus, by increasing the density of the woody cover, one impact of FMNR is, 626
among others, the improvement of soil fertility through the decomposition of plant litter, added 627
nutrient supply from animals due to the integration of livestock in cropping systems, and the 628
conservation of nitrogen-fixing species such as Faidherbia Albida (Reij et al., 2009). As a 629
consequence of this improvement in soil fertility, crop productivity increased; thus, positive iNDVI 630
trends were observed. 631
Apart from these specific case studies, where possible explanations can be found in the literature, the 632
method developed here can only help localize and identify the main drivers of biomass production 633
dynamics. Exact causes of the observed trends must be determined by more detailed analyses at a finer 634
scale. 635
6.3. Drivers of NDVI trends in the DCN site 636
6.3.1. Explaining the overall trends 637
Even though biomass production dynamics result from complex interactions between different factors, 638
in arid environments such the western Sahel, rainfall is considered as an overriding factor. Thus, we 639
expected that variables related to rainfall would be the most important factors of discrimination 640
between all trend type classes. Our assumptions were verified by the RF model because overall, as 641