HAL Id: hal-00304709
https://hal.archives-ouvertes.fr/hal-00304709
Submitted on 1 Jan 2002HAL is a multi-disciplinary open access archive for the deposit and dissemination of sci-entific research documents, whether they are pub-lished or not. The documents may come from teaching and research institutions in France or abroad, or from public or private research centers.
L’archive ouverte pluridisciplinaire HAL, est destinée au dépôt et à la diffusion de documents scientifiques de niveau recherche, publiés ou non, émanant des établissements d’enseignement et de recherche français ou étrangers, des laboratoires publics ou privés.
small Mediterranean mountain catchment in the
Pyrenees
F. Gallart, P. Llorens, J. Latron, D. Regüés
To cite this version:
F. Gallart, P. Llorens, J. Latron, D. Regüés. Hydrological processes and their seasonal controls in a small Mediterranean mountain catchment in the Pyrenees. Hydrology and Earth System Sciences Discussions, European Geosciences Union, 2002, 6 (3), pp.527-537. �hal-00304709�
Hydrological processes and their seasonal controls in a small
Mediterranean mountain catchment in the Pyrenees
Francesc Gallart, Pilar Llorens, Jérôme Latron and David Regüés
Institute of Earth Sciences ‘Jaume Almera’ (CSIC), Lluis Solé Sabarís s/n, E-08028 Barcelona E-mail for corresponding author: [email protected]
Abstract
The Vallcebre catchments are located in a middle mountain area of the Pyrenean ranges, built up by sedimentary rocks and loamy soils. The vegetation cover is pastures and forests of Pinus sylvestris, mostly occupying former agricultural terraces. Some relatively small, heavily eroded landscapes (badlands) occur in the catchments, playing a relevant hydrological and geomorphic role. Annual precipitation is 924 mm and potential (reference) evapotranspiration is about 700 mm. Rainfall interception in forests represents about 24% of precipitation; interception rates were similar throughout the seasons because of a compensation between rainfall intensities and atmospheric conditions. Soil moisture showed a temporal pattern characterised by the occurrence of marked deficit periods in summer and also, but less pronounced, in winter. During most of the year, subsurface flows on hillslopes drove the spatial organisation of soil moisture and the occurrence of saturated areas. Nevertheless, this spatial organisation was also controlled by the patterns of vegetation cover. During dry periods, subsurface flow ceased, saturated areas disappeared and the spatial patterns of soil moisture changed. Stream flow from these catchments was dominated by storm flow, and the runoff generating mechanisms showed a clear seasonal pattern, controlled mainly by the soil moisture and the extent of saturated areas. During the dry periods, runoff was produced only on impervious areas and badlands. At the end of the dry periods, some large rainfall events generated significant runoff because of the perched saturation of the shallow soil horizons. Thereafter, runoff generation was dominated by the role of saturated areas. Stream waters in catchments with badlands had very high suspended sediment concentrations. The seasonal pattern of erosion processes in badlands was characterised by physical weathering during winter, regolith breakdown and vigorous hillslope erosion during spring and summer, and efficient transport of sediments in autumn.
Keywords: Mediterranean region, seasonal controls, rainfall interception, runoff generation, soil moisture, sediment production.
Introduction
Sub-humid Mediterranean mountains share the hydrological processes from both wet and dry environments, following a seasonal pattern that induces remarkable particularities in hydrological behaviour (Gallart et al., 1997; Piñol et al., 1997). Because they are the source of water necessary for human life and activity in the drier downstream areas, a knowledge of the hydrological functioning of these areas may help to anticipate the hydrological consequences of both climate and land cover change, as well as to design land-use strategies that might counteract these changes.
This paper summarises twelve years’ monitoring of hydrological processes in a set of small research catchments located in a middle mountain area, paying especial attention
to the seasonal aspects. Although some modelling exercises have been undertaken (e.g. Llorens, 1997; Gallart et al. 2000; Anderton et al., 2002a, b), only results and interpretations from observations and measurements are presented, with the minimum assumptions possible.
Four main aspects of the hydrological processes are addressed: rainfall interception, soil water content, runoff generation and suspended sediment transport.
Forest rainfall interception in Mediterranean environments has received some attention in the literature, but information is very scattered. The character of the Mediterranean climate means that rainfall events occur under a large range of weather conditions that govern the interception process (Llorens et al, 1997). Is there a seasonal control on rainfall
interception in the Vallcebre catchments, as has been observed in other seasonal climates (e.g. Rowe, 1983)?
The study of three-year soil water content records in Vallcebre indicated the occurrence of a dry period in summer, with changes in the spatial arrangement of soil moisture, as the lowering of the water table interrupts the water supply to frequently saturated areas (Gallart et al., 1997; Gallart et
al., in press). This ‘switching’ behaviour has also been
described in other seasonal climates elsewhere (Grayson et
al., 2002), but not in drier Mediterranean environments
(Gómez-Plaza et al., 2001). The temporal patterns of soil water content are described to verify the occurrence of this behaviour over a longer period.
The large seasonal changes in soil water content induce a strong seasonality of runoff generation processes in Vallcebre (Latron et al., 1997, 2000; Gallart et al., in press). The deep seasonal changes in antecedent conditions represent a problem for precipitation-runoff models (Gan
et al., 1997; Piñol et al., 1997; Gallart et al., 2000; Anderton et al., 2002b). The flow record is compared below with the
record of the depth to the water table, to illustrate the seasonal changes in the runoff generation mechanisms.
Finally, sediment production in the Vallcebre catchments is dominated by the activity of small heavily eroded areas of dissected landscape (badlands) that supply large amounts of suspended sediments (Clotet et al., 1988). The dynamics of these badlands is highly seasonal, as it is driven mainly by physical weathering processes during winter (Regüés et
al., 1995). The transport of sediments is analysed below as
the consequence of the combination of geomorphic processes at the hillslope scale and hydrological processes at the small catchment scale.
Materials and methods
CHARACTERISTICS OF THE AREA STUDIED
The Vallcebre catchments are located in the headwaters of the Llobregat river, on the southern margin of the Pyrenees (Catalonia, Northeastern Spain) at latitude 42º 12´, longitude 1º 49´, and between 1100 and 1700 m a.s.l. The research area (Fig. 1) consists of two catchment clusters whose centres are 2.5 km apart. The main cluster is the Cal Rodó catchment (4.17 km2), which has been subdivided into three sub-catchments (Ca l’Isard, Can Vila and Sta. Magdalena), while the smaller cluster is called Cal Parisa and consists of a pair of catchments of similar size (0.15 and 0.17 km2).
The climate is sub-Mediterranean, with a characteristic water deficit period in summer. Mean annual temperature at 1440 m is 7.3ºC and the mean annual precipitation is 924 mm with 91 rainy days per year on average. Snowfalls
are occasional and represent less than 5% by volume. Annual reference evapotranspiration, estimated using the Penman-Monteith FAO method (Smith et al., 1992) is about 700 mm. In the Can Vila sub catchment, assumed watertight, runoff represented 56% of rainfall over a three-year period. Climax vegetation is woodland of Quercus pubescens with
Pinus sylvestris on the cooler north-facing aspects.
Nevertheless, most of the gentle hillslopes were deforested and terraced in the past for agricultural use and subsequently were abandoned during the second half of the 20th century. Former agricultural terraces are now covered by mesophile grasses with hydrophile patches. Following abandonment, spontaneous afforestation by Pinus sylvestris has occurred on 30% of the catchment.
The bedrock comprises red clayey smectite-rich mudstones with massive limestone beds of continental facies attributed to the Palaeocene. The soft mudstones are prone to landsliding and erosion by water, leading to the occurrence of intensely dissected landscapes with poor vegetation cover (badlands), that occupy only 2.8% of the catchments area but play a dominant role in sediment production (Clotet et al., 1988; Regüés et al., 2000b). Soil thickness varies greatly, depending on lithology, geomorphology and the changes induced by terracing. Badland areas exhibit regoliths whose thickness varies throughout the year, but which rarely reach 15 cm; limestone areas are overlain by discontinuous soils up to about 40 cm thick; soils on hillslopes over clayey rocks are up to 80 cm thick and agricultural terraces can have soils thicker than 3 m. Topsoils are loamy and show high infiltration capacities due to their good structure. Nevertheless, hydraulic conductivity drops in the deeper horizons, inducing shallow semi-permanent aquifers.
INSTRUMENT DESIGN
Instrumentation of the research catchments started in 1989 (Llorens and Gallart, 1992; Balasch et al., 1992). The present paper is based mainly on the instrumentation set up in 1994 (Gallart et al., 1997) (Fig. 1).
The pluviometric network consisted of 12 tipping-bucket rain gauges connected to data-loggers that recorded 0.2 mm precipitation increments at a temporal resolution of 1 second. These rain gauges, located 1 m above the ground surface, were calibrated for a large range of rainfall intensities by means of a dynamic calibration method based on Calder and Kidd (1978). Two standard automatic weather stations were installed in the respective catchment clusters.
All the stream gauging stations had control structures where water level and temperature measurements were logged at intervals between 2 and 60 minutes; self-cleaning
N
0 1 km HP1 IP WPF WPC11 1 HP2 HR1 HI ZI21 HV1 HM1 1.5 km 1º 49' E 42º 12' NAutomatic rainfall recorder Monitoring point Stream Catchment divide Forest Badlands 3 WPT Cal Parisa 1 Cal Parisa 2
Cal Parisa catchment
Cal Rodó catchment
Can Vila
Ca l'Isard
Sta Magdalena
Fig. 1. Map of the Vallcebre catchments, showing the location of the instruments.
concrete box weirs were installed at gauging stations HR1 and HI1 in order to avoid clogging by the abundant suspended and bedload sediment transported in these streams, V-notch steel weirs were installed at both HV1 and HM1 and steel H-flumes were used at both HP1 and HP2. Gauging stations HR1 HI1 and HV1 were equipped with infra-red backscattering turbidity sensors as well as automatic water sampling devices controlled by data-loggers. These first two stations were also provided with suspended sediment sensors based on ultrasonic beam attenuation, which are appropriate for the high range of sediment concentrations observed during storms (Gallart et
al., 1998). The calibration curves for the two types of
sediment sensors were obtained in the laboratory and subsequently tested and updated with the samples taken during the events.
Soil water content has been measured in the Vallcebre catchments since 1993 using the Time-Domain Reflectometry (TDR) method at nine profiles distributed in the main geo-ecological units (seven in the Cal Parisa
catchment and two in Can Vila sub-catchment). These profiles consisted of sets of four vertical 20 cm-long probes permanently installed in the ground at 0–20, 20–40, 40–60 and 60–80 cm depth. These were read every week with a Tektronix 1502-C cable tester.
A network of soil tensiometers was installed in late 1996. Depths to water table were measured weekly at four old wells and four continuously recording piezometers were instrumented in the catchments in late 1995, to study the dynamics of the water table during rain events.
An experimental forest plot in the Cal Parisa basin (IP1 in Fig. 1) has been monitored since 1993 to evaluate the water balance of a representative afforestation patch. This 198 m2 plot has a monospecific cover of Pinus sylvestris with no understorey. Stand density is about 2400 stems ha–1. The plot was instrumented for the continuous monitoring of rainfall interception (Llorens et al., 1997), tree transpiration (Oliveras and Llorens, 2001) and soil water potential, as well as for periodical measurement of soil moisture. Rainfall interception was obtained as the difference between rainfall
at a rain gauge in a clearing near the forest plot, and the sum of throughfall and stemflow in the forest; throughfall was measured by three clusters of three 1 m2 troughs connected to tipping bucket devices, and stem flow was measured in three clusters of trees provided with rings, which were also connected to tipping bucket devices. All measurements were recorded by the same data logger, which stored interception and sap flow data at five and fifteen minute intervals respectively.
Results and discussion
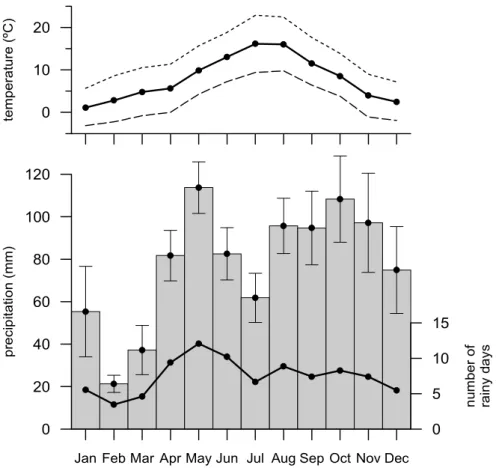
To provide an overall picture of the weather forcing for an easier subsequent discussion of the hydrological behaviour of the catchment, intra-annual evolution of monthly air temperature and precipitation as well as the number of rainy days per month are shown in Fig. 2. The temperature maximum was in July-August and the minimum in January. Mean daily temperatures in February and March were relatively gentle because of the frequent occurrence there of stable weather with high sunshine, while low temperatures occurred only in valley bottoms through inversions of
temperature. Rainfall was usually concentrated in late summer, autumn and spring, whereas winter was the season with least precipitation. May had both the highest precipitation and the most frequent rainy days, whilst October had higher daily precipitation amounts, because of large frontal rainfalls. During summer, short intense convective storms, with intensities up to 80 mm h–1 for 20 minutes, also provided significant precipitation input.
RAINFALL INTERCEPTION
The rainfall-interception relationship at the event scale was shown by Llorens et al. (1997) where:
(a) the relative interception of the Pinus sylvestris patch studied is about 24% of the bulk rainfall;
(b) relative interception represents about 15% for all the events greater than 20 mm;
(c) although the relationship between interception and precipitation shows a large scatter, it follows a curve with a positive but decreasing slope, without stabilisation of interception for the highest events.
Jan Feb Mar Apr May Jun Jul Aug Sep Oct Nov Dec
0 20 40 60 80 100 120 p re cip ita tio n ( m m ) 0 5 10 15 n u m ber of ra in y d a ys 0 10 20 te mperat ure (ºC)
Fig. 2. Top: monthly averages of daily mean (solid line), maximum (dotted line) and minimum (discontinuous
line) air temperatures measured at the Cal Parisa catchment. Bottom: monthly precipitation depths (bars with standard errors), and number of rainy days per month (dots connected by a solid line).
Moreover, the analysis of rainfall, interception and weather characteristics of the events by Llorens et al. (1997) lead to the identification of three main classes of events:
I: long events of low rainfall intensity occurring under wet atmospheric conditions, characteristics similar to those described in the literature from temperate-humid areas;
II: short events with high rainfall intensities in dry atmospheric conditions, producing low interception rates; and
III: events with low rainfall intensity in dry atmospheric conditions, producing the highest interception rates. Mean rainfall interception at the event scale (333 rainfall events of more than 1 mm and less than 100 mm bulk rainfall, selected after criteria described in Llorens et al., 1997) during the study period (July 1993–June 2000) was 2.7 mm for a mean bulk rainfall of 11.4 mm. The coefficient of variation of rainfall (123%) was twice that of interception (67%).
The relative interception rates were 28, 25, 21 and 27% of bulk seasonal rainfall in spring, summer, autumn and winter respectively. The total annual interception depth was partitioned into 37, 33, 23 and 7% among these four seasons (although the figure for winter might be somewhat higher if interception of snowfall was considered).
A further selection of 109 rainfall events of more than 10 mm of bulk rainfall has been used to analyse the seasonal variability of rainfall interception. Rainfall events of less
than 10 mm have been eliminated because their great variability could mask the possible seasonal trend. The events selected represent 51% of the total interception losses and 74.5% of the bulk rainfall.
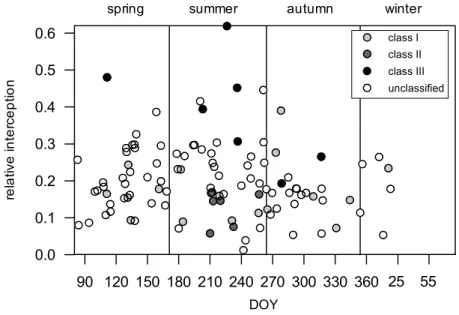
Figure 3 shows the temporal classification of the relative interception (I/P) as a function of the day of the year (DOY), performed with these 109 selected events. This temporal relationship has been established with relative interception instead of interception depth to allow a comparison between events of different magnitude.
The highest mean seasonal relative interception, that is the quotient between the total interception and the total rainfall measured during a season in different years, was obtained for summer and spring (18%); this quotient dropped to 15% for autumn and to 14% for winter.
Figure 3 also includes a representation of the three classes of events described by Llorens et al. (1997) and summarised above. Class I events occurred in all the seasons. Class III events occurred in the main rainy seasons (spring, summer and autumn) although this class of events was more frequent during summer. Finally, class II events occurred only during summer.
Summarising the results for the whole number of events (333), the seasonal distribution of interception depths is different from the distribution of relative interception rates, because of the different distribution of rainfall among seasons. The relative interception rates give an idea of the process and, as shown before, gave the following decreasing ranking of seasons: spring, winter, summer and autumn. In spring and winter there is an important quantity of small
90 120 150 180 210 240 270 300 330 360 390 420 DOY 0.0 0.1 0.2 0.3 0.4 0.5 0.6 re la tiv e in te rc e p tio n 25 55
spring summer autumn winter
class I class II class III unclassified
Fig. 3. Seasonal distribution of event relative rainfall interception measured at the IP1 instrumented forest plot. The classification of events is after Llorens et al. (1997), summarised in the text.
events, as 74 and 82% of the rainfall events are of less than 10 mm in these seasons, and small events have the highest relative interception rates. Although the mechanisms are contradictory (as winter has long events maintaining wet canopies for a long time and in spring events are shorter but the atmospheric demand is higher), there is a compensatory effect and interception rates are similar. Nevertheless, spring represents 37% of the total annual interception amount and winter only 7%. Relative interception in summer is lower than in spring, even if evaporative demand is higher in summer, due to the lower percentage of small events (57% of less than 10 mm) and the higher rainfall intensities. However, summer represents more than 30% of the annual interception losses. Finally, autumn is the season with the lowest interception rates; many more small rainfall events (60% of less than 10 mm) than in summer are counterbalanced by the occurrence of large events, as 80% of rainfall events greater than 60 mm occur in autumn, when atmospheric demand is lower.
SOIL WATER CONTENT
The Gallart et al. (1997) analysis of two-year long soil water content records showed that:
(a) Soils under forest cover are typically drier than under grass, due to rainfall interception;
(b) Underground water transfer, that feeds frequently saturated areas, is interrupted during dry periods.
Three soil moisture profiles have been selected to discuss the seasonal dynamics of soil moisture during the period July 1993–June 1999 (Fig. 4). WPF1 and WPC1 are adjacent profiles located in a mid-slope position, covered by pine trees and mesophile grass respectively. The WPT3 profile is located in a frequently saturated area downslope, covered by hydrophile grass.
The analysis of soil moisture dynamics has been performed as follows: mean soil water content for the 0–80 cm instrumented profiles was calculated for each measurement date (normally one measurement each week), subsequently fortnightly means were calculated with the data from all the years studied. This treatment gave a good estimate of the soil moisture and its variability, as each point in Fig. 4 represents the mean of at least 6 measurements.
At the frequently saturated profile (WPT3), there is a marked intra-annual variability, as soil water content ranged between 0.35 and 0.59 cm3cm–3. At the beginning of winter, the soil profile was always saturated and remained so until the end of spring, as a consequence of both low evaporative demand in winter and spring rainfalls (Fig. 2). In June, the soil water content decreased rapidly due to increasing evapotranspiration and the interruption of the subsurface water transfer. The lowest soil water content was reached at the end of July. Later, following the rainfall inputs of August and the successive months, soil water content tended to increase until the end of November. Hence, the period when the soil was not saturated lasted for three months. Inter-annual variability was much larger in the WPT3 profile
0.2 0.3 0.4 0.5 0.6 S o il w a te r c o n te n t ( cm 3cm -3) WPT3 WPC1 WPF1
Jan Feb Mar Apr May Jun Jul Aug Sep Oct Nov Dec
Fig. 4. Fortnightly averages and standard errors of volumetric soil water content measured in three 80-cm deep
profiles in the Cal Parisa catchment. WPF1 and WPC1 are adjacent profiles located in a mid-slope position, covered by pine trees and mesophile grass respectively. The WPT3 profile is located in a downslope frequently
during dry periods and during the wetting-up period following the summer drought than during the wet first part of the year; in terms of predictability, saturation during the first part of the year and its breakdown in late June are predictable, but the depth and duration of the dry period are much less predictable, as these depend on large rainfall events restoring the underground water transfer.
The other two profiles (WPF1 and WPC1) showed a less pronounced intra-annual variability, as soil water content ranged between 0.23 and 0.38 cm3cm–3. Soil water content decreased after the second fortnight of January, because of the low rainfall inputs during February and March (Fig. 2). In spite of 80 mm of mean rainfall in April, there was no increase of soil water content until early May. The summer drought included June and July with the lowest soil water content during the second fortnight of July. Finally, there was a progressive wetting-up of the soils from August to the end of the year. The inter-annual variability for these two profiles was small and regular throughout the year.
Differences in soil water content were important between WPT3 and the other sites, as the mean soil water content of the frequently saturated area was about 0.52 cm3cm–3, while the mid-slope profiles covered by grasses and trees were 0.31 and 0.27 cm3cm–3 respectively. Due to the high seasonal variability of soil water content at WPT3 differences were especially important during wet periods, from November to May-June, whereas during dry periods all the profiles showed more similar water contents. The effect of forest cover was apparent when comparing WPF1 and WPC1. The mean difference of 0.04 cm3cm–3 in soil water content between the forest and grass covered profiles was not constant through the year, being minimal during both driest and wettest conditions and maximal in the transition periods. The seasonal trend of the profiles described illustrates the pattern of catchment hydrodynamics. A pattern with saturated areas surrounded by wet soils in winter was followed by an early spring with drier soils, although some saturated areas were still present. After an increase in wetness during late spring, the summer drought dried out the saturated areas. Finally, autumn was characterised by the wetting of the whole catchment, this being more pronounced in the saturated areas and more irregular and delayed in the forest-covered profile.
RUNOFF GENERATION
Using information on rainfall, stream flow, soil tensiometry and depths to water table, three main kinds of runoff events have been identified in the Vallcebre catchments (Latron et
al., 2000; Gallart et al., in press):
(a) Summer runoff events, which tend to occur as a result of short-duration, high-intensity convective storms over dry soils and deep water tables. Runoff coefficients for this type of event are very low, as runoff is restricted largely to the poorly permeable rocky and badland areas of the catchment, resulting in a flashy hydrograph and low peak flow rates. Soil moisture responds to these events, but usually the water table does not.
(b) Wetting-up transition events, which usually occur in autumn and also in spring, as a result of prolonged, lower intensity frontal rainfall over dry catchments with a deep water table, which rises up days after the rainfall event. Runoff coefficients are intermediate and recession limbs are relatively short. Overland flow is produced over areas saturated ‘from above’ where temporary perched aquifers occur due to limited permeability of the deep soil profiles.
(c) Wet events, which occur in late autumn or early winter when large rainfall events occur on wet soils with a shallow water table, which responds to precipitation quickly. Runoff coefficients are high and recession limbs contribute significantly to the flow volume. Overland flow occurs on areas saturated ‘from below’.
To study the relative contribution of base flow to stream flow, during recession periods exponential regressions were obtained between depth to the water table (measured at ZI2) and the daily runoff at the two main outlets:
For Cal Rodó (HR1): Q = 2.99 e-0.020 z n= 455, r2=0.71, p<0.01 For Can Vila (HV1): Q = 7.94 e-0.022 z
n=448, r2=0.73, p<0.01
where Q is daily runoff (mm d–1), and z is the depth to the water table (cm).
Using these relationships, daily base flow discharges have been obtained from the depth to the water table measured at ZI2. These base flow estimates are subject to some uncertainty due to the scatter of the above relationships, but represent a minimum assumption approach. Thus the difference between the base flow estimates and the discharge measured at the outlet may be interpreted as storm flow. The validity of this approach is discussed below.
Following this procedure, storm flow represents 63% of total flow for the Cal Rodó catchment and 50% for the Can Vila sub-catchment (over a period of 26 months). This difference is consistent with the characteristics of the catchments, as the Can Vila sub-catchment has thicker soils and is a less impervious area than the Cal Rodó catchment
(Gallart et al., in press).
Figure 5 shows a sequence of both observed stream flow and estimated base flow during 1996 for the Can Vila sub-catchment. This graph illustrates the seasonal arrangement of the classification of runoff events summarised before: (a) During the dry period (early July–mid October), the low
water table yielded a base flow contribution almost nil. Summer showers produced very limited runoff and were unable to raise the water table.
(b) At the end of the dry period (October), a large rainfall event caused a moderate flow response with an intermediate runoff coefficient (by 10%), as well as a clearly delayed rise in the water table. The base flow estimated from the water table level during this event was limited during the flood peak but increased significantly a few days later, when it was higher than the measured stream flow.
(c) During wet periods (spring and late autumn), the water table was high and its variations were well correlated with rainfall events. Estimated base flow contribution was important, even during late winter, a period with little precipitation. The inconsistency between measured stream flow and estimated base flow in March 1996 may be attributed to the occurrence of snowfalls during this period.
Even if the flow separation method used here is inadequate at the event scale, as shown by some inconsistencies between measured stream flow and estimated base flow for some events, it allows a first estimation of the base flow contribution during the year. However, one of the major
problems faced with such an approach is linked to the representativeness of the water table measured at one single point. In the Cal Rodó catchment, the analysis of data from the piezometric network (Gallart et al., in press) has shown that the correlation between water table depths measured at different points throughout the catchment is relatively good during wet and dry periods, but worsens during transition periods.
SEDIMENT DYNAMICS
Previous studies in the Vallcebre basins showed that these are catchments with very high suspended sediment yield, closely related to badland development and dynamics. These studies identified seasonal patterns of regolith physical weathering and erosion (Regüés et al., 1995; Regüés and Gallart, 1996; Regüés et al., 2000b) as well as the relationships with sediment transport (Gallart et al., 1998; Regüés et al., 2000a). Badlands weathering, erosion and sediment transport sequence can be summarised in three stages:
(a) During middle autumn and winter, physical weathering processes are very active on clayey outcrops through freezing-thawing cycles, so that a thick regolith is formed, with a loose structure (popcorn) at its surface (Regüés et al., 1995);
(b) From spring to mid-summer, the combined effect of raindrop splash and later wetting-drying cause slope erosion and regolith crusting processes. There is active sediment transport at the slope scale and stream waters show the highest sediment concentrations (typically higher than 100 g l–1) but, because of the limited water flow in the streams, the sediments accumulate in the stream beds and in sedimentary fans at the feet of hillslopes (Regües et al. 2000a).
(c) During the rainiest period (late summer to mid-autumn) sediment transport is the main process, because regolith-crusting conditions are advantageous for surface sealing and the badland surfaces show the highest runoff coefficients (Regüés and Gallart, 1996).
Between 1995 and 1999, more than 300 flood events at the Cal Rodó (HR1) and Ca L’Isard (HI1) gauging stations were recorded and analysed (Regüés et al., 2000a). The amounts of suspended sediments transported during these events represent sediment yield rates of 710 mg km–2 yr–1 for the main Cal Rodó catchment, and 2,800 mg km–2 yr–1 for the Ca l’Isard sub-catchment, which contains the more active badlands. A comparison of the cumulated suspended sediment transport with the cumulated rainfall and the
Feb -199 6 Mar -199 6 Ap r-19 96 M a y-19 96 Jun-19 96 Ju l-19 96 Aug -19 96 S e p-19 9 6 Oct -199 6 No v-19 96 Dec -19 96 0 5 10 15 flow ( m m d a y ) 2 6 m m day 3 8 m m day 2 3 m m day -1 -1 -1 -1
Fig. 5. Daily runoff depths measured at the Can Vila (HV1) station (black line) and base flow contribution estimated for this catchment
number of single events shows that 90% of sediment transport occurred during 10% of events and was caused by 25–30% of precipitation. This result demonstrates the high non-linearity of the erosion and sediment transport processes, and is consistent with the results from other sediment transport studies, not only in Mediterranean areas (Walling and Webb, 1982; Woodward, 1995).
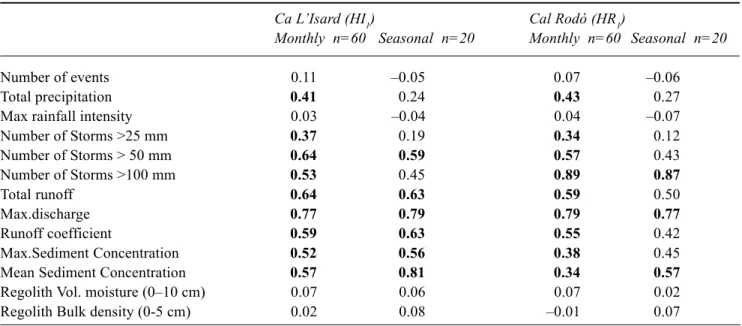
To analyse the temporal organisation of the sediment transport events, Table 1 shows the linear correlation coefficients between suspended sediment transport and precipitation, runoff and regolith status after aggregating the values at the monthly and seasonal scale. Both the total precipitation and the number of heavy storms were correlated significantly with the sediment transport at the monthly scale, but not at the seasonal scale; only the number of larger storms was well correlated with sediment transport at the seasonal scale, especially in the larger catchment (Cal Rodó). Rainfall intensity showed no correlation with sediment transport at any of the scales analysed; intense rainfall events cause severe erosion on badland surfaces but stream flow necessary for transport is controlled by antecedent conditions in the catchment and storm size instead of rainfall intensity. The flow characteristics of the events were correlated with sediment transport at both temporal scales at the Ca l’Isard station, whereas the correlations were poorer for the seasonal scale at the Cal Rodó station. Sediment concentrations were also well correlated with sediment transport at both scales and for
the two stations, although the correlation coefficients were smaller than those for water discharge. Finally, the moisture and bulk density of badland regoliths, which control the hydrological and erosive response at the slope scale, showed no correlation with sediment transport at any scale.
Figure 6 shows the seasonal relative contributions to precipitation, storm runoff and suspended sediment transport, aggregated after five years of monitoring. Sediment transport increased gradually from winter to
winter spring summer autumn
0 10 20 30 40 50 60 re lat iv e am ount s ( % ) 1 2 4 Storms > 50 mm Precipitation Storm runoff Sed. Transport
Fig. 6. Seasonal distribution of precipitation, storm runoff and
suspended sediment transport obtained for the Ca l’Isard (HI1) catchment.
Table 1. Linear correlation coefficients between suspended sediment transport and several variables describing the
characteristics of the events and the badland regolith condition, obtained after aggregating values at the month and season scale. Bold figures show that correlation is significant at the 0.01 confidence level, and underlined figures at the 0.05 level.
Ca L’Isard (HI1) Cal Rodó (HR1)
Monthly n=60 Seasonal n=20 Monthly n=60 Seasonal n=20
Number of events 0.11 –0.05 0.07 –0.06
Total precipitation 0.41 0.24 0.43 0.27
Max rainfall intensity 0.03 –0.04 0.04 –0.07
Number of Storms >25 mm 0.37 0.19 0.34 0.12 Number of Storms > 50 mm 0.64 0.59 0.57 0.43 Number of Storms >100 mm 0.53 0.45 0.89 0.87 Total runoff 0.64 0.63 0.59 0.50 Max.discharge 0.77 0.79 0.79 0.77 Runoff coefficient 0.59 0.63 0.55 0.42 Max.Sediment Concentration 0.52 0.56 0.38 0.45
Mean Sediment Concentration 0.57 0.81 0.34 0.57
Regolith Vol. moisture (0–10 cm) 0.07 0.06 0.07 0.02
summer, and showed a large increase in autumn, but this pattern was different from the precipitation and runoff patterns, showing a changing relationship among these three variables.
To interpret this behaviour, an integration of the information on runoff generation and sediment dynamics is needed. As shown in Fig. 5, winter stream flow was dominated by base flow (of poor erosion and transport capacity) coming from areas with thick soils outside the badlands, whereas small rainfall energy and the high permeability of the regolith on badland surfaces meant sediment production was scarce . During spring, an increase of precipitation and compaction of badland regoliths increased the erosion on badland slopes and the sediment concentration in stream waters, which had an increasing contribution of storm flow. During summer, the more intense erosion of badland slopes occurred, but the stream flow events were too small and flashy to allow much sediment transport, and the fine sediments were deposited on streambeds that became muddy. During autumn, the wetting of the whole catchments and the large rainfall events induced the main flow events, which eroded and transported the sediments deposited earlier.
Conclusions
Analyses of patterns of soil water content, stream flow and sediment yield from the Vallcebre catchments show a clear seasonal behaviour. Nevertheless, these clear seasonal patterns are driven not by the temporal pattern of precipitation, but by the strong seasonal changes in evaporative demand. Winter is the season with least precipitation, but with the wettest soils and the highest base flow contribution to stream flow.
The role of rainfall interception is relatively similar throughout the year, as the characteristics of the events and the atmospheric conditions counteract and provide similar relative interception rates for the different seasons.
The temporal pattern of soil water content indicates the chief role of a dry period in summer. This dry period begins in late June, after the large rainfall input in spring, and ends between September and October, when large rainfall events restore the soil water content and the underground water transfer along hillslopes.
The hydrological response of the catchment during the year shows a ‘switching’ behaviour between a dry and a wet season, driven by the temporal pattern of soil moisture. During these seasons, the runoff generating mechanisms are similar to those described in dry and humid environments respectively. Nevertheless, the response of the catchment during the wetting up transition period could not be
described by the same mechanisms, due to some irregularities of the hydrological behaviour produced in this period.
Finally, sediment transport is a complex phenomenon resulting from both geomorphic processes on badland surfaces, driven mainly by physical weathering, and runoff generation at the catchment scale, driven by rainfall inputs and the antecedent conditions.
Acknowledgements
This research was supported by the projects VAHMPIRE (ENV4-CT95-0134) funded by the European Commission and EPROHIDRO (HID98-1056-C02-01) funded by the Programa Nacional de Recursos Hídricos, Spanish Government. The Vallcebre catchments also operate with support from the RESEL network, through an agreement between CSIC and DGCONA.
The authors are indebted to O. Avila for his help with instruments and fieldwork, to D. Rabadà and M.C. Salvany for their help with soil moisture measurements and to M. Soler for her help with laboratory and deskwork. The comments of the anonymous referees are gratefully acknowledged.
References
Anderton, S., Latron, J. and Gallart, F., 2002a. Sensitivity analysis and multi-response, multi-criteria validation of a physically-based distributed model, Hydrol. Process., 16, 333–353. Anderton, S., Latron, J., White, S., Llorens, P., Salvany, C., Gallart,
F. and O’Connell, P.E., 2002b. Internal evaluation of a physically-based distributed model using data from a Mediterranean mountain catchment, Hydrol. Earth Syst. Sci.,
6, 67–83.
Balasch, J.C., Castelltort, X., Llorens, P. and Gallart, F., 1992. Hydrological and sediment dynamics network design in a Mediterranean mountainous area subject to gully erosion. In:
Erosion and transport monitoring programmes in river basins,
J. Bogen, D.E. Walling and T. Day (Eds.), IAHS Publication
no. 210, 433–442.
Calder, I.R. and Kidd, C.H.R., 1978. A note on the dynamic calibration of tipping-bucket gauges. J. Hydrol., 39, 383–386. Clotet, N., Gallart, F. and Balasch, J., 1988. Medium term erosion rates in a small scarcely vegetated catchment in the Pyrenees.
Catena, Sup. 13, 37–47.
Gallart, F., Latron, J., Llorens, P. and Rabadà, D., 1997. Hydrological functioning of Mediterranean mountain basins in Vallcebre, Catalonia: Some challenges for hydrological modelling. Hydrol. Process., 11, 1263–1272.
Gallart, F., Latron, J. and Regüés, D., 1998. Hydrological and erosion processes in the research catchments of Vallcebre (Pyrenees). In: Modelling erosion by water, J. Boardman and D. Favis-Mortlock (Eds.), ANSI/NATO series 1-55, Berlin (Springer).
Gallart, F., Latron, J., Llorens, P., Salvany, C., Anderton, S., Quinn, P., O’Connell, P.E., White, S., Ciarapica, L., Todini, E., Buchtele, J. and Herrmann, A., 2000. Intercomparison of hydrological models in a small research catchment in the Pyrenees. In: Proceedings of the ERB 2000 Conference, R. Hoeben, Y. Van Herpe and F.P. De Troch (Eds.), Ghent University, Belgium (CD).
Gallart, F., Latron, J., Llorens, P., Salvany. M.C., Josa, R., Anderton, S. and White, S., (in press). Analysis of the hydrological functioning of a Mediterranean mountain catchment through monitoring of internal dynamics. J. Hydrol. Gan, T.Y., Dlamini, E.M. and Biftu, G.F., 1997. Effects of model complexity and structure, data quality, and objective functions on hydrologic modelling. J. Hydrol., 192, 81–103.
Gómez-Plaza, A., Martínez-Mena, M., Albaladejo, J. and Castillo, V.M., 2001. Factors regulating spatial distribution of soil water content in small semiarid catchments. J. Hydrol. 253, 211–226. Grayson, R.B., Western, A.W., Chiew, F.H.S. and Blöschl, G., 1997. Preferred states in spatial soil moisture patterns: Local and nonlocal controls. Water Resour. Res., 33, 2897–2908. Latron, J., Llorens, P. and Gallart, F., 1997. Studying spatial and
temporal patterns of runoff generation processes in a mountain Mediterranean basin (Vallcebre, Catalonia). In: Ecohydrological
processes in small basins, D. Viville and I.G. Littlewood (Eds.),
IHP-V, Technical Documents in Hydrology 14, UNESCO, Paris. 93–98.
Latron, J., Gallart, F. and Salvany C., 2000. Analysing the role of phreatic level dynamics on the stream flow response in a Mediterranean mountainous experimental catchment (Vallcebre, Catalonia). In: Catchment Hydrological and Biochemical
Processes in the Changing Environment, V. Elias and I.G.
Littlewood (Eds.), IHP-V, Technical Documents in Hydrology 37, UNESCO, Paris, 107–111.
Llorens, P., 1997. Rainfall interception by a Pinus sylvestris forest patch overgrown in a Mediterranean mountainous abandoned area. II- Assessment of the applicability of the Gash analytical model. J. Hydrol., 199, 346–359.
Llorens, P. and Gallart, F., 1992. Small basin response in a Mediterranean mountainous abandoned farming area: research design and preliminary results. Catena, 19, 309–320. Llorens, P., Poch, R., Latron, J. and Gallart, F., 1997. Rainfall
interception by a Pinus sylvestris forest patch overgrown in a Mediterranean mountainous abandoned area. I- Monitoring design and results down to the event scale. J. Hydrol., 199, 331–345.
Oliveras, I. and Llorens, P., 2001. Medium-term sap flux monitoring in a Scots pine stand: analysis of the operability of the heat dissipation method for hydrological purposes. Tree
Physiol., 21, 473–480.
Piñol, J., Beven, K. and Freer, J., 1997. Modelling the hydrological response of Mediterranean catchments, Prades, Catalonia. The use of distributed models as aids to hypothesis formulation.
Hydrol. Process., 11, 1287–1306.
Regüés, D. and Gallart, F., 1996. Evolución de la respuesta hidrológica de un área arcillosa acarcavada, en relación con el estado físico superficial mediante experiencias de simulación de lluvia. Cadernos, 21, 79–89.
Regüés, D., Pardini, G. and Gallart, F., 1995. Regolith behaviour and physical weathering of clayey mudrock as dependent on seasonal weather conditions in a badland area at Vallcebre, Eastern Pyrenees. Catena, 25, 199–212.
Regüés, D., Balasch, J.C., Castelltort, X., Soler, M. and Gallart, F., 2000a. Relación entre las tendencias temporales de producción y transporte de sedimentos y las condiciones climáticas en una pequeña cuenca de montaña Mediterránea (Vallcebre, Pirineos orientales). Cuadernos de Investigación
Geográfica, 26, 41–65.
Regüés, D., Guàrdia, R. and Gallart, F., 2000b. Geomorphic agents versus vegetation spreading as causes of badland occurrence in a Mediterranean subhumid mountainous area. Catena, 40, 173– 187.
Rowe, L.K., 1983. Rainfall interception by an evergreen beech forest, Nelson, New Zealand. J. Hydrol., 66, 143–158. Smith, M., Allen, R.G., Monteith, J.L., Perrier, A., Pereira, L.,
Segeren, A. 1992. Report on the expert consultation of revision
of FAO methodologies for crop water requirements. Food and
Agriculture Organisation of the United Nations, Rome, 60 pp. Walling, D.E. and Webb, B.W., 1982. Sediment availability and the prediction of storm-period sediment yield. In: Recent
developments in the explanation and prediction of erosion and sediment yield, D.E. Walling (Ed.), IAHS Publication no. 137,
327–337.
Woodward, J.C., 1995. Patterns of Erosion and Suspended Sediment Yield in Mediterranean River Basins. In: Sediment
and Water Quality in River Catchments, I. Foster, A. Gurnell