ARTICLE
Fluid and source magma evolution of the Questa porphyry
Mo deposit, New Mexico, USA
Leonhard M. Klemm&Thomas Pettke&
Christoph A. Heinrich
Received: 5 July 2006 / Accepted: 3 March 2008 / Published online: 20 May 2008 # Springer-Verlag 2008
Abstract Combined fluid inclusion microthermometry and microanalysis by laser ablation inductively coupled plasma mass spectrometry (LA-ICPMS) are used to constrain the hydrothermal processes forming a typical Climax-type porphyry Mo deposit. Molybdenum mineralisation at Questa occurred in two superimposed hydrothermal stages, a magmatic-hydrothermal breccia and later stockwork veining. In both stages, texturally earliest fluids were single-phase, of low salinity (~7 wt.% NaClequiv.) and intermediate-density. Upon decompression to ~300 bar, they boiled off a vapour phase, leaving behind a residual brine (up to 45 wt.% NaClequiv) at temperatures of ~420°C. The highest average Mo concentrations in this hot brine
were ~500 μg/g, exceeding the Mo content of the
intermediate-density input fluid by about an order of magnitude and reflecting pre-concentration of Mo by fluid
phase separation prior to MoS2deposition from the brine.
Molybdenum concentrations in brine inclusions, then,
decrease down to 5 μg/g, recording Mo precipitation in
response to cooling of the saline liquid to ~360°C. Molybdenite precipitation from a dense, residual and probably sulphide-depleted brine is proposed to explain the tabular shape of the ore body and the absence of Cu-Fe sulphides in contrast to the more common Cu-Mo deposits related to porphyry stocks. Cesium and Rb concentrations in the single-phase fluids of the breccia
range from 2 to 8 and from 40 to 65μg/g, respectively. In
the stockwork veins, Cs and Rb concentrations are significantly higher (45–90 and 110–230 μg/g, respective-ly). Because Cs and Rb are incompatible and hydrother-mally non-reactive elements, the systematic increase in their concentration requires two distinct pulses of fluid exsolution from a progressively more fractionated magma. By contrast, major element and ore metal concentrations of these two fluid pulses remain essentially constant. Mass balance calculations using fluid chemical data from
LA-ICPMS suggest that at least 25 km3of melt and 7 Gt of
deep input fluid were necessary to provide the amount of Mo contained in the stockwork vein stage alone. While the absolute amounts of fluid and melt are uncertain, the well-constrained element ratios in the fluids together with empirical fluid/melt partition coefficients derived from the inclusion analyses suggest a high water content of the source melt of ~10%. In line with other circumstantial evidence, these results suggest that initial fluid exsolution may have occurred at a confining pressure exceeding 5 kbar. The source of the molybdenum-mineralising fluids probably was a particularly large magma chamber that crystallised and fractionated in the lower crust or at mid-crustal level, well below the shallow intrusions immedi-ately underlying Questa and other porphyry molybdenum deposits.
DOI 10.1007/s00126-008-0181-7
Editorial handling: B. Lehmann
Electronic supplementary material The online version of this article (doi:10.1007/s00126-008-0181-7) contains supplementary material, which is available to authorized users.
L. M. Klemm
:
T. Pettke:
C. A. Heinrich (*) Isotope Geochemistry and Mineral Resources, Department of Earth Sciences,Eidgenössische Technische Hochschule Zurich, Clausiusstrasse 25,
8092 Zurich, Switzerland e-mail: [email protected] T. Pettke
Institute of Geological Sciences, University of Bern, Baltzerstrasse 1 + 3,
Keywords Porphyry molybdenum . Fluid inclusion . Questa
Introduction
The global molybdenum supply is almost completely mined from porphyry-type ore deposits. Climax-type porphyry Mo deposits are the most important sources and reserves, after Mo obtained as a valuable by-product of porphyry-Cu-(-Mo-Au) deposits. Major Climax-type deposits contain amounts of Mo comparable to those of giant porphyry-Cu-Mo deposits such as Chuquicamata, El Teniente and Bingham but at much higher grades (e.g. Singer et al.
2005; Carten et al.1993). They represent an end member of
porphyry style mineralisation characterised by high abun-dances of Mo and F, but virtually no Cu and Au. The deposits are associated with shallow intrusions of
high-silica rhyolites and granites (Carten et al.1993) and occur
mainly along the North American Cordillera. Major deposits of this type are Climax, Colorado (Wallace et al.
1978), Urad-Henderson, Colorado (Carten et al.1988) and
Questa, New Mexico (Ishihara 1967), all three being
located in a single major province in the Southwestern
USA (Carten et al. 1993). Lead isotopes (Stein and
Hannah 1985) revealed a lower-crustal origin (partial
melting of biotite-bearing felsic granulite) of the magmas from which the Climax-type deposits in the Southwestern USA formed.
The chemical composition and the evolution of the magmatic-hydrothermal fluids are key to understanding the origin of metals and precipitation mechanisms in this type of deposit and also in Mo-depositing stages of ordinary Cu-Mo porphyries. The aim of this study is to investigate the compositional evolution of the ore-forming fluid in a Climax-type Mo system and to evaluate the composition of the magmatic source versus the influence of precipitation and wall rock reaction mechanisms on the metal budget of the deposit. The Questa deposit, presently mined by Molycorp Inc., provides an excellent example of a major Climax-type deposit. Its petrography and mineralogy are comparatively simple, and much of the sample material contains free-grown quartz crystals ideal for fluid inclusion studies. Standard microscopic and microthermometric procedures combined with laser abla-tion inductively coupled plasma mass spectrometry (LA-ICPMS) were used to determine the physico-chemical properties of the ore-forming fluids and to investigate ore-forming processes.
The geology and petrography of the Questa Mo deposit and its surroundings has been studied e.g. by Ishihara
(1967), Laughlin et al. (1969), Lipman et al. (1986),
Johnson and Lipman (1988), Johnson et al. (1989), Johnson
et al. (1990) and Czamanske et al. (1990). Most recently,
Ross et al. (2002) described the textural, petrographic and
mineralogical zonation of the magmatic-hydrothermal breccia (MHBX), which hosts the main ore bodies. Earlier fluid inclusion studies led to the recognition of essentially three different types of high-temperature fluid inclusions: liquid-rich, high-salinity inclusions (brine: type C and D of
Bloom1981and type III of Cline and Bodnar1994),
vapour-rich, low-salinity inclusions (vapour: type B of Bloom1981
and type II of Cline and Bodnar1994) and liquid-rich,
low-to-moderate-salinity inclusions (intermediate-density:
type A and E of Bloom, 1981 and type I of Cline and
Bodnar 1994). The brine was interpreted as having
exsolved directly from the magma, based on an apparent
lack of coeval vapour (Cline and Bodnar1994). A recent
fluid inclusion study by Rowe (2005) identified fluid
phase separation in the system and interpreted brine inclusions homogenising by halite dissolution to be an effect of accidental entrapment of halite. Magma mixing has been suggested to be an important factor for the
generation of metal-rich fluids at Questa (Jones2002), but
it remains unclear whether a selectively Mo-enriched precursor magma is ultimately required for Mo ore formation. Oxygen and hydrogen isotopes and gas analyses (Ar-He-N2) demonstrate that the ore-forming fluids at Questa are of magmatic origin with negligible meteoric component and that all facies of the breccia and the stockwork veins are chemically and isotopically
identical (Ross et al. 2002, Rowe et al. 2003). Analysis
of co-existing fluid and melt inclusions from miarolitic cavities of two barren intrusions within the Questa caldera
has provided fluid–melt partition coefficients for a number
of elements, linked to the degree of crystallisation of the magma at the time of local fluid exsolution (Audétat and
Pettke2003).
Geologic setting
The formation of the Questa porphyry Mo deposit is closely associated with the volcanic and tectonic activity during the Tertiary Rio Grande rifting at the Southeastern end of the
Rocky mountain chain (Fig. 1a). Volcanism and
magma-tism during that time also formed the large San Juan volcanic field, as well as other Climax-type porphyry Mo
deposits in the “Colorado mineral belt”, including the two
largest known in the world (Climax; Urad and Henderson).
The Questa porphyry Mo deposit is one of the world’s
largest Mo-only porphyries, although many porphyry-Cu-Mo deposits contain larger quantities of porphyry-Cu-Mo as a by-product. Questa is hosted in the Late Oligocene Questa
Caldera (Fig.1b), which is located within the Latir volcanic
field. Volcanic activity in the Latir field started around 28 Ma ago and comprised the formation of stratovolcanoes,
lava domes and flows and volcanoclastic rocks of predom-inantly andesitic composition (e.g., Bethke and Lipman
1989, Johnson et al. 1989). The Caldera formed at 25.7±
0.1 Ma with the ejection of >500 km3 of pyroclastic
rocks, today preserved as the Amalia tuff (Czamanske et al.
1990). Granitic to rhyolitic post-caldera intrusions (Cañada
Pinabete, Rito del Medio, Virgin Cañon, Cabresto Lake) formed in the north and centre of the caldera within 1 Ma after caldera formation. At the southern caldera margin, a number of intrusions (Sulfur Gulch, Red River and Bear Cañon) formed from 24.6±0.1 to 24.1±0.2 Ma. The last magmatic activity in the region took place to the south
USA
A
200 km DenverColorado
Rio Grande rift San Juan volcanic fieldNew Mexico
Santa FeUrad / Henderson
30-28 MaUrad / Henderson
30-28 MaMt. Emmons
18 MaMt. Emmons
18 MaLatir volcanic field
Questa
24 Ma
Questa
24 Ma
Climax
33-24 MaClimax
33-24 Ma Rocky Mountain range front Rio 3000 m 2500 m 2000 m Mineralised breccias 0.2 wt% MoS contour2 “Pit porphyry”Tertiary Andesites (incl. Dikes and sills) Tertiary Amalia Tuff
Southwest zone intrusive system
500m
SW Extension Goat Hill Deep D D Vein Old Vein
Ore bodies
Pit Profile
1
2
modified after Ross et al., 2002
C
B
Quaternary sedim. Tertiary intrusives Proterozoic rocks Tertiary volcanics Faults Caldera faultOre bodies Questa Mine
Barren intrusions studied by Audétat & Pettke, 2003 Grande Rift RH BC SG CL VC RM RR 3 km 105 ° 45’ 30’ New Mexico modified after Audétat & Pettke, 2003
Questa
Questa
105°37’30’’ CP
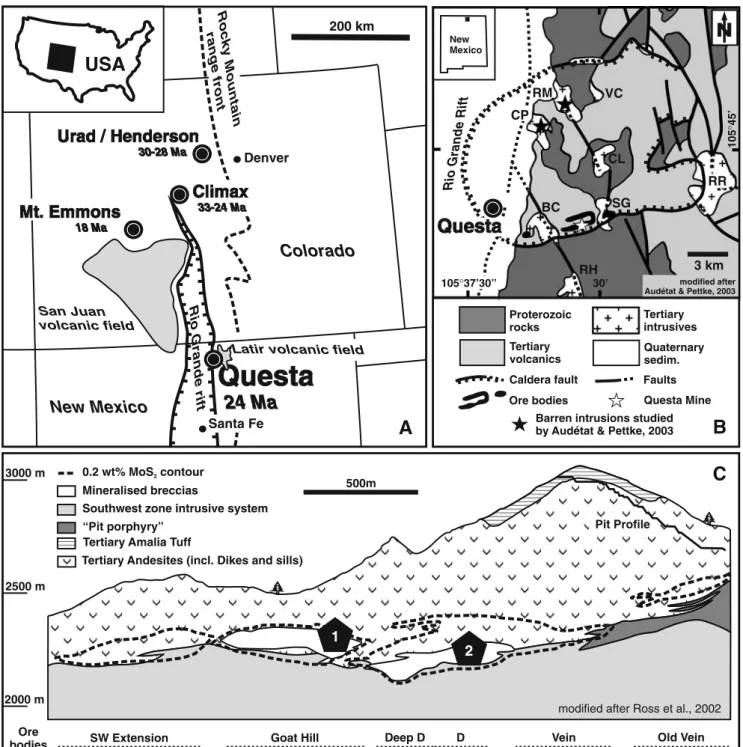
Fig. 1 a Regional tectonic map of Colorado and Northern New Mexico, location of a unique accumulation of Climax-type porphyry Mo deposits. b Geologic map of the Questa caldera after Lipman and Reed (1989). The Questa mine is located close to the southern caldera margin. Abbreviations used for post-caldera intrusions: BC—Bear Canyon, SG—Sulfur Gulch, CL—Cabresto Lake, CP—Cañada
Pinabete, RM—Rito del Medio, VC—Virgin Canyon, RR—Red River, RH—Rio Hondo. c Schematic W–E vertical section through the southern limb of the horse-shoe-shaped array of tabular ore bodies, after Ross et al. (2002). The samples used for this study originate from drill core at locality 1 and from underground workings at locality 2
outside the caldera margin, manifested by the Rio Hondo (22.8±0.2 Ma) and Luzero Peak (18.5±0.1 Ma) intrusions
(Czamanske et al. 1990). Notable is the north to south
“younging” of the intrusion ages. Molybdenum mineralisa-tion is restricted to the southern intrusive stocks (Sulfur Gulch, Goat Hill, Bear Cañon, Red River, Lucero Peak and Rio Hondo). The Questa porphyry Mo deposit is mainly hosted in MHBX bodies and consists of several distinct ore bodies situated around and to the west of the Sulfur Gulch
stock (Fig. 1c). The MHBX was dated to 24.2±0.3 and
24.1±0.2 Ma (Czamanske et al.1990). The breccia bodies
are hosted by fine-grained hornblende andesite with a
porphyritic texture (Ishihara 1967) at the hanging wall
intrusive contact of a pluton known as the southwest zone
intrusive system (Fig.1).
The current Mo mine is located in the“southwest zone”
of the horseshoe-shaped mineralised body. The“Goat Hill”
and “D” ore bodies (Fig. 1c) consist of a vertically zoned,
clast-supported MHBX. Ross et al (2002) differentiated a
vertical succession of seven breccia zones based on breccia matrix composition, clast petrography and alteration (zones
A to E; Fig.2). The lowest part of the MHBX consists of an
igneous breccia with aplite matrix; clasts are angular, pervasively biotite-altered andesite and occasionally grey rhyolite porphyry (zone A1). The igneous breccia matrix grades upward into zones with hydrothermal breccia matrix
MHBX zones B-E breccia matrix:
breccia clasts:
hydrothermal (qt+phl+mo+anh) with vugs (zone D) biotite-altered andesite MHBX zone A1 breccia matrix: breccia clasts: igneous (aplite) biotite-altered andesite ±rhyolite porphyry post mineral dike stockwork veins (qtz+fl+mo+anh) stockwork veins (qtz+beryl) MHBX zone A2-3 breccia clasts: breccia matrix: transitional (aplite+qt+ksp±mo) biotite-altered andesite ±rhyolite porphyry qtz qtz qtz mo mo phl phl phl 1cm qt+ksp matrix biotite-altered andesite clast rhyolite porphyryc last
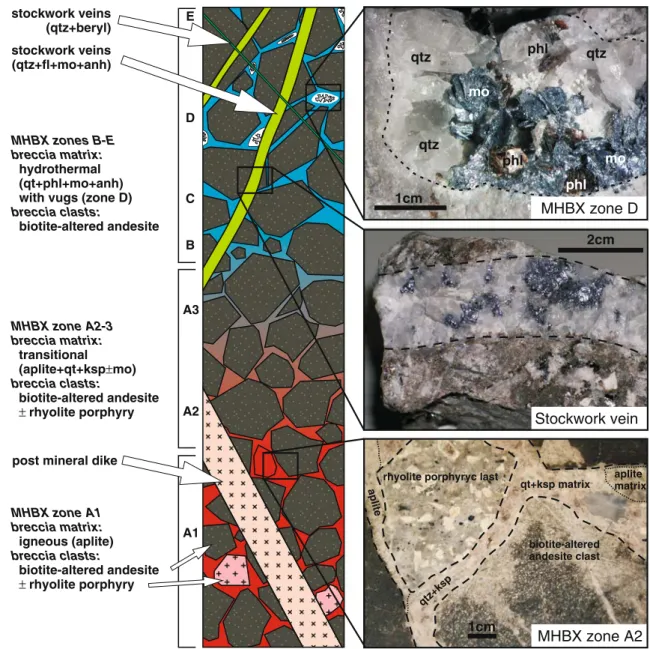
qtz+ksp aplite matrix a plite 1cm A1 A2 A3 B C E D 2cm MHBX zone D Stockwork vein MHBX zone A2 Fig. 2 Schematic vertical section through the Goat Hill and D ore
bodies showing the gradually change from pure igneous to pure hydrothermal breccia matrix in the MHBX. Ross et al. (2002) distinguished seven facies within the MHBX (zones A1, A2, A3, B, C, D, E) based on breccia matrix composition (mineralogy) and on
rock type, alteration and shape of the clasts. Later features, such as stockwork veins and dikes, cut the breccia. This reconstruction is based on observations made in samples taken from core (DDH-22– 14), from underground workings and from the D ore body stockpile combined with the facies classification by Ross et al. (2002)
(zones A2–A3). This transitional zone is characterised by segregations of quartz and orthoclase with minor amounts of molybdenite within an aplitic matrix. The upper part of the breccia contains a hydrothermal matrix consisting mainly of quartz, phlogopite and molybdenite (zones B, C, D and E). Abundant vugs in zone D contain crystals of quartz and phlogopite, overgrown by molybdenite, which is overgrown by anhydrite, apatite and calcite. Remaining open space was probably filled with anhydrite (now dissolved) at the time when later stockwork and post-ore beryl veins cut the vuggy breccia (see below), as indicated by veins cutting across open vugs. The generally biotite-altered andesite clasts are angular in the lower parts and more rounded in the upper parts of the MHBX. The potassic alteration is overprinted by quartz-sericite alter-ation in the uppermost parts of the MHBX (zone E). Kilometre-scale propylitic alteration surrounds the ore deposit and is characterised by replacement of mafic minerals including hornblende, orthopyroxene and biotite with chlorite and epidote. More details on the classifica-tion of the different MHBX facies can be found in Ross et
al. (2002).
Stockwork veins (quartz–fluorite–molybdenite–anhydrite) cut the MHBX. Molybdenite is intergrown with quartz; remaining open space was filled with fluorite and anhydrite.
The veins studied here originate from the“D” ore body; they
are up to 2 cm wide, straight-walled and have no visible
alteration halo (Fig.2).
Post-ore quartz-beryl ± base metal sulphide veins, usually about 1 cm wide, cut across both the MHBX and the stockwork veins. Accessory minerals in these veins are chalcopyrite, fluorite, scheelite and sulphides or sulpho-salts. The beryl crystals are up to 20 mm long and 1 mm in diameter. They are light-blue or emerald-green in colour.
Samples used for this study come from drill core (DDH-22–14°) through the Goat Hill ore body and from the D ore body stockpile. Additional samples from the stockpile are not well located but were selected to be petrographically
unambiguous examples of the zone “D” after Ross et al.
(2002) with a vuggy, hydrothermal breccia matrix.
Ross et al. (2002) estimated the contributions of the
MHBX and the stockwork veins to the overall ore grades of the mine to be about 30% to 40% and 60% to 70%, respec-tively. The late beryl vein stage is barren with respect to Mo.
Methods
Detailed petrography formed the basis for the selection of fluid inclusion assemblages (i.e. coevally trapped fluid inclusions in one geometrical feature). These were investi-gated with conventional microthermometry, scanning
elec-tron microscope-cathodoluminscence (SEM-CL) imaging and LA-ICPMS microanalysis.
Microthermometry Phase transitions in fluid inclusions were determined using a Linkam TS600 heating–freezing stage. Calibration of the system was performed on synthetic fluid inclusion standards (SynFlinc®), and temperature readings are considered to be accurate to within ±0.5 at –60°C, to within ±0.2 between 0°C and 100°C, and to within ±1°C above 100°C. Salinities (NaCl equivalent) were derived from final melting temperatures of
CO2-clathrate after Diamond (1992), from final melting of ice or
from final melting temperatures of halite after Bodnar and
Vityk (1994).
SEM-CL SEM-CL for imaging growth zones in quartz was performed using a CamScan CS44LB instrument at the Electron Microscopy Center of ETH Zürich. After carbon coating of the samples, backscattered electron and SEM-CL images of the same areas were acquired under identical analytical conditions (acceleration voltage of 15 kV,
beam-current density of 9–13 nA/mm) using an EDAX Phoenix
digital image acquisition system.
LA-ICPMS Selected inclusions were analysed individually with LA-ICPMS, using the instrumental setup described
in Günther et al. (1998) and Heinrich et al. (2003) and
analytical conditions similar to those reported in Pettke
et al. (2004). A 193 nm ArF Excimer laser (Lambda
Physik, Germany) combined with special beam energy homogenisation optics (Microlas, Germany) is linked with an Elan 6100 quadrupole ICPMS instrument (Perkin Elmer, Canada). For controlled ablation of the
quartz-hosted fluid inclusions, an energy density above 15 J/cm2
on the sample and a laser pulse frequency of 10 Hz was used. The optical imaging system permits rapid switching between different pit sizes (4–120 μm) at constant energy density on the sample by adjusting an aperture in the laser beam path. The ablation process was monitored both on the sample and as real-time signal on a monitor to ensure best possible control of the ablation process. For external standardisation, the National Institute of Standards and Technology reference material SRM-610 was used, yield-ing element concentration ratios for each inclusion. The concentration of Na in the fluid was, used as an internal standard to transform the element ratios into absolute concentrations. Na concentrations were derived from the microthermometric NaCl equivalent values, corrected for contributions of KCl, FeCl2, MnCl2, CuCl and PbCl2
(Heinrich et al. 2003). Limits of detection (LOD) were
calculated for each element in each inclusion, using the
three standard deviation criteria (Longerich et al. 1996),
inclusion points in most of the subsequent diagrams, but averages and one standard deviation uncertainties of inclusion assemblages are discussed in the text.
Results
Fluid inclusion petrography and microthermometry Fluid inclusions in quartz from the three stages of mineralisation, the MHBX, the stockwork veins and the
beryl veins, were studied using standard techniques for petrography (microscopy and SEM-CL imaging) and microthermometry. Petrographic fluid inclusion
assemb-lages were selected for further analysis (Figs.3and4). For
clarity, petrographic observations and fluid inclusion results are described together for each of the different stages.
(Tables 1,2and Fig.5).
Fluid inclusion quality strongly depends on the location of the sample within the MHBX and the stockwork veins. The igneous and the transitional parts of the MHBX host only very small inclusions that are poorly preserved. Larger
inclusions (>10 μm) commonly showed decrepitation
features, such as irregular, flat shape or halos of tiny inclusions around larger ones. Deformation seems to have destroyed the majority of the inclusions and only very small
(<10μm) inclusions may have survived. In deformed parts
the quartz has a lamellar appearance from tiny, stringed fluid inclusions. The best preserved fluid inclusions were
found in the vuggy zone “D” of the hydrothermal part of
the MHBX, where quartz crystals grew into open space and in the stockwork veins, where the quartz was protected by molybdenite from later deformation.
Fluid inclusions in the deep MHBX (igneous matrix) In the deeper, igneous part of the MHBX, only very small
(<15 μm), two-phase inclusions were found. These
inclu-sions have bubbles occupying between 40% and 60% of the inclusion volume and contain no daughter crystals. The two-phase inclusions from the deeper part of the MHBX show highly variable microthermometric behaviour (not
tabulated). Final ice melting temperatures range between –
0.5°C and–4.3°C, and final clathrate melting occurs from
about 6°C to 9.3°C. These measurements constrain the salinities to between 1 and 7.5 wt.% NaClequiv. The homogenisation temperature was not determined in light of the variable bubble sizes, even among apparently coeval inclusions.
Fluid inclusions in the upper MHBX (hydrothermal matrix) Cathodoluminescence (SEM-CL) images reveal three
gen-erations of quartz (Fig. 3). The oldest generation appears
light grey and unzoned (Q1MHBX). This generation often hosts clusters of intermediate-density inclusions (IDMHBX)
of possibly primary origin. This quartz Q1MHBX is
overgrown by idiomorphically growth-zoned Q2MHBX
quartz. This Q2MHBX quartz also fills secondary cracks in
Q1MHBXand contains inclusions of type BMHBX(brine) and
VMHBX(vapour). The youngest quartz generation (Q3MHBX)
occurs as thin SEM-CL black overgrowths, crack fillings
and spots mainly in Q1MHBX interpreted to represent
decrepitated fluid inclusions (Fig.3). Molybdenite inclusions
MHBX
Stockwork veins
1mm Q1STW Q1STW IDMHBX V1MHBX V2MHBX B1 +V1 MHBX MHBX IDSTW BSTW MoS2 Q1MHBX Q1MHBX MoS2 1mm 1mm Q1STW Q1STWA
D
B
C
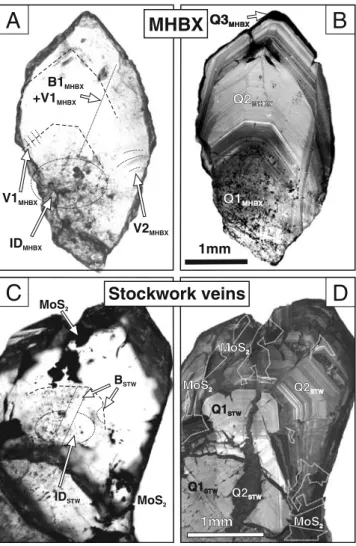
Q2MHBX Q2MHBX Q3MHBX Q3MHBX Q2STW Q2STW Q2STW Q2STW MoS2 MoS2 MoS2 MoS2 MoS2 MoS2Fig. 3 a Photomicrograph in transmitted light of a polished section of a free-grown quartz crystal from the hydrothermal matrix of the magmatic-hydrothermal breccia (MHBX). Note the distribution of fluid inclusions across the crystal. Growth zones are lined with phlogopite inclusions (highlighted with dashed lines). b Cathodoluminescence image of crystal shown in (a), revealing three different generations of quartz. Note the spotted pattern in the high fluid inclusion density area in Q1. c Photomicrograph in transmitted light of a polished section of a free-grown quartz crystal from the stockwork vein stage (STW). Dashed lines show growth structures and fluid inclusion type age relationships. d Cathodoluminescence image of the crystal shown in (c), revealing two different generations of quartz. Note the coexistence of molybdenite (dashed lines) with brine inclusions (BSTW) at the boundary between
observed in other quartz crystals of the same samples line
the contact between Q2MHBX and Q3MHBX. All fluid
inclusions studied in the MHBX samples were hosted by
Q1MHBXand Q2MHBX.
The intermediate-density fluid inclusions (IDMHBX;
Fig.4) commonly occur in Q1MHBXquartz. The IDMHBX
inclusions are typically negative crystal shaped, isometric
and between 10 and 20 μm in diameter. They have a
vapour bubble (volbubble~ 50%) and one opaque daughter
crystal. The presence of CO2is revealed in most cases as
clathrate at low temperatures, but liquid CO2is only rarely
observed. Microthermometric behaviour of inclusions within well-defined petrographic assemblages reveals
inconsistencies: some inclusions showed clathrate melting, others only melting of ice. Clathrate melting temperatures of +7.6 ± 0.9°C correspond to minimum salinities of 4.7 ±
1.7 wt.% NaClequiv(Diamond 1992). These are minimum
salinities because no liquid CO2 in the inclusion was
observed. Final ice melting temperatures of inclusions,
where no clathrate was observed, average at –4.6±0.6°C
and indicate a salinity of 7.3 ±0.8 wt.% NaClequiv. This
combined evidence, thus, suggests that the “true” salinity
of the IDMHBX fluid is likely to be around 7 wt.%
NaClequiv. Total homogenisation, occurring both to the liquid and to the vapour phase, is observed at 396 ± 37°C
(individual assemblage averages are reported in Table2).
ID
MHBXV1
MHBXV2
MHBXB
STWID
STW halite bubble opaque daughter crystal opaque daughter crystals CO2liq CO2vapB1
MHBX halite cpy bubble60 m
µ
B2
MHBX halite sylvite bubble40 m
µ
50 m
µ
10 m
µ
15 m
µ
30 m
µ
20 m
µ
Fig. 4 Photomicrographs of fluid inclusions of the different types and generations of fluids present in the magmatic-hydrothermal breccia (MHBX) and the later stockwork veins (STW) of the Questa porphyry Mo deposit as detailed in the textBrine inclusions (Fig.4) occur as clusters and
occasion-ally on pseudosecondary trails in Q1MHBXquartz but can be
assigned to Q2MHBX quartz based on SEM-CL images.
Petrographically, they can be subdivided into two groups.
At room temperature, B1MHBX brine inclusions have halite
and one or two opaque daughter crystals (chalcopyrite,
molybdenite); B2MHBX brines have halite, sylvite, a
transparent birefringent mineral, opaque daughter crystals and, occasionally, hematite. The latter inclusions are commonly irregularly shaped and flat, whereas B1MHBX inclusions usually have negative crystal shape. All brine
inclusions are generally smaller than 30 μm and have
vapour bubbles of 10–20 vol.%. The brine inclusions also
show inconsistent microthermometric behaviour within petrographic inclusion assemblages: homogenisation by vapour bubble disappearance (B1MHBX) as well as by halite dissolution (B2MHBX) is observed in single inclusion
trails (Table 2). For B1MHBX and B2MHBX brines the
temperatures of final melting of halite are 293±62°C and 390±38°C, respectively, indicating salinities of 38.2±4.6 and 46.6±3.6 wt.% NaClequiv.. The bubble point transitions
of B1MHBX are at 406±31°C, those of B2MHBX at 340±
36°C.
Vapour inclusions (Fig. 4) cluster in two groups,
V1MHBX and V2MHBX. V1MHBX inclusions have large
bubbles >90 vol.%, while the bubble size of V2MHBX inclusions is smaller (70 vol.%). No daughter crystals are visible. Vapour inclusions commonly have negative crystal
shape and range between 5 and 20 μm. In V2MHBX
inclusions, liquid CO2 can sometimes be observed.
V2MHBX-type inclusions are very similar to IDMHBX inclusions in terms of shape and phase proportions and could only be positively identified by their petrographic
occurrence within the crystal, i.e. on clear pseudosecondary trails or in boiling assemblages. Vapour inclusions could be measured only in a few cases reliably by microthermometry because of difficulties in observing phase boundaries. Approximate homogenisation temperatures of V2MHBX
inclusions co-existing with B2MHBX are 390°C; salinities
derived from final melting of ice at–2.3±0.1°C are 3.9±0.2
wt.% NaClequiv., but those may well be elevated due to co-entrapment of some brine.
Coexisting brine and vapour inclusions (B1MHBX +
V1MHBX and B2MHBX + V2MHBX) on secondary inclusion
trails were commonly observed, but unambiguous boiling
trail inclusions are typically too small (<5μm) for precise
microthermometry. Brine inclusions on boiling trails com-monly homogenise by halite dissolution except for one assemblage where total homogenisation happened at 424± 38°C by bubble disappearance.
Fluid inclusions in the stockwork veins
The stockwork veins cutting the MHBX have fluid inclusions preserved only where molybdenite protected the quartz crystals from deformation; in quartz without molybdenite fluid inclusions are flat and irregularly shaped. Similar to the quartz from the MHBX, growth zones visible with SEM-CL distinguish two generations of quartz
(Q1STW and Q2STW; Fig. 3). The older quartz Q1STW
appears light grey and sometimes slightly zoned in the centre and base of the crystals. It is overgrown by darker
grey and conspicuously zoned Q2STW quartz that is
associated with molybdenite crystallisation. This same
Q2STW quartz also occurs as crack fillings cutting Q1STW
growth zonation. Primary intermediate-density inclusions
Table 1 Stages of mineralisation in the Questa porphyry Mo deposit. Mineralogy, wall rock alteration and fluid inclusions as used for this study
Stages Mineralogy Alteration Fluid inclusions (FI)
Magmatic-hydrothermal breccia (MHBX)
Quartz, phlogopite, molybdenite, anhydrite, K-feldspar, rutile, aplite, (apatite and calcite = late?)
Potassic (biotite) IDMHBX Earliest FI’s; intermediate-density,
low-salinity
B1MHBX “Fresh” brine inclusions; halite +
opaque daughter crystals B2MHBX “Stressed” brine inclusions; halite +
sylvite + hematite + opaques VMHBX Vapour inclusions; similar to IDMHBX,
but on boiling trails
Stockwork veins (STW) Quartz, molybdenite, anhydrite, fluorite Argillic? IDSTW Earliest FI’s in STW;
intermediate-density, low-salinity BSTW brine inclusions; halite +
opaque daughter crystals
VSTW Vapour inclusions; similar to IDSTW,
but on boiling trails Beryl veins Quartz, beryl, fluorite, carbonates,
(scheelite, chalcopyrite, sulphosalts?
Not visible ABERYL Aqueous, low-salinity
(IDSTW; Fig. 4) are restricted to Q1STW. They show
negative crystal shaped up to 40 μm in length and have
vapour bubbles of about 50–60 vol.% and one opaque
daughter crystal. Final ice melting temperatures of –1.2±
0.1°C correspond to a salinity of 2.0±0.2 wt.% NaClequiv. Clathrate was observed in one inclusion only. The total homogenisation temperature of these inclusions is deter-mined at 388±4°C (one assemblage; N=5).
Brine (BSTW; Fig. 4) and very rare vapour inclusions
occur on pseudosecondary trails, which end on Q2STW
growth zones lined with primary brine inclusions and with solid molybdenite inclusions. The brines have a halite and usually a chalcopyrite daughter crystal. Negative-crystal
shaped brine inclusions are usually 10 to 20 μm in
diameter. The bubble occupies 10–20 vol.% at room temperature. Brine inclusions have final halite melting temperatures of 251±37°C, which indicates salinities of 34.3±1.3 wt.% NaClequiv.. Homogenisation temperatures are 328±52°C on average, generally occurring by vapour bubble disappearance. Unequivocal vapour inclusions have
Table 2 Microthermometric data of fluid inclusion assemblages from the different stages of mineralisation
Boiling TmCO2 SD (N) Tm clath SD (N) Tmice SD (N) ThH20 SD (N) Tm sylv SD (N) Tmhal SD (N) wt.% NaClequiv. SD (N) LA-ICPMS ID MHBX
22–14–709-A1 n.o. n.o. -4.8 – (3) 423 L – (3) 7.6 – (3) X
22–14–709-A2 7.0 – (3) 5.7 – (3) X 22–14–709-A5 -3.0 0.3 (4) 4.9 0.5 (4) X QD-2.2-A4 -57.4 – (4) 5.4 1.7 (5) 8.3 2.3 (5) X 22–14–709-A6 -57.3 0.1 (3) 6.4 2.6 (3) 6.6 4.2 (3) X 22–14–928-A1 -1.3 0.3 (2) 2.2 0.5 (2) X 22–14–928-A2 -2.0 1.2 (3) 3.4 1.8 (3) X 22–14–928-A3 7.3 0.8 (4) 5.6 1.6 (5) X QDS-4.9–010 4.6 1.1 (3) -5.1 – (1) 305 L – (1) 9.5 1.7 (3) X 22–14–709-A3+ -2.3 0 (2) 3.9 0 (2) X B1 MHBX 22–14–870–2b-A2 361 L 16 (7) n.o. 280 49 (7) 37 3 (7) X QD-2.2-A1 396 L 10 (2) n.o. 374 13 (2) 45 1 (2) X QD-2.2-A3 396 L 10 (2) n.o. 374 13 (2) 45 1 (2) X 22–14–709-A3 427 L 17 (11) n.o. 340 24 (11) 42 2 (11) X QDS-4.9–002-A1 408 L 17 (7) n.o. 220 43 (7) 33 3 (7) X QDS-4.9–002-A2 391 L 10 (5) n.o. 305 50 (5) 39 4 (5) X 2–14–709-A7 429 L 30 (2) 115 – (1) 388 15 (2) 46 2 (2) 22–14–709-A8 X 424 L 38 (8) n.o. 248 44 (8) 35 3 (8) 22–14–729c-A1 396 L 9 (3) n.o. 298 53 (3) 38 4 (3) B2 MHBX 22–14–740a-A3 360 L 17 (7) n.m. 419 8 (7) 50 1 (7) 22–14–740a-A2 343 L 11 (5) 211 – (1) 414 9 (5) 49 1 (5) 22–14–870–2b-A2 355 L 35 (3) n.m. 384 5 (3) 46 1 (3) QD-2.2-A3 356 L 18 (3) n.m. 403 7 (3) 47 1 (3) 22–14–709-A3 393 L 2 (3) n.m. 408 6 (3) 48 1 (3) QDS-4.9–007 319 L 15 (9) n.m. 378 28 (9) 45 3 (9) X QDS-4.9–010-A2 271 L 46 (3) n.m. 298 38 (3) 38 3 (3) V MHBX
QD-2.2-A5 n.o. n.o. -2.3 0.1 (2) 387 V 2 (2) 3.9 0.2 (2) X
ID STW QDS-3-A3 -6.8 9.7 7.5 (2) X QDS-3.4-A2 -3.3 5.4 0.1 (4) X QDS-3-A1 -3.0 4.9 2.6 (7) X QDS-3-Ax 3.4 – (1) -6.7 6.4 (3) 391 L 6 (2) 9.8 6.4 (4) X QDS-4.9–007 n.o. n.o. -3.9 0.1 (2) 401 L 2 (2) 2.0 0.2 (4) X B STW QDS-3-A3 321 L 55 (11) 238 17 (11) 34 1 (11) X QDS-3.5 X 354 L 36 (3) 298 58 (3) 36 2 (3) X V STW QDS-3.5 X n.o. n.o. -1.6 0.5 (13) 392 V 8 (13) 2.8 0.9 (13) X A BERYL QDS-1–003 n.o. n.o. -2.5 0.2 (8) 376 L 12 (8) 4.1 0.3 (8)
Values are assemblage averages in degrees Celsius, with 1 standard deviation (SD) and the number of significant values in brackets set italic SD standard deviation, boiling brine and vapour inclusions co-existing in single assemblage (X), Tm2final melting temperature of CO2, Tmclath
final melting temperature of CO2–H2O clathrate, Tmice final melting temperature of ice, Th2O homogenisation temperature of the H2O phases, Tm
sylv final dissolution temperature of sylvite daughter crystal, Tmhal final dissolution temperature of halite daughter crystal, wt.% NaClequivsalinity
(weight % NaCl equivalent), n.o. not observed, n.m. not measured, L bubble point transition, V dew-point transition, LA-ICPMS laser ablation ICPMS analysis available (X)
only been found in one boiling assemblage and revealed total homogenisation by bubble expansion at 392±8°C (N= 13). They have salinities of 2.8±0.9 wt.% on average (final melting of ice at -1.6±0.5°C).
Fluid inclusions in the quartz-beryl veins
In these post-ore veins only beryl preserves primary aqueous inclusions of usable size (10–30 μm) on growth zones. Inclusions have vapour bubbles of 10 to 20 vol.% and contain no daughter minerals. Final melting of ice at –2.5±0.2°C indicates a salinity of 4.1±0.5 wt.% NaClequiv.. Total homogenisation to the liquid phase occurs at 376± 12°C.
LA-ICPMS analysis of fluid inclusions
Fluid inclusions from the MHBX and the stockwork vein stage were analysed by LA-ICPMS. Average element
concentrations of assemblages are summarised in Table3,
and the complete data set for each individual inclusion is
reported in the“Electronic supplementary material”.
Gen-erally, Na, K, Mn and Fe are the major elements in the fluid inclusions of all types and locations. Notable is a relatively high Cu concentration in most of the fluids, contrasting with the very minor amount of Cu-bearing minerals in the deposit. The reproducibility of element ratios within fluid inclusion assemblages is good for most elements (~20% at one standard deviation); however, larger variations are observed for some ore metals.
MHBX upper part (vuggy, hydrothermal matrix)
In IDMHBX fluid inclusion assemblages, Na, K and Fe are
the major cations. The average Mo concentrations are
between 16 and 90 μg/g; the Cu concentrations vary
between 200 and 5,000 μg/g. The brine inclusions
(B1MHBX) contain Na, K, Mn and Fe with concentrations higher than 1 wt.%. Molybdenum is highly variable from
1100 μg/g to values below the LOD of ~5 μg/g in
individual inclusions; average concentrations for individual
assemblages lie between 85 and 470 μg/g. Copper ranges
between 870 and 7700μg/g. Only a few vapour inclusions
could be analysed. They are enriched in B, Cu and As relative to the brines. Molybdenum is present in
concen-trations of around 65μg/g.
Analyses of fluid inclusions from the deeper parts of the MHBX (igneous matrix) gave relatively high LOD because
of their small size (<10 μm). Therefore, partial data were
obtained for most elements only (reported only in the “Electronic supplementary material”), but these overlap
entirely with intermediate-density fluids from the upper MHBX.
Stockwork veins
Remarkable is the approximately ten times higher Cs concentration of all fluid inclusions of the stockwork veins relative to the fluid inclusions from the earlier MHBX, while all other element abundances overlap between MHBX and STW samples. The intermediate-density fluid inclusions from the stockwork veins (IDSTW) contain mainly Na, K,
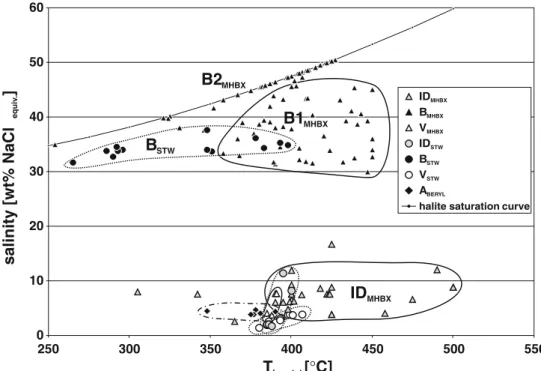
0 10 20 30 40 50 60 250 350 450 550 Thom tot[°C] salinity [wt% NaCl ] equiv . 300 400 500 IDMHBX BMHBX VMHBX IDSTW BSTW VSTW ABERYL
halite saturation curve
B2
MHBXB1
MHBXB
STWID
MHBXFig. 5 Summary plot of the microthermometric measure-ments of all fluid inclusion types. Individual inclusion types are grouped for the two miner-alisation stages, the magmatic-hydrothermal breccia (MHBX) and the later stockwork veins (STW). A few“outliers” have been omitted from this plot
Mn and Fe. The average Mo concentrations are between 6
and 60μg/g. The brines (BSTW) contain Na, K, Mn and Fe
at concentrations higher than 1 wt.%. Molybdenum is
present at concentrations between 11 and 180 μg/g. Cu
ranges between 740 and 2,700 μg/g. Vapour inclusions
(VSTW) are relatively enriched in Cu. Elements such as B, As, Mo and Sn were below LOD.
Fluid inclusions in the beryl-bearing quartz veins
Fluid inclusions in quartz are poorly preserved and were not analysed. LA-ICPMS analysis of the fluid inclusions hosted in blue and green beryl did not give significant inclusion signals for these dilute fluids because of the high host mineral contents of the major fluid inclusion elements. The blue beryl itself contains about 1 wt.% Fe, which is most probably responsible for its blue colour. The green
beryl contains up to 1,000μg/g of Cr probably acting as the
colouring element. The LA-ICPMS data of the analyses of
the beryl is reported in the “Electronic supplementary
material”.
Discussion and interpretation
Before interpreting the data obtained in this fluid inclusion study, it is necessary to evaluate the extent and effect of post-entrapment modification of fluid inclusion contents. This is followed by a chronological discussion of the genesis of the deposit, going back in time from molybdenite precipitation through the preceding process of fluid phase separation to the exsolution of the ore-forming fluids from a fractionating source magma.
Post-entrapment modification of fluid inclusions
A number of observations on petrographic fluid inclusion assemblages sensu stricto suggest that at least some fluid inclusion contents were modified after entrapment. Evi-dence for this includes the irregular, flat shape of some
inclusions (Fig. 4), the highly variable salinities and the
wide range of homogenisation temperatures derived from microthermometry of coevally entrapped inclusions
(Table 2), the presence of brine inclusions homogenising
by halite dissolution on boiling trails and the spotty areas of
host quartz visible in SEM-CL images (Fig.3).
Post-entrapment modification of fluid inclusions may result either in changes in bulk fluid inclusion density without loss of content (stretching or shrinkage; Roedder
1984) or a gain or loss of material which may change both
fluid inclusion composition and bulk density (e.g. Audétat
and Günther1999). The homogenisation of B2MHBXbrines
from unambiguous boiling assemblages by final dissolution
of halite, several tens of degrees Celsius above the temperature of bubble disappearance, indicates that such inclusions in the MHBX suffered from either volume shrinkage at constant salinity or selective water loss at constant inclusion volume, or both. This is because the liquid limb of the solvus reaches halite saturation only at the univariant H + L + V curve, where halite and vapour
should disappear together upon heating (Fig. 6; Driesner
and Heinrich 2007). Cline and Bodnar (1994) had not
observed any boiling trails at Questa and, therefore, argued that the brine inclusions homogenising through halite dissolution represent entrapment of a high-salinity single-phase fluid well above the two-single-phase surface, after it had exsolved directly from a silicate melt. This interpretation is based on the assumption that the brine inclusions retained their original composition as well as their bulk density. Here, we conclude that most of the inclusions
homogenis-ing by halite dissolution (Fig.5), and possibly others, were
modified in their composition and density after entrapment.
Brine inclusions plotted in Fig.5indicate a weak trend from
higher to lower homogenisation temperatures and from lower to higher salinities. This trend is consistent with an increase in density and bulk salinity due to post-entrapment
loss of water (Audétat and Günther 1999). Accidental
entrapment of halite may have a similar effect (elevated salinities and lowered Th,tot) and was suggested by Rowe
(2005) to explain total homogenisation of brine inclusions
by halite dissolution. However, a large scatter in Na/K ratios would be expected among all brine inclusions (i.e. excess Na in those which have trapped halite), but this is not evident (Na/KMHBX brines=1.77±0.67; Na/KSTW brines=
1.89±0.54; cf.“Electronic supplementary material”).
Distinguishing well-preserved from modified inclusions has proven difficult because the extent of modification is variable and not a simple function of inclusion size and
shape. Audétat and Günther (1999) demonstrated that
post-entrapment modification of magmatic-hydrothermal fluid inclusions mostly led to loss of H2O, changing micro-thermometric properties (salinity, homogenisation behav-iour). The metal ratios, however, remain largely unaffected except for Li. This was also found in the present study, and we, therefore, base our interpretations primarily on ana-lysed element ratios, rather than salinity-dependent element concentrations. For the same reason, estimates of
entrap-ment temperature are based on the lowest Th,tot bubble
point transitions of brine inclusions, because the total homogenisation by dew-point transition of vapour inclu-sions is impossible to observe reliably (Sterner and Bodnar
1989).
Intermediate-density and vapour inclusions are expected to have experienced less post-entrapment modifications due to their flatter isochores in PTX space, yet microthermo-metry reveals that even these inclusions may have been
T able 3 LA-ICPMS concentration data (in μ g/g) for fluid inclusion assemblages of the two stages of mineralisation, the magmatic-hydrothermal breccia (MHBX) and the stockwork veins (STW) Li SD (N ) B SD (N )N a S D (N ) K SD (N )M n S D (N )F e S D (N )C u S D (N )Z n S D (N )A s S D (N )R b S D (N ) ID MHB X 22 –14 –709-A1 <430 <2000 23500 900 (3 ) 8000 600 (3 ) 2800 200 (3 ) 4400 1200 (3 ) 1200 – (1 ) 840 120 (3 ) <400 65 10 (3 ) 22 –14 –709-A2 <140 <600 16400 2100 (3 ) 6900 1 100 (3 ) 1500 600 (3 ) 6000 1200 (2 ) 1700 400 (3 ) 670 270 (3 ) <90 60 25 (3 ) 22 –14 –709-A5 * <25 420 410 (2 ) 14600 900 (4 ) 5000 800 (4 ) 900 300 (3 ) 2300 2100 (2 ) 4900 2400 (4 ) 380 90 (4 ) 120 80 (2 )4 95 (4 ) QD-2.2-A4 15 -(1 ) <800 24000 8800 (5 ) 1 1800 3600 (5 ) 2300 1300 (5 ) 5400 2500 (4 ) 2000 800 (5 ) 570 240 (4 ) <180 100 30 (5 ) 22 –14 –709-A6 * 7 5 1 5 (2 ) <160 18700 13200 (3 ) 8400 5100 (3 ) 1300 400 (3 ) 4600 1800 (3 ) 3100 900 (3 ) 510 210 (3 )2 5 1 0 (2 )6 0 2 5 (3 ) 22 –14 –928-A1 95 90 (2 ) <300 7400 1000 (2 ) 2900 1 100 (2 ) 270 210 (2 ) 1400 -(1 ) 200 -(1 ) <100 90 60 (2 )2 6 1 0 (2 ) 22 –14 –928-A2 50 -(1 ) 610 500 (2 ) 1 1300 6000 (3 ) 3500 2600 (3 ) 270 180 (2 ) 1800 1 100 (2 ) 380 210 (2 ) 210 200 (2 )4 9 -(1 )4 4 1 0 (3 ) 22 –14 –928-A3 100 -(1 ) <570 18000 4700 (5 ) 6400 2100 (5 ) 1400 800 (4 ) 4100 2900 (3 ) 1000 800 (4 ) 450 160 (4 ) 210 -(1 )6 0 3 5 (5 ) QDS-4.9 –002-A2 49 20 (2 ) <420 25200 1700 (9 ) 10200 1500 (9 ) 2500 800 (9 ) 7200 2500 (9 ) 2600 1300 (9 ) 740 130 (9 ) <400 95 15 (9 ) 22 –14 –709-A3+ 70 50 (2 ) <560 1 1400 500 (5 ) 4200 900 (5 ) 620 400 (5 ) 3700 500 (5 ) 3000 1300 (5 ) 250 140 (5 ) <500 42 30 (4 ) BMHBX 22 –14 –870 –2b-A2 150 90 (2 ) <250 1 12600 31700 (2 ) 54000 5300 (2 ) 10600 600 (2 ) 29200 9700 (2 ) 2300 1600 (2 ) 2500 300 (2 ) <60 620 130 (2 ) QD-2.2-A1 1 1 0 6 0 (8 ) 310 290 (4 ) 109200 18500 (14 ) 72700 1 1 100 (14 ) 17200 5200 (14 ) 44700 7400 (14 ) 6100 6000 (14 ) 3800 1800 (14 ) <120 600 210 (14 ) QD-2.2-A3 80 2 (2 ) 650 -(1 ) 130700 10500 (6) 78800 6900 (5 ) 17300 3300 (6) 55200 5900 (6) 1700 2600 (6) 4500 1500 (6) 26 -(1 ) 620 120 (6) 22 –14 –709-A3 90 20 (9 ) <300 1 15800 8600 (10 ) 69700 7900 (10 ) 13800 1600 (10 ) 38700 6800 (10 ) 5700 5400 (10 ) 4000 600 (10 )3 7 2 0 (2 ) 520 60 (10 ) QDS-4.9 –002-A1 220 75 (4 ) <390 91200 8500 (4 ) 38000 14800 (4 ) 9100 2800 (4 ) 32100 6100 (4 ) 7700 7000 (4 ) 2400 900 (4 ) <500 290 1 1 0 (4 ) QDS-4.9 –002-A2 160 10 (2 ) <340 104100 2700 (3 ) 53200 5700 (3 ) 12000 2100 (3 ) 35500 6300 (3 ) 5100 1400 (3 ) 4000 300 (3 ) <400 420 20 (3 ) QDS-4.9 –007 130 -(1 )5 0 -(1 ) 133600 13300 (2 ) 54500 7800 (2 ) 13400 40 (2 ) 42700 700 (2 ) 870 930 (2 ) 4000 5 (2 ) <200 550 170 (2 ) VMHBX QD-2.2-A5 * <140 700 -(1 ) 9800 900 (3 ) 3000 700 (3 ) 250 -(1 ) 6100 -(1 ) 6600 900 (3 ) 240 3 (2 ) 1 100 -(1 )3 7 5 (2 ) ID STW QDS-3-A3 * 320 -(1 ) 230 5 (2 ) 41500 43000 (2 ) 16400 17800 (2 ) 6100 6800 (2 ) 8300 5600 (2 ) 5900 1 100 (2 ) 1900 2100 (2 )5 0 4 0 (2 ) 270 300 (2 ) QDS-3.4-A2 * 370 -(1 ) 410 -(1 ) 20200 1000 (4 ) 5500 700 (2 ) 3800 1400 (2 ) 630 210 (2 ) 1300 700 (4 ) 190 30 (3 ) 100 30 (3 ) 120 15 (2 ) QDS-3-A1 340 200 (3 ) <1300 16500 8500 (7 ) 5100 3900 (5 ) 1700 2400 (4 ) 8200 2800 (2 ) 270 -(1 ) 1500 1400 (4 ) 400 240 (4 ) 105 55 (6) QDS-3-Ax <33 760 -(1 ) 30100 20300 (4 ) 13500 7100 (4 ) 3700 4700 (4 ) 2200 1000 (3 ) 2500 3300 (3 ) 1700 2500 (4 ) <300 230 180 (4 ) QDS-4.9 –007 <36 950 45 (2 ) 21200 400 (2 ) 8900 40 (2 ) 1400 70 (2 ) < 1 100 1900 300 (2 ) 340 20 (2 ) <350 130 1 (2 ) BSTW QDS-3-A3 * 140 65 (5 ) 350 60 (4 ) 93700 7200 (5 ) 62900 15000 (5 ) 14900 2600 (5 ) 19100 5200 (5 ) 740 740 (5 ) 7100 1500 (5 ) 160 40 (5 ) 1200 440 (5 ) QDS-3.5 <9 65 -(1 ) 94800 8500 (3 ) 50900 1 1200 (3 ) 21500 4300 (3 ) 52700 1 1000 (3 ) 2700 2200 (3 ) 4700 1200 (3 ) <80 610 120 (3 ) VSTW QDS-3.5 160 1 1 0 (2 ) <400 8700 2000 (4 ) 4100 1000 (4 ) 1300 400 (4 ) 5600 1700 (2 ) 1400 500 (4 ) 480 230 (4 ) <300 46 15 (4 ) Sr SD (N )M o S D (N )A g S D (N )S n S D (N )C s S D (N )B a S D (N ) W SD (N )T l S D (N )P b S D (N )B i S D (N )
T able 3 (continued) Sr SD (N )M o S D (N )A g S D (N )S n S D (N )C s S D (N )B a S D (N ) W SD (N )T l S D (N )P b S D (N )B i S D (N ) ID MHBX 22 –14 –709-A1 1 1 -(1 ) <170 <55 <240 <23 38 -(1 )< 1 1 0 6 -(1 ) 330 30 (3 ) <25 22 –14 –709-A2 20 10 (3 )9 0 2 5 (3 ) <23 <80 7 -(1 )5 5 -(1 ) <45 15 -(1 ) 240 65 (3 )1 8 -(1 ) 22 –14 –709-A5 * 3 1 (2 )1 6 1 0 (2 ) <12 25 -(1 ) 3 0.1 (2 ) <15 32 -(1 ) 4 0.1 (2 ) 150 40 (3 )6 2 (2 ) QD-2.2-A4 27 30 (5 )6 0 2 0 (3 )1 5 3 (2 ) <130 5 2 (3 ) <60 30 10 (2 )6 2 (3 ) 260 40 (5 ) <15 22 –14 –709-A6 * < 3 1 7 -(1 )1 9 1 5 (3 )4 0 3 0 (2 ) 5 0.2 (2 )8 -(1 )1 9 3 (2 )4 2 (3 ) 230 150 (3 )3 -(1 ) 22 –14 –928-A1 <5 16 -(1 ) <10 55 40 (2 )< 4 1 5 -(1 ) <23 3 -(1 )1 6 -(1 )3 -(1 ) 22 –14 –928-A2 <6 47 -(1 ) <17 <55 8 3 (2 )5 5 -(1 ) <25 <4 50 -(1 )5 -(1 ) 22 –14 –928-A3 19 6 (2 ) <33 <34 60 -(1 )1 4 7 (4 )1 9 -(1 )4 0 -(1 )4 -(1 ) 240 120 (3 )1 4 9 (3 ) QDS-4.9 –002-A2 8 4 (7 )3 6 2 5 (8 )1 3 9 (4 ) <39 5 1 (8 )1 8 9 (4 ) 1 5 9 (6) 5 -(1 ) 330 45 (9 )4 2 (4 ) 22 –14 –709-A3+ 3 0.3 (2 )3 3 1 0 (4 )3 -(1 ) <47 2 -(1 )9 -(1 ) <13 <18 120 40 (5 )1 6 1 5 (2 ) BMHBX 22 –14 –870 –2b-A2 55 7 (2 )8 5 8 0 (2 ) 140 45 (2 )8 5 -(1 )2 5 7 (2 )6 0 1 0 (2 )7 0 2 5 (2 )1 4 5 (2 ) 1400 790 (2 ) 8 0.3 (2 ) QD-2.2-A1 50 15 (13) 170 190 (9 ) 6 5 1 5 (1 1 ) < 1 1 0 2 6 1 0 (13) 90 30 (12) 90 35 (12) 14 4 (1 1 ) 1800 320 (14 )9 3 (8 ) QD-2.2-A3 55 25 (6) 90 75 (3 ) 9 0 1 0 (6) <75 29 8 (6) 85 25 (5 )9 0 4 5 (5 ) 2 3 1 5 (6) 2200 310 (6) 13 6 (4 ) 22 –14 –709-A3 70 25 (10 ) 470 400 (8 )8 0 3 0 (10 )8 0 -(1 )2 2 6 (10 )6 0 3 0 (10 )8 5 3 0 (10 )1 5 5 (10 ) 2100 220 (10 )9 7 (10) QDS-4.9 –002-A1 49 20 (4 ) 340 380 (3 )5 0 2 5 (4 )1 7 -(1 )1 3 3 (3 )4 5 1 5 (3 ) 6 0 0.4 (2 ) 1 0 0.4 (2 ) 1500 260 (4 )1 0 5 (3) QDS-4.9 –002-A2 60 15 (3 )8 5 3 0 (3 )9 0 3 0 (3 )2 5 -(1 )1 7 2 (3 )4 5 9 (3 )7 5 3 0 (3 ) 1 7 0.1 (3) 2000 85 (3 )9 0.2 (3) QDS-4.9 –007 80 40 (2 ) 190 95 (2 )8 5 9 (2 ) 3 8 0.5 (2 )2 5 4 (2 )7 5 6 (2 ) 120 6 (2 )1 9 1 0 (2 ) 2100 140 (2 )1 4 3 (2) VMHB X QD-2.2-A5 * 2 8 -(1 )6 5 2 0 (3 )1 7 -(1 ) 200 -(1 )2 0 1 5 (2 )5 0 -(1 ) <20 40 -(1 )8 0 4 5 (2 ) <13 ID STW QDS-3-A3 * 5 0 -(1 ) <10 12 12 (2 )1 7 -(1 )6 5 6 3 (2 )2 4 -(1 )1 2 8 (2 )1 8 -(1 ) 690 830 (2 )3 1 4 (2) QDS-3.4-A2 * 3 7 4 5 (2 )1 8 -(1 ) <10 45 10 (2 )5 5 2 0 (2 ) <12 <1 1 8 2 (3 )9 5 2 5 (2 )6 3 (2) QDS-3-A1 30 5 (2 )6 0 -(1 )5 0 4 5 (3 )1 7 -(1 )9 0 4 0 (5 )1 0 -(1 )1 7 -(1 )2 2 2 0 (2 ) 850 -(1 )2 9 30 (2) QDS-3-Ax 1 1 10 (3 )4 4 3 5 (3 )1 0 -(1 ) <25 60 65 (4 )1 8 7 (2 )6 5 1 8 (2 )9 -(1 ) 380 420 (3 )2 0 25 (2) QDS-4.9 –007 2 -(1 )6 -(1 )1 1 -(1 )4 1 -(1 )7 5 4 (2 )1 3 -(1 ) < 8 < 9 180 10 (2 )4 2 (2) BSTW QDS-3-A3 * 8 5 3 5 (5 )1 1 -(1 )5 4 1 5 (5 )3 0 1 0 (3 ) 250 80 (5 )7 0 3 5 (5 ) 1 10 60 (5 )3 0 1 0 (5 ) 1800 350 (5 )4 3 15 (5) QDS-3.5 140 30 (3 ) 180 65 (3 )4 8 2 0 (3 )2 0 -(1 )7 5 1 5 (3 ) 180 40 (3 ) 240 40 (3 )3 1 1 5 (3 ) 2300 450 (3 )3 1 10 (3) VSTW QDS-3.5 1 1 -(1 ) <24 <21 <120 7 -(1 )1 6 -(1 )3 5 -(1 ) <10 190 120 (4 ) <12 Individual inclustion data are provided in an electronic appendix. Data are reported as assemblage averages with 1 standard deviation and the number of significant concentrations (N ) in brackets set italic. <V ALUE reports values below the limit of detection using the 3σ criterion, except for samples marked with *, where the 1σ criterion was applied, because a small but significant LA-ICPMS signal was seen SD Standard deviation
affected. Vapour inclusions of boiling assemblages gener-ally have salinities higher than those expected from the
binary H2O–NaCl phase diagram and the
microthermo-metric properties of the associated brine inclusions (Fig.6).
This observation might be accounted for by trapping variable proportions of brine in vapour inclusions due to preferred wetting of brine relative to vapour on quartz but may equally point to loss of H2O, leaving behind a higher bulk salinity in the vapour inclusions. Therefore, the data derived from LA-ICPMS analyses of vapour inclusions are, again, interpreted as element ratios, with the possibility of some brine admixture.
Mineralisation stages, evolution of fluid chemistry and molybdenite precipitation
Two mineralisation events, the MHBX and the later stockwork veins (STW), each contributed comparably to the total economic Mo resource at Questa (Ross et al.
2002). The chemistry and evolution of the ore fluids of both
stages are remarkably similar, except for distinctive Cs/ (Na + K + Mn + Fe) signatures reflecting a distinction of the two input fluids already prior to their arrival at the ore
deposition site (Fig. 7; discussed below). Distinctive Cs/
(Na + K + Mn + Fe) ratios and systematically variable Mo/ (Na + K + Mn + Fe) ratios show that the two stages of mineralisation represent separate pulses of
magmatic-hydrothermal fluid, fluid batches that exsolved individually from a progressively more fractionated magma source.
Intermediate-density fluid inclusions (IDMHBX and
IDSTW) in early quartz generations followed by petrograph-ically later boiling assemblages suggest that brine (B1MHBX and BSTW) and vapour separated from a single-phase fluid of intermediate-density, as a result of cooling and decom-pression of the hydrothermal system during each mineral-isation stage. Boiling assemblages constrain temperatures of entrapment to about 420°C for both mineralisation stages. For phase separation to take place at 420°C, a
single-phase fluid with ~7 wt.% NaClequiv intersects the
two-phase surface close to the critical curve on the liquid-like side of the two-phase surface at a pressure of about 280 bar, taking the H2O–NaCl model system for reference
(Fig.6; Driesner and Heinrich2007). At a depth of 3,100 to
5,300 m constrained by stratigraphic reconstruction of the
volcanic pile (Molling 1989), a pressure of 280 bar would
correspond to a fluid column with an average fluid density
of 0.90 to 0.53 g/cm3, i.e. the recorded pressure is
consistent with approximately hydrostatic conditions during Mo deposition.
Intermediate-density inclusions in the MHBX (IDMHBX)
have an average Mo concentration of 42±28μg/g (average
over all IDMHBXinclusions, see“Electronic supplementary
material”), indistinguishable from that of later stockwork
veins (IDSTW; 36 ± 30 μg/g). Maximum values up to
wt%NaCl P [bar] 400 600 200 1000 800 1200 0 10 20 30 40 50 60 70 80 90 100 350° 400° 450° 500° 550° 600° 650° 700° 300° L+H (400 ° ) L+V+H crit. curve B2MHBX B1MHBX IDMHBX VMHBX source fluid
Fig. 6 NaCl-H2O P-T-X phase
diagram (after Driesner and Heinrich2007). The liquid + vapour coexistence surface is projected onto the P-X plane and contoured for temperature. The liquid + halite coexistence boundary at 400°C is also shown. This figure summarises the evolutionary path of the fluids in the Questa porphyry Mo system. The effect of post-entrapment modification affect-ing the brine populations of the early magmatic-hydrothermal breccia (MHBX), highlighted with a white arrow, may be the result of later heating associated with stockwork veining. Phase separation at 420°C translates into a fluid pressure of less than ~280 bar during MHBX mineralisation
~100 μg/g in both stages may be closer to the actual input concentration, however, if the lower concentrations are already affected by incipient molybdenite precipita-tion. Phase separation concentrated Mo and most other elements in the brine, which contains 300–500 μg/g Mo on average. The tendency for Mo partitioning into the saline liquid does not necessarily imply chloride com-plexation (which is unlikely in the light of limited
experimental data; e.g. Candela and Holland 1984, but
see preliminary data by Rempel et al.2006) and more likely
reflects the preference of molybdenum hydroxy species for the more hydrated environment of the denser liquid phase,
comparable to the solution behaviour of SiO2(Newton and
Manning2000).
The spatial association between molybdenite inclusions on growth zones in the quartz crystals and pseudosecondary brine trails in samples from the magmatic-hydrothermal breccia and from stockwork veins indicates that molybdenite precipitated mainly from the brine and only to a minor extent from the intermediate-density fluids or the vapour
phase (see Fig.3). The Mo/(Na + K + Mn + Fe) ratios of the
B1MHBX brine inclusions decrease systematically over two
orders of magnitude with decreasing total homogenisation temperature (Th,tot) from about 420°C to 360°C, whereas
10-1 10-2 10-3 10-4 10-2 10-3 10-4 10-5 10-1 Cs/(Na+K+Mn+Fe) Mo/(Na+K+Mn+Fe) 10-6 10-6 10-5 MHBX input fluid Melts BMHBX IDMHBX BSTW Barren intrusions MI (Audétat & Pettke, 2003) Barren intrusions ID (Audétat & Pettke, 2003) IDSTW
STW input fluid
spent ore fluids
LOD 10-1 10-2 10-3 10-4 10-2 10-3 10-4 10-5 10-1 Cs/(Na+K+Mn+Fe) Mo/(Na+K+Mn+Fe) 10-6 10-6 10-5 Precipitation of MoS2 Magma differentiation, fluid exsolution MHBX STW Fig. 7 Concentrations of molybdenum against Cs, nor-malised to the sum of main elements (Na + K + Mn + Fe) of the fluids, linking
the hydrothermal evolution at the level of the deposit to the evolution of the source magma at depth. Silicate melt inclusions from miarolitic cavities from barren intrusions within the Questa caldera (Audétat and Pettke2003) define a melt fractionation trend. Early stage ID inclusions from the magmatic-hydrothermal breccia (MHBX) and the later stock-work veins (STW) lie on a weak trend parallel to the melt trend (yellow and light-blue arrows). This implies that the STW stage evolved from a more frac-tionated magma than did the MHBX stage. Brine inclusions from both stages of mineralisa-tion show decreasing
Mo/(Na + K + Mn + Fe) at constant Cs/(Na + K + Mn + Fe), highlighted by vertical red (MHBX) and blue (STW) arrows, reflecting molybdenite precipitation (compare Fig.8)
all other cation ratios remain constant over this
temper-ature interval (Fig. 8). This demonstrates that a
temper-ature decrease caused molybdenite precipitation from the brine, precipitating 99% of Mo over less than 100°C cooling, just after the onset of phase separation at about 420°C. These data imply a minimum Mo solubility of
about 700 μg/g at 420°C in a high-salinity,
magmatic-hydrothermal liquid.
The Mo/Cu ratio in the intermediate-density fluids at
Questa is about 0.010 (=40μg/g Mo/4,000 μg/g Cu). This
is very similar to the single-phase fluids trapped prior to chalcopyrite saturation at the porphyry-Cu–Mo deposit of
Bingham Canyon (Mo/Cu ~0.014; Landtwing2004). This
leads to the conclusion that Cu, although present in the input fluid in high concentration, was not deposited in the ore bodies at Questa. Phase separation and boiling off of a low-salinity vapour phase has probably led to selective copper removal and the formation and accumulation of residual brine near the roof of the granite intrusion. Ore deposition by a dense brine could explain the horizontally
stratified shape of the ore bodies (Fig.1c; Ross et al.2002).
Escaping vapour will take significant amounts of Cu and,
probably S, (Heinrich et al.1999) out of the system. Low
concentrations of reduced sulphur already in the primary ore fluids and/or further depleted by vapour escape is suggested to be the reason why only molybdenite precip-itated at Questa, but virtually no chalcopyrite and pyrite despite high initial Cu and Fe content of the fluids.
Fluid source, magma evolution and the origin of Mo-only porphyries
The preceding discussion on fluid evolution within the Questa deposit indicates that this porphyry Mo ore body differs from the more common porphyry-Cu-(-Mo-Au) deposits by non-precipitation of copper iron sulphides, probably due to selective Cu and S loss to an escaping vapour phase. In addition, characteristic differences in the composition of the single-phase input fluids, relating to the evolution of their magmatic source, further contribute to the contrasting metal ratios. The Mo/Cu ratio in the intermediate-density fluids at Questa of about 0.010 is at least ten times higher than in similar fluids from the
Continental ore body at Butte (<10 μg/g Mo/10,000 μg/g
Cu; Rusk et al. 2004). Apart from the dominant copper
resource at Butte, the fivefold difference in Mo ore grade at Questa (0.14% Mo) compared with Butte (0.028% Mo) approximately matches the corresponding difference in the Mo content of the otherwise quite similar low-salinity and weakly CO2-bearing input fluids. This indicates a process of differentiation of metal endowments that probably occurred prior to the exsolution of the ore fluids from their source magmas. Selective Mo enrichment at Questa can either be caused by fractional crystallisation of the source magma or by a primary Mo enrichment already present in the parental magma. Our fluid compositional results from Questa, in conjunction with published data from barren
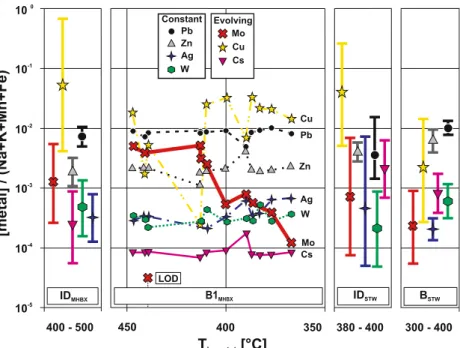
300 - 400 Thom, tot[°C] 350 400 450 380 - 400 B1MHBX IDSTW BSTW Pb Zn Ag Constant Ag Zn Pb Mo Mo Cu Cu W Cs Cs Evolving LOD 10-1 10-2 10-3 10-4 10-5 400 - 500 [metal] /(Na+K+Mn+Fe) 100 IDMHBX W
Fig. 8 The evolution of the ore metals relative to the sum of main elements of the fluids (Na + K + Mn + Fe) against homogenisation temperature of the fluid inclusions is shown for the magmatic-hydrothermal breccia (MHBX) and the later stockwork veins (STW). Elements not involved in fractionation or precipitation processes such as Zn, Ag, W, and Pb show constant ratios over the entire evolution of
the hydrothermal fluid from early intermediate-density (ID) to co-existing brine (B) and vapour inclusions. The Cs-ratios increase from the MHBX stage to the STW stage significantly. Molybdenum ratios of BMHBXinclusions decrease with decreasing temperature from ~410
plutons in the Questa Caldera (Johnson et al.1989, 1990;
Audétat and Pettke 2003) indicate that both factors
probably contributed to the specialised ore fluids that generated the Questa deposit.
Fluid and melt inclusion analyses from quartz phenoc-rysts and miarolitic cavities record the final stages of crystal fractionation and concurrent local fluid exsolution within the unmineralised Rito del Medio and Cañada Pinabete plutons. It occurred at a lithostatic fluid pressure of 1.2– 1.3 kbar, consistent with petrologic constraints and the observed gradual increase in the salinity of the exsolving
fluid (Audétat and Pettke2003). Taking the highly
incom-patible element Cs as a monitor of progressive magma crystallization, the fluid inclusion compositions from Questa (where no co-existing silicate melt inclusions in hydrothermal quartz could be identified) can be compared to the evolution of Rito del Medio (where co-existing fluid and melt inclusions are recorded, providing empirical fluid– melt distribution coefficients). The single-phase fluids of the stockwork veining stage (inclusions IDSTW) from
Questa closely approximate stage ‘Rito5lastGZ’ fluids in
the barren pluton, which records the transition from the last stage of fluid-saturated crystallisation of phenocrysts to the beginning of open-space crystallisation in miarolitic
cavi-ties (Audétat and Pettke2003). Coexisting fluids (~4.5 wt.
% salinity) and melts contain 130 and 14 ppm Mo, respectively, corresponding to a fluid–melt distribution coefficient of ~9. Using the same Mo distribution coeffi-cient and the average Mo content of 36 ppm analysed in the
IDSTW inclusions implies that the source melt for this
mineralisation stage at Questa contained about 4 ppm Mo on average, or up to 10 ppm if the highest analysed Mo concentrations in the fluids are taken as representative of the input ore fluids (above). Extracting 4 ppm Mo from a crystallising silicate melt into the exsolving volatile phase
requires a minimum of 60 Gt or 25 km3melt, in order to
liberate 0.24 Mt Mo presently contained in the stockwork veins (~60% of the total molybdenum reserves of the
Questa deposit; Ross et al. 2002). This estimate
demon-strates that fluid exsolution occurred from a large mass of silicate magma—much larger than the mass of rock forming the host Sulphur Gulch intrusion. Assuming complete precipitation of 0.24 Mt metal introduced by a fluid initially containing 36 ppm, Mo requires 7 Gt fluid.
Comparison of this fluid quantity with the estimated mass of silicate melt implies an initial water content in the source melt of ~10%. Note that the values used for this simple calculation have large uncertainties in absolute concentra-tions and resulting amounts of source melt and ore fluid. However, the water/melt ratio is determined by the field-derived fluid–melt distribution coefficient for Mo, which is
well defined at 9±4 by the data of Audétat and Pettke (2003).
Lower DMo,F/M values (as indicated by published
experi-ments using compositionally simpler systems; Candela and
Holland 1984; Keppler and Wyllie, 1991) would even
further increase the required water content of the melt at the time of fluid exsolution. Ten percent water is not soluble in a normal granitic source melt unless the confining pressure
is very high (5–6 kbar; Burnham1979) or the granitic melt
is enriched in fluxing agents such as F or Cl. The Cs concentration of the MHBX forming fluid does not indicate an extremely fractionated source melt, however. Therefore, it can be hypothesised that the confining pressure in the granitic source magma was high during fluid exsolution, suggesting that it occurred well below the Sulphur Gulch stock intrusion immediately underlying the Questa deposit, possibly at mid-crustal depths.
Other indications suggest that magma fractionation and ore fluid exsolution may have occurred already in the
middle or even lower crust, as Halter et al. (2005), Rohrlach
and Loucks (2005) and Klemm et al. (2007) have argued for
porphyry copper deposits. At Questa, a ~20-fold increase in Cs concentration is associated with a change from CO2-bearing intermediate-density fluids in the early MHBX to CO2-poor fluids in the later STW stage, without any
systematic increase in salinity. The presence of CO2in the
MHBX inclusions is consistent with a higher load pressure in the Questa fluid source than at Rito del Medio, where
Audétat and Pettke (2003) detected no CO2in the fluids.
These authors found that salinity increases with fractional crystallisation and fluid exsolution due to the preferential partitioning of H2O over chloride into the fluid at P<1.5
kbar (Cline and Bodnar 1994) but still with plagioclase as
the major fractionating phase (Johnson et al. 1989). In
addition, the concentrations of the most incompatible elements (Cs, Li) in the early fluids of the MHBX stage at Questa are lower than any fluids recorded at Rito del Medio, implying that less fractionated melts gave rise to the first mineralization pulse at Questa. Early fluid saturation in the deep cumulate zone of a vertically extensive magma chamber beneath the exposed plutons of the Questa caldera
was previously proposed by Johnson et al. (1989) to
explain the compositional variation of intimately associated metaluminous and peralkaline intrusions of otherwise similar trace-element parentage. Fluids fluxing the mid-crustal cumulates may even have originated from a deep basaltic intrusion represented by coeval mafic dykes, which probably contributed to the deep heat input for the
long-lived (~6 Ma; Johnson et al.1989) igneous province.
It is not known what triggered the two apparently separated pulses of mineralisation at Questa. If the two fluid pulses are indeed related to the same parental magma, the 20-fold increase in Cs concentration requires approxi-mately 95% crystallisation from the early (MHBX) to the later (STW) stage of ore fluid exsolution. The required total magma volume is, therefore, about 20 times larger than the