HAL Id: hal-00317228
https://hal.archives-ouvertes.fr/hal-00317228
Submitted on 1 Jan 2004
HAL is a multi-disciplinary open access
archive for the deposit and dissemination of
sci-entific research documents, whether they are
pub-lished or not. The documents may come from
teaching and research institutions in France or
abroad, or from public or private research centers.
L’archive ouverte pluridisciplinaire HAL, est
destinée au dépôt et à la diffusion de documents
scientifiques de niveau recherche, publiés ou non,
émanant des établissements d’enseignement et de
recherche français ou étrangers, des laboratoires
publics ou privés.
Anomalous nighttime electron temperatures over
Millstone Hill: a statistical study
V. V. Lobzin, A. V. Pavlov
To cite this version:
V. V. Lobzin, A. V. Pavlov. Anomalous nighttime electron temperatures over Millstone Hill: a
statistical study. Annales Geophysicae, European Geosciences Union, 2004, 22 (2), pp.431-439.
�hal-00317228�
Annales Geophysicae (2004) 22: 431–439 © European Geosciences Union 2004
Annales
Geophysicae
Anomalous nighttime electron temperatures over Millstone Hill:
a statistical study
V. V. Lobzin and A. V. Pavlov
Institute of Terrestrial Magnetism, Ionosphere, and Radio-Wave Propagation, Russian Academy of Sciences (IZMIRAN), Troitsk, Moscow Region, 142190, Russia
Received: 17 December 2002 – Revised: 1 June 2003 – Accepted: 18 June 2003 – Published: 1 January 2004
Abstract. A statistical study of anomalous nighttime elec-tron temperature enhancements, NETEs, observed on 336 nights during Millstone Hill radar measurements on 730 nights from 1976 to 2001 is carried out. NETEs are most frequent in winter and in autumn. The NETE occurrence has a maximum probability in February and a minimum proba-bility in July. The asymmetry between spring and autumn NETE occurrences is found for NETEs, which are observed during geomagnetially quiet time periods. The calculated value of the NETE occurrence probability is decreased with the solar activity index F10.7 increase. The increase in a 3-h geomagnetic index Kpor the decrease in a 1-h geomagnetic
index Dstleads to the increase in the NETE occurrence
prob-ability. This tendency is more pronounced for current values of Kpor Dstrather than for delayed ones and becomes more
weak with the delay increase. The NETEs are most likely to begin between 19:00 and 20:00 UT. The studied NETEs are characterized by the most typical duration from 1 to 3 h with the percentage peak between 1 and 2 h. The electron temper-ature increases are predominately between 100 K and 300 K. We did not find any relationship between the amplitude and duration of the NETEs studied. It is shown that there is a tendency for the NETE amplitude to increase if the value of Kp or |Dst|increases. To determine whether there exists a
difference between NETEs observed during different solar cycles, we chose the data subsets corresponding to 21 and 22 solar cycles and performed the statistical studies for each subset. It was found that, within the errors, the correspond-ing dependencies are the same for the cycles considered and for the entire data set.
Key words. Ionosphere (plasma temperature and density; ionospheric disturbances; modeling and forecasting)
1 Introduction
Unusually high nighttime F-region electron temperatures over Millstone Hill were first observed in 1964 by Evans (Evans, 1967), and the measurements of these Millstone Hill Correspondence to: V. V. Lobzin ([email protected])
anomalous electron temperatures were presented in many subsequent papers (e.g. Evans and Holt, 1978; Babcock and Evans, 1979; Garner et al., 1994; Pavlov, 1994; Richards and Khazanov, 1997; Pavlov et al., 1999, 2000, 2001; Pavlov and Oyama, 2000; Richards et al., 2000; Pavlov and Fos-ter, 2001). Anomalous high electron temperatures in the mid-latitude winter nighttime ionosphere were also found by Sanatani and Breig (1981) using OGO 6 data. Garner et al. (1994) used the data on 173 nights between 1967 and 1974 and found that nighttime electron temperature enhance-ments, NETEs, were observed during 41 nights. Using this limited data set, Garner et al. (1994) carried out a statisti-cal study of these NETEs and examined the occurrence fre-quency, the duration, the time of onset, the magnitudes of temperature increases, and the dependence on solar and ge-omagnetic activity. For some of the conclusions deduced by Garner et al. (1994), a statistical validity is unclear due to the very limited data set used. The main aim of the present pa-per is to carry out a more reliable statistical study of NETEs with the use of Millstone Hill radar data on 730 nights from 1976 to 2001. The results obtained are compared with early results of Garner et al. (1994) to emphasise the newness of our results.
An anomalous nighttime electron density enhancement, NEDE, is also a well-known middle latitude F-region phe-nomenon (e.g. Evans, 1965, 1974; Da Rosa and Smith, 1967; Rao et al., 1982). In our analysis we study the relationships between NETEs and the changes in the electron density dur-ing these events. It makes clear that there exists a possibility to observe a NEDE during a NETE.
2 Data and method of data analysis
Ionospheric radar observations from Millstone Hill (42.6◦N, 288.5◦E) taken on 730 nights with an overall duration of 6372 h from 2 February 1976 to 10 September 2001 are the subject of the present study. We use the 300-µs pulse length data which have an altitude resolution of 45 km. NETEs were observed on 336 nights during the studied time period.
432 V. V. Lobzin and A. V. Pavlov: Anomalous nighttime electron temperatures over Millstone Hill 18 2 4 6 8 10 12 M 0 2 4 6 8 ΨM ( % per hour ) Fig. 1
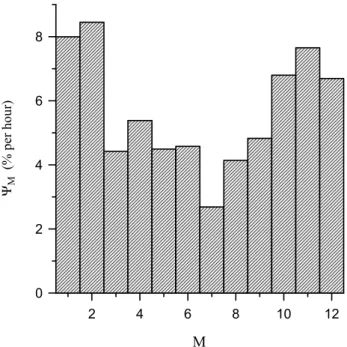
Fig. 1. The dependence of the NETE occurrence probability 9M
on a number M of a given month in a year.
Our definition of a NETE is close to that given by Garner et al. (1994). Data are averaged over half-hour time periods to decrease effects of errors of measurements of electron tem-peratures, T , and electron number densities, N . Like Garner et al. (1994), the data are interpolated to obtain the values at 400 km. We give a nighttime electron temperature enhance-ment the labels “NETE” if the electron temperature increase is greater than 100 K, i.e. when the temperature enhancement exceeds any experimental uncertainties (Garner et al., 1994). In order to avoid sunrise or sunset effects, we analyse only observations for large enough zenith angles, χ ≥ 100◦.
A NETE event begins, when a relative minimum in elec-tron temperature is observed. The peak elecelec-tron temperature is the relative maximum. Like Garner et al. (1994), the as-sumed NETE duration is the length of time interval between the onset of the event and the peak, and events with duration less than 1 hour are not taken into consideration. The ampli-tude of a NETE is defined as the difference between the peak temperature and the onset temperature.
We analyze 392 NETE events which were observed during 336 nights. Single NETE events per night were observed by the Millstone Hill radar during 286 nights, two NETEs per night were found during 44 nights, and three NETEs per night were observed during 6 nights.
We study the dependence of the probabilities of NETE oc-currences during 1-h nighttime periods on a daily solar ac-tivity index, F10.7, a 3-h geomagnetic index, Kp, a 1-h
ge-omagnetic index, Dst, a number, M, of a given month in
a year, and an onset local time, t0. Let X be some of the
parameters mentioned. The corresponding probability func-tion, 9X, is estimated as a ratio of a number of NETE
ob-servations that occur for a given interval of X to the total
duration of nighttime measurements for the same interval of X. It should be noted that the duration of radar measure-ments has noticeable seasonal changes for the analyzed data set, and the simple percentage may have no physical impor-tance. Analogously, the duration of observations for differ-ent intervals of solar and geomagnetic indices are not equal to each other, and it is this fact that generates the need to use the probability per hour of observations to reveal physical causes of the events considered. To estimate the errors for the oc-currence probabilities, we assume that for given conditions the probability distribution function for the number of NETE events, NNETE, can be considered as Gaussian with the
vari-ance σ2≈NNETE. In this case, we can use σ as a measure of
statistical fluctuations of the number of events observed. It should be noted that approximately 68% of all observations should fall within a range of ±σ from the mean; the fluctua-tions with larger amplitudes have a relative frequency of 32% or less.
3 Results and discussion
3.1 Seasonal variations in the NETE occurrence probabil-ity
Figure 1 shows the dependence of the NETE occurrence probability 9M on a number of a given month in a year. It
can be seen from Fig. 1 that the NETE occurrence probabil-ity is the lowest in July. However, in contrast to the con-clusions of Garner et al. (1994) about the almost complete disappearance of NETEs in summer, the values of 9Mfound
in the autumn and spring months are close to that in the sum-mer months. One can notice from Fig. 1 that the maximum value of the NETEs occurs in February, and this result is in general agreement with more early conclusions of Garner et al. (1994) about the predominance of NETE occurrences in winter.
The 3-month averages of 9M, presented in Table 1, show
the seasonal distribution of all studied NETE observations. As usual, we assume that December, January, and February are the winter months; March, April, and May correspond to spring; June, July, and August are the summer months; and September, October, and November correspond to autumn. Relative to the summer magnitude of 9M, the other average
seasonal values of 9M give an increase with the maximum
probability in winter. The asymmetry between the spring and autumn months is seen in Table 1 for the NETE occurrence probability, with a stronger autumn enhancement. However, it will be shown in Sect. 3.3 that the NETE occurrence prob-ability increases with the geomagnetic activity Kp index.
This dependence could form a part of the seasonal depen-dence of 9M shown in Fig. 1 and in Table 1 for all events, if
the studied events are distributed non-uniformly between the seasons. To examine this hypothesis, we divide the measure-ments into two groups corresponding approximately to the geomagnetically quiet and disturbed conditions. When the thermosphere is disturbed, it takes time for it to relax back
V. V. Lobzin and A. V. Pavlov: Anomalous nighttime electron temperatures over Millstone Hill 433
Table 1. Average values of 9M (% per hour) during winter, summer, spring, and autumn months for all observations, as well as
for measurements made under geomagnetically quiet and disturbed conditions. The conditions are considered to be quiet if current
Kp≤3(I), Kp≤3 during 12 h (II) or 24 h (III) before the measurement, otherwise the conditions are disturbed.
all I II III
events quiet disturbed quiet disturbed quiet disturbed Winter 7.8 ± 0.6 7.1 ± 0.7 9.1 ± 1.2 7.3 ± 0.9 8.2 ± 0.9 7.1 ± 1.0 8.2 ± 0.9 Spring 4.8 ± 0.6 1.8 ± 0.4 10.1 ± 1.4 1.5 ± 0.5 7.7 ± 1.0 1.2 ± 0.5 6.6 ± 0.8 Summer 3.8 ± 0.7 3.1 ± 0.6 7.5 ± 2.3 2.4 ± 0.6 6.9 ± 1.6 2.4 ± 0.7 5.3 ± 1.1 Autumn 6.7 ± 0.6 5.3 ± 0.6 9.5 ± 1.2 4.8 ± 0.7 8.4 ± 0.9 5.9 ± 0.9 7.1 ± 0.7
to its initial state, and this thermosphere relaxation time de-termines the time for the disturbed ionosphere to relax back to the quiet state. It means that not every time period with sufficiently low Kp (e.g. Kp≤3), can be considered as a
geomagnetically quiet time period. The characteristic time of the neutral composition recovery after a storm impulse event ranges from 7 to 12 h, on average (Hedin, 1987), while it may require days for all altitudes down to 120 km in the atmosphere to recover completely back to the undisturbed state of the atmosphere (Richmond and Lu, 2000). We as-sume that the conditions are quiet if Kp≤3 during the 24 h
before the measurement, otherwise the conditions are dis-turbed. The calculated average values of 9M over 3-month
intervals are presented in Table 1 (columns III). It follows from Table 1 that the seasonal dependence of the average values of 9Mis more strongly pronounced for the quiet
con-ditions as compared with that for the disturbed concon-ditions. When the NETEs observed under quiet conditions are ig-nored, the seasonal variations in 9Mare approximately
sym-metric for the spring and autumn months. Thus, the asym-metry between spring and autumn NETE occurrences is pro-duced by the asymmetry in the magnitudes of the spring and autumn sources of NETEs during geomagnetically quiet pe-riods. During geomagnetically disturbed periods, a magni-tude of spring and autumn sources of NETEs is approxi-mately the same, and it leads to the symmetry between spring and autumn NETE occurrences. It is quite possible that there are differences in physical processes that form NETEs dur-ing time intervals with Kp≤3 and Kp>3 and these
differ-ences result in the asymmetry found between the spring and autumn 9Mfor quiet conditions.
As a result of our study, the asymmetry between spring and autumn NETE occurrences is found and the predominance of NETE occurrences in the winter and autumn months is dis-covered for geomagnetically quiet conditions. Comparable values of the average probabilities of the existence of NETEs during the winter and autumn months and the asymmetry between spring and autumn NETE occurrences found argue against the idea by Evans (1967) that the heating of thermal electrons at F-region altitudes is only caused by a simple
re-lationship of these anomalous temperature enhancements to conjugate photoelectrons.
If we define the quiet conditions as the conditions, when Kp≤3 during δt =24 h before the measurement, and
other-wise the conditions are considered as disturbed, the number of the studied quiet and disturbed NETEs are N umq=112
and N umd=280, respectively. For δt =12 h and δt =0 h
we obtain N umq=140, N umd=252 and N umq=207,
N umd=185, respectively. As δt decreases, the number of
events corresponding to quiet conditions, N umq, increases,
while the seasonal NETE probability distribution is not changed within the errors (see Table 1, columns I and II). This result is consistent with the conclusion of our study, pre-sented in Sect. 3.3, that the probability of observing a NETE depends on the current value of index Kprather than its
pre-vious values.
3.2 Solar activity variations in the NETE occurrence prob-ability
The dependency of the NETE occurrence probability 9F10.7
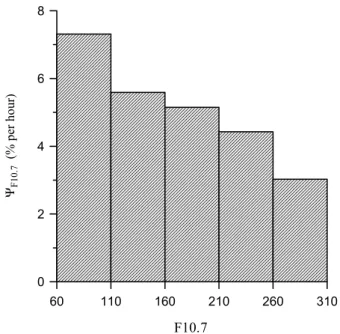
on a daily solar activity index F10.7 is shown in Fig. 2. It can be seen from Fig. 2 that the value of 9F10.7 is decreased
with the solar activity index increase, and the dependence of 9F10.7 on F10.7 within the accuracy of the analysis is very
close to the linear one. Garner et al. (1994) had not enough data to draw the plot for the dependence of the NETE oc-currence on F10.7. They only found that the NETE occur-rence frequency is 26% per night for solar minimum tions (F10.7≤100), 26% per night for solar medium condi-tions (100<F10.7≤150), and 11% per night for solar maxi-mum conditions (F10.7>150). Our results do not agree with the conclusions of Garner et al. (1994) that the NETE oc-currence frequency is the same for solar minimum and so-lar medium conditions, and that the soso-lar maximum NETE occurrence frequency is noticeably lower than that at solar minimum or at solar middle activity levels. Our averaged val-ues of 9F10.7are found to be 7.5% per hour for F10.7≤100,
6.4% per hour for 100<F10.7≤150, and 5.0% per hour for F10.7>150. The disagreement between our calculations and the results of Garner et al. (1994) may result from statistical
434 V. V. Lobzin and A. V. Pavlov: Anomalous nighttime electron temperatures over Millstone Hill fluctuations of the estimates of the occurrence probability,
inasmuch as the fluctuations can be rather large for such a small data set which was used by Garner et al. (1994). 3.3 Geomagnetic activity variations in the NETE
occur-rence probability
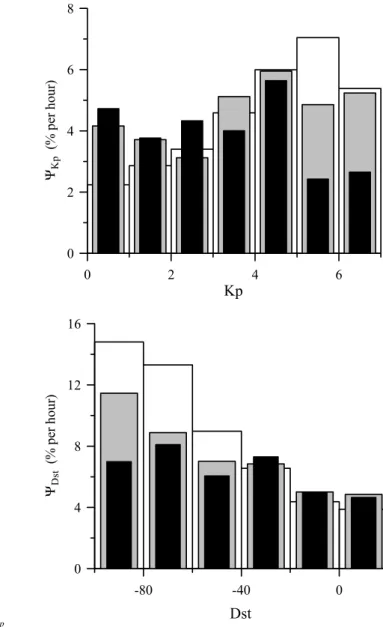
Figure 3 shows the dependence of the NETE occurrence probabilities, 9Kp and 9Dst, on a 3-h geomagnetic index Kp and on a 1-h index Dst, respectively. Our calculations
present a first evidence in the increase of 9Kpand 9Dst with the geomagnetic activity. A small decrease in the last bin of the histogram for 9Kp is within the experimental error. It should be noted that Garner et al. (1994) were not capable of producing an evidence in favour of or against any correlation between geomagnetic activity and NETEs, because their data set was obtained predominantly under geomagnetically quiet conditions.
To find the time scales relevant for NETE formation as a response to geomagnetic activity, we calculated NETE’s probability density functions depending not only upon the current value of the geomagnetic indices Kpand Dst, but on
their previous values as well. The results obtained are shown in Fig. 4. It was found that the tendency for increasing the probability together with the geomagnetic activity persists up to 9 h, for larger delays (12–15 h and more) the probability does not depend on Kp or Dst. However, the tendency is
more pronounced for current values of Kpor Dst rather than
for delayed ones and becomes more weak with the delay in-crease, i.e. the NETE mechanism is associated with the cur-rent electrodynamic activity in the ionosphere-plasmasphere system. It is worth noting that, due to a relatively small num-ber of events observed for large Kp, both current and
previ-ous, the errors for the two last bins in the top panel of Fig. 4 is higher than that for the other bins. In particular, the heights of black bins, which correspond to the results obtained with the indices measured 15 h before NETEs, are approximately the same within the errors.
To explain the tendency for the probability to increase to-gether with the previous geomagnetic activity, we can sug-gest that NETEs are rather short-lived events, and their oc-currence probability depend upon the current state of the ionosphere and plasmasphere rather than their previous state. The tendency may result from the fact that the typical dura-tions of geomagnetic disturbances accompanied by NETEs are larger than 3 h, may sometimes reach 12 h, and only rare disturbances are longer.
3.4 Temporal variability of NETE
In Fig. 5, the dependence of the probability 9t0for an NETE
to begin during 1-hour time periods on a local NETE on-set time 9t0is presented. In agreement with earlier
conclu-sions of Garner et al. (1994), we found that NETEs are most likely to begin between 19:00 and 20:00 UT. Our calcula-tions produce evidence in favour of the conclusion that the
19 60 110 160 210 260 310 F10.7 0 2 4 6 8 ΨF10.7 (% pe r hou r) Fig. 2
Fig. 2. The dependencies of the NETE occurrence probability
9F10.7on a daily solar activity index F10.7.
probability of the NETE onset is similar between 20:00 UT and 01:00 UT.
To study the distribution of NETE durations, we calculate a number, S1t1≤1t<1t 2, of NETEs with durations within a
given range, 1t 1 ≤ 1t < 1t2. The percentage, P1t, is
defined as the ratio of S1t1≤1t <1t 2 to the total number of
NETE events. Figure 6 shows the statistical distribution of NETE durations. The distribution falls off exponentially, log10(P1t) =a + b(tP−tO), (1)
where a = 2.357±0.013, b = −0.373±0.008, the unit of P1t is percent, and the unit of tP −tO is an hour. It follows
from our calculations that NETEs last between 1 and 3 h in most cases, with the percentage peak between 1 and 2 h. This result does not support the conclusion by Garner et al. (1994) that the most probable duration of NETEs is from 2 to 3 h. 3.5 Amplitude variability of NETE
To study the distribution of NETE amplitudes, we calcu-late a number, S1T1≤1T <1T 2, of NETEs with amplitudes
in a given range, 1T 1 ≤ 1T < 1T 2. The amplitude of the studied NETEs are expressed in terms of the difference be-tween the temperature at the peak, Tp, and the temperature,
To, at the onset. The percentage, P1T, is defined as the ratio
of S1T1≤1T <1T 2to the total number of NETE events.
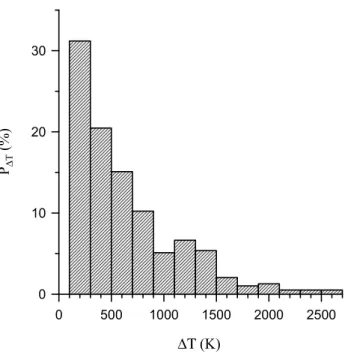
Fig-ure 7 shows the statistical distribution of NETE amplitudes. The amplitude distribution has approximately an exponen-tial distribution form: log10(P1T)=a + b(TP −TO), where
a = 1.648±0.009, b = (−8.03±0.12) · 10−4, the unit of P1Tis percent, and the unit of TP−TOis K.
In agreement with the conclusions by Garner et al. (1994), the temperature increases are predominately between 100 K
V. V. Lobzin and A. V. Pavlov: Anomalous nighttime electron temperatures over Millstone Hill 435 20 0 2 4 6 Kp 0 2 4 6 8 ΨKp ( % pe r hour ) Fig. 3 -80 -40 0 Dst 0 4 8 12 16 ΨDs t ( % pe r hour )
Fig. 3. The dependence of the NETE occurrence probability 9Kp and 9Dston a 3-h geomagnetic index Kp(top panel) and 1-h index
Dst (bottom panel).
and 300 K. A maximum temperature increase of about 2600 K was observed. One can suggest that there exists a correlation between the NETE duration and amplitude. How-ever, we did not find any relationship between the amplitude and duration of the NETEs studied.
3.6 Relationship between the NETE amplitudes and geo-magnetic activity
Figure 8 shows the relationship between the NETE ampli-tudes at 400 km and the geomagnetic activity measured by the index Kp corresponding to the peak of the NETE. The
amplitude of the studied NETEs are expressed in terms of the difference between the temperature at the peak, Tp, and
the temperature, To, at the onset. It follows from Fig. 8 that
there is a correlation between the quantities studied. The cor-relation coefficients of log10(Tp−To)with Kp and Dst are
21 0 2 4 6 Kp 0 2 4 6 8 ΨKp ( % pe r ho ur ) -80 -40 0 Dst 0 4 8 12 16 ΨDst ( % pe r ho ur ) Fig. 4
Fig. 4. The dependence of the NETE occurrence probability 9Kp
and 9Dston current (white bins) and previous (gray and black bins)
values of 3-h geomagnetic index Kp(top panel) and 1-h index Dst
(bottom panel). For both indices, the histograms with gray bins show the probability versus the indices measured 9 h before the NETEs peaks, while the black bins correspond to the results ob-tained with the indices measured 15 h before NETEs.
found to be 0.33±0.05 and −0.30±0.05, respectively. We conclude that there exists a tendency for the NETE ampli-tude to increase together with the geomagnetic activity. 3.7 Relationship between NETE and electron number
den-sity changes
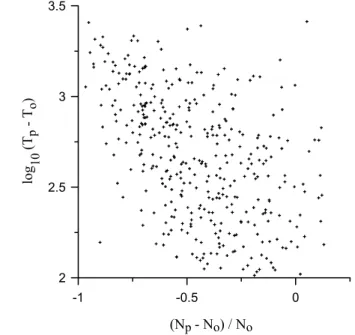
The electron number density can rise or fall during a NETE. The relationship between the electron temperature and num-ber density changes at 400 km during NETEs is shown in Fig. 9. The temperature changes are expressed in terms of the difference between the temperature at the peak and the temperature at the onset of NETEs. The electron number
436 V. V. Lobzin and A. V. Pavlov: Anomalous nighttime electron temperatures over Millstone Hill 22 19 21 23 1 t0 (hours) 0 4 8 12 Ψt0 (% per h our ) Fig. 5
Fig. 5. The dependence of the NETE occurrence probability 9t0
for NETEs to begin during 1-hour time periods.
23 0 2 4 6 Duration (hours) 0 10 20 30 40 50 P∆t (% ) Fig. 6
Fig. 6. The statistical distribution of NETE durations in 1-h bins.
density changes are the ratio of the electron number density, Np, at the peak electron temperature to the electron
num-ber density, No, at the onset. In agreement with the previous
results by Garner et al. (1994), during most of the NETEs the number density decreases and only a few events (about 4.5% in the data set used) are accompanied by the increase in density. From Fig. 9, it is easily seen that there exists an anti-correlation between the quantities studied, the correla-tion coefficient between (Np−No)/Noand log10(Tp−To)
24 0 500 1000 1500 2000 2500 ∆Τ (K) 0 10 20 30 P∆T (%) Fig. 7
Fig. 7. The statistical distribution of NETE amplitudes in 200 K bins.
is −0.47±0.04. Thus, there exists a tendency for the plasma depression to increase as the NETE amplitude increases, and NEDEs are practically not observed during the NETEs. It is unclear in advance if the relationship between NETEs and number density changes at 400 km during NETEs is the same for quiet and disturbed geomagnetic conditions. We assume that the conditions are quiet if Kp≤3 during the 24 h before
the measurement, otherwise the conditions are disturbed. We found that the correlation coefficient between log10(Tp−To)
and (Np−No)/Nocan be evaluated as −0.46±0.05 for quiet
conditions and as −0.44±0.06 for disturbed conditions. We conclude that the correlation between the electron tempera-ture and number density changes during NETEs is the same for quiet and disturbed geomagnetic conditions.
3.8 Remarks on sources of the observed NETEs
The physical origin of the observed NETEs is still unclear. The Millstone Hill’s conjugate point is sunlit the whole night for the most of the winter period, but the NETEs only oc-cur for a few hours. The study of Garner et al. (1994) and the results of this work show that the NETEs exist in the fall and spring months, i.e. these results do not support the idea of Evans (1967) that the heating of thermal electrons in the ionosphere is only caused by a simple relationship of these anomalous temperature enhancements to conjugate photoelectrons. It should be noted that Richards and Khaz-anov (1997) found that the plasmaspheric electron heating from photoelectrons must be doubled to reproduce the Mill-stone Hill observed topside electron temperature by the FLIP model of the ionosphere and plasmasphere during the periods 25–29 January 1993, i.e. the interaction between
photoelec-V. photoelec-V. Lobzin and A. photoelec-V. Pavlov: Anomalous nighttime electron temperatures over Millstone Hill 437 25 0 3 6 9 Kp 0 500 1000 1500 2000 2500 Tp - To ( K ) Fig. 8
Fig. 8. The relationship between the measured electron tempera-ture changes at 400 km during NETEs over Millstone Hill and a 3-h geomagnetic activity index Kp. The temperature changes are
ex-pressed as the difference between the temperature at the peak, Tp,
and the temperature at the onset, To.
trons and thermal electrons cannot be considered as a source of an NETE if the current photoelectron theory is used. As a result, we believe that there is an additional heating rate, Qad, of thermal electrons in the plasmasphere.
The presence of photoelectrons in the ionosphere and plas-masphere is a potential source for the onset of plasma insta-bilities that can change the photoelectron distribution func-tion and heating rate of electrons. The possible addifunc-tional sources of the electron heating in the plasmasphere, such as wave-particle interactions, which can cause increased pho-toelectron scattering, and Coulomb collisions between ring current ions and plasmaspheric electrons and ions, could be the possible mechanisms to explain the observed electron temperature enhancements in the plasmasphere. Such a re-quired additional heat source for electrons, over that for the usual photoelectron heating from Coulomb collisions, was used in many papers to make the modeled and measured electron temperatures agree (Horwitz et al., 1990; Pavlov, 1994, 1996, 1997; Balan et al., 1996; Richards and Khaz-anov, 1997; Pavlov et al., 2000, 2001). It is also possible that the physics of ionosphere-plasmasphere transport of photo-electrons is not well understood at this time.
As far as the authors know, there are no published reports of the comparison between the measured and modeled elec-tron temperature in the ionosphere and plasmasphere along the same magnetic field line or close to the same mag-netic field line except for the papers by Pavlov et al. (2000, 2001). As a result, there are no other published reports of an ionosphere-plasmasphere electron energy balance exam-ination based on the electron temperature measurements in
26 -1 -0.5 0 (Np - No) / No 2 2.5 3 3.5 log 10 (Tp - To ) Fig. 9
Fig. 9. The relationship between the measured electron temperature and number density changes at 400 km during NETEs over Mill-stone Hill. The temperature changes are expressed as the difference between the temperature at the peak, Tp, and the temperature at the
onset, To. The electron number density changes are the ratio of the
electron number density at the peak electron temperature, Np, to
the electron number density at the onset of the NETEs, No.
the ionosphere and plasmasphere close to the same magnetic field line. Several comparisons between the measured and modeled electron density and temperature obtained from the measurements by the Millstone Hill incoherent scatter radar in the ionosphere and the EXOS-D satellite in the plasmas-phere for the undisturbed and geomagnetic storm periods of 20–30 January 1993 and 25–29 June 1990 were presented by Pavlov et al. (2000, 2001). Among other findings, it was found that additional heating brings the measured and mod-eled electron temperatures into agreement in the plasmas-phere and into very large disagreement in the ionosplasmas-phere if the electron heat flux along the magnetic field line is calcu-lated with the use of classical formulas derived by Spitzer and Harm (1953). A new approach based on a new and effective nonlocal electron thermal conductivity coefficient, λe, along the magnetic field line was presented by Pavlov et
al. (2000, 2001) to bring the measured and modeled electron temperatures into agreement in the ionosphere and plasma-sphere. This approach leads to the electron heat flux, Fe,
which is less than that given by the classical Spitzer and Harm (1953) theory of the electron thermal conductivity.
The observed NETE characteristics, described in Sects. 3.1–3.7, are determined by variations in Qad, Fe,
and the cooling rates of thermal electrons. First of all, it should be noted that the NETEs are not regularly observed events. It means that the corresponding variations in Qadare
not regular as well. In a mixture of electrons and ions, the classical thermal conductivity coefficient depends only on
438 V. V. Lobzin and A. V. Pavlov: Anomalous nighttime electron temperatures over Millstone Hill T, while the thermal conductivity coefficient λeis a function
of T , |∂s∂ T |, and N (Pavlov et al., 2000, 2001), where S is the distance along the magnetic field line. As a result, the magnitude of |Fe| is decreased under the action of the
increase in N or in |∂s∂ T |. In addition to the dependence of |Fe|on N , we take into account that the electron-ion cooling
rate of thermal electrons, which is the main cooling rate in the plasmasphere and topside ionosphere, is proportional to N squared. As a result, there is the relationship between NETEs and electron number density changes described in Sect. 3.7. In spite of the fact that a dependence of Qad
on F10.7 is unknown, we can conclude that the increase in N with the F10.7 increase can be part of the reason for the noted decrease in 9F10.7 with the solar activity index
increase (it is not inconceivable that it is the main reason). We found that the NETE occurrence probability reveals the increase with geomagnetic activity characterized by the current geomagnetic activity indices Kp or Dst. It means
that, at least partially, the dependence of the probability of the NETE occurrence on Kp or Dst is determined by
pro-cesses that control the increase of Qad with the increase in
Kp or |Dst|. The characteristic heating or cooling time of
plasmaspheric thermal electrons is about one hour or less at L-shells which correspond to middle geomagnetic latitudes (Khazanov et al., 1992). Therefore, the NETE occurrence probability depends on the current state of the ionosphere and plasmasphere within this characteristic time, and does not depend on the previous state of the ionosphere and plasma-sphere. The observed NETEs are rather short-lived events, with the typical characteristic time of about 3 h or less (see Sect. 3.4), and the dependence of the NETE occurrence prob-ability on Kpor Dstbecomes more weak as we increase the
delay between the NETE observation time and the Kpor Dst
determination time. It means that the typical characteristic time of Qadis about 3 h or less as well. The increase of Qad
with geomagnetic activity is reasonable, but further work, which goes beyond the objective of our paper, is required to express this result in detailed changes in physical processes that determine the value of Qad. It should be noted as well
that the main cooling rate in the topside ionosphere is pro-portional to N squared, and, as a result, we assume that the variations in the electron density of the topside ionosphere with the Kp or |Dst|increase can be part of the reason for
the increase in the NETE occurrence probability found with the Kpor |Dst|increase.
We assume that the seasonal variations found in the NETE occurrence probability and the temporal and amplitude vari-ability found of the NETEs are determined (at least par-tially) by the corresponding variations in Qad. The
theoret-ical study of the phystheoret-ical origins of these variations in Qad
goes beyond the objective of this work.
4 Conclusions
This paper is aimed at studying anomalous electron temper-ature enhancements observed on 336 nights over Millstone
Hill during Millstone Hill radar measurements on 730 nights from 1976 to 2001. The predominance of NETE occurrences in winter and autumn months is revealed. The found maxi-mum value of the NETE probability is located in February and the NETE occurrence probability is the lowest in July. The asymmetry between spring and autumn NETE occur-rences is found for NETEs that are observed during geo-magnetically quiet time periods, when Kp≤3 during the 24 h
before the measurements. The study of the seasonal depen-dence of the NETE probability was carried out with other definitions of the quiet conditions as well, i.e. the condi-tions were considered as quiet when Kp≤3 during the 12
and 0 h before the measurement, and otherwise considered as disturbed. The decrease in δt leads to the increase in the number of quiet NETEs, while the seasonal NETE proba-bility distribution is not changed within the errors. This re-sult is consistent with the conclusion of our study, presented in Sect. 3.3, that the NETE occurrence probability depends upon the current level of geomagnetic activity rather than on previous levels.
The calculated value of the NETE occurrence probability is decreased with the solar activity index F10.7 increase, and this dependence is very close to the linear one. The NETE occurrence probability is increased, together with the geo-magnetic activity (when the geogeo-magnetic activity index Kp
increases and the index Dstdecreases). The tendency is more
pronounced for current values of Kpor Dst rather than for
delayed ones and becomes weaker with the delay increase. We found that the NETEs are most likely to begin between 19:00 and 20:00 UT, and the probability of the NETE on-set is similar between 20:00 UT and 01:00 UT. The studied NETEs last between 1 and 3 h in most cases, with the per-centage peak between 1 and 2 h. The electron temperature increases are predominately between 100 K and 300 K.
We did not find any relationship between the amplitude and duration of the NETEs studied. A correlation between log10(Tp−To)and the Kpand Dst geomagnetic activity
in-dices is found, i.e. there is a tendency for the NETE ampli-tude to increase as the magniampli-tude of Kpor |Dst|increases.
We found that during most of the NETEs the number den-sity decreases and only a few events (about 4.5% in the data set used) are accompanied by the increase in density. An anticorrelation between log10(Tp−To)and (Np−No)/No
is found. Thus, there exists a tendency for the plasma de-pression to increase as the NETE amplitude increases, and NEDEs are observed very rarely during NETEs. The corre-lation coefficient between the quantities studied is the same for quiet and disturbed geomagnetic conditions.
To determine whether there exists a difference between NETEs observed during different solar cycles, we chose the data subsets corresponding to 21 and 22 solar cycles, which are very similar in magnitude, and for each subset performed the statistical studies outlined above for the total set of data. It was found that, within the errors, the corresponding de-pendencies are the same for the cycles considered and for the entire data set.
V. V. Lobzin and A. V. Pavlov: Anomalous nighttime electron temperatures over Millstone Hill 439 Acknowledgements. The research described in this publication was
supported by grant 02-05-64204 from the Russian Foundation for Basic Research. Used electron temperatures and densities were observed by the incoherent scatter radar at Millstone Hill, Mas-sachusetts. The authors would like to thank the staff of the Mill-stone Hill Observatory for a possibility to use the Madrigal Data Base. The authors would like to thank referees for their comments, which have assisted in improving the paper.
Topical Editor M. Lester thanks R. H. Comfort and S. Zhang for their help in evaluating this paper.
References
Babcock, Jr., R. R. and Evans, J. V.: Effects of geomagnetic distur-bances on neutral winds and temperatures in the thermosphere observed over Millstone Hill, J. Geophys. Res., 84, 5349–5354, 1979.
Balan, N., Oyama, K.-I., Bailey, G. J., and Abe, T.: Plasmaspheric electron temperature profiles and the effects of photoelectron trapping and an equatorial high-altitude heat source, J. Geophys. Res., 101, 21 689–21 696, 1996.
Da Rosa, A. and Smith, F.: Behavior of the nighttime ionosphere, J. Geophys. Res., 72, 1829–1836, 1967.
Evans, J. V.: Cause of the midlatitude winter night increase in
foF2, J. Geophys. Res., 70, 4331–4345, 1965.
Evans, J. V.: Mid-latitude F-region densities and temperatures at sunspot minimum, Planet. Space Sci., 15, 1387–1405, 1967. Evans, J. V.: Millstone Hill Thomson scatter results for 1969,
Lin-coln Lab. Tech. Rep. 513, Lexington, MA, 1974.
Evans, J. V. and Holt, J. M.: Millstone Hill Thomson scatter results for 1972, Lincoln Lab. Tech. Rep. 530, Lexington, MA, 1978. Garner, T. W., Richards, P. G., and Comfort, R. H.: Anomalous
nighttime electron temperature events over Millstone Hill, J. Geophys. Res., 99, 11 411–11 416, 1994.
Hedin, A. E.: MSIS-86 thermospheric model, J. Geophys. Res., 92, 4649–4662, 1987.
Horwitz, J. L., Comfort, R. H., Richards, P. G., Chandler, M. O., Chappel, C. R., Anderson, P., Hanson, W. B., and Brace, L. H.: Plasmasphere-ionosphere coupling. 2. Ion composition measure-ments at plasmaspheric and ionospheric altitudes and compar-ison with modeling results, J. Geophys. Res., 95, 7949–7959, 1990.
Khazanov, G. V., Nagy, A. F., Gombosi, T. I., Koen, M. A., and Cariglia, S. J.: Analytic description of the electron tempera-ture behavior in the upper ionosphere and plasmashere, Geophys. Res. Lett., 19, 1915, 1992.
Pavlov, A. V.: The role of vibrationally excited nitrogen in the
for-mation of the mid-latitude ionospheric storms, Ann. Geophysi-cae, 12, 554–564, 1994.
Pavlov, A. V.: Mechanisms of the electron density depletion in the SAR arc region, Ann. Geophysicae 14, 211–221, 1996. Pavlov, A. V.: Subauroral red arcs as a conjugate phenomenon:
comparison of OV1-10 satellite data with numerical calculations, Ann. Geophysicae, 15, 984–998, 1997.
Pavlov, A. V., Buonsanto, M. J., Schlesier, A. C., and Richards, P. G.: Comparison of models and data at Millstone Hill during the 5–11 June, 1991, storm, J. Atmosph. Terr. Phys., 61, 263–279, 1999.
Pavlov, A. V. and Oyama, K.-I.: The role of vibrationally excited nitrogen and oxygen in the ionosphere over Millstone Hill during 16–23 March 1990, Ann. Geophysicae, 18, 957–966, 2000. Pavlov, A. V., Abe, T., and Oyama, K.-I.: Comparison of the
mea-sured and modeled electron densities and temperatures in the ionosphere and plasmasphere during 20–30 January 1993, Ann. Geophysicae, 18, 1257–1272, 2000.
Pavlov, A. V., Abe, T., and Oyama, K.-I.: Comparison of the mea-sured and modeled electron densities and temperatures in the ionosphere and plasmasphere during the period of 25–29 June 1990, J. Atmosph. Terr. Phys., 63, 605–616, 2001.
Pavlov, A. V. and Foster, J. C.: Model/data comparison of F-region ionospheric perturbation over Millstone Hill during the severe geomagnetic storm of 15–16 July 2000, J. Geophys. Res., 105, 29 051–29 070, 2001.
Rao, M. N., Raj, P. E., and Jogulu, C.: A study of the post-sunset increase in the F2-region electron density at low- and middle lat-itudes in the Asian zone during sunspot maximum and minimum periods, Ann. Geophysicae, 38, 357–365, 1982.
Richards, P. G., Buonsanto, M. J., Reinisch, B. W., Holt, J., Fen-nelly, J. A., Scali, J. L., Comfort, R. H., Germany, G. A., Spann, J., Brittnacher, M., and Fok, M.-C.: On the relative importance of convection and temperature to the behavior of the ionosphere in North America during January 6–12, 1997, J. Geophys. Res., 105, 12 763–12 776, 2000.
Richards, P. G. and Khazanov, G. W.: On the thermal electron en-ergy balance in the ionosphere in January 1993 and June 1990, J. Geophys. Res., 102, 7369–7377, 1997.
Richmond, A. D. and Lu, G.: Upper-atmospheric effects of mag-netic storms: a brief tutorial, J. Atmosph. Terr. Phys., 62, 1115– 1127, 2000.
Santani, S. and Breig, E. L.: Winter nighttime ion temperatures and energetic electrons from OGO 6 plasma measurements, J. Geophys. Res., 86, 3595–3609, 1981.
Spitzer, L. and Harm, R.: Transport phenomena in a completely ionized gas, Phys. Rev. 89, 977–981, 1953.