HAL Id: inserm-00165072
https://www.hal.inserm.fr/inserm-00165072
Submitted on 30 Aug 2007
HAL is a multi-disciplinary open access
archive for the deposit and dissemination of
sci-entific research documents, whether they are
pub-lished or not. The documents may come from
teaching and research institutions in France or
abroad, or from public or private research centers.
L’archive ouverte pluridisciplinaire HAL, est
destinée au dépôt et à la diffusion de documents
scientifiques de niveau recherche, publiés ou non,
émanant des établissements d’enseignement et de
recherche français ou étrangers, des laboratoires
publics ou privés.
in mice impairs spatial memory and leads to ventricular
enlargement and dendritic spine immaturity.
Malik Khelfaoui, Cecile Denis, Elly van Galen, Frédéric de Bock, Alain
Schmitt, Christophe Houbron, Elyse Morice, Bruno Giros, Ger Ramakers,
Laurent Fagni, et al.
To cite this version:
Malik Khelfaoui, Cecile Denis, Elly van Galen, Frédéric de Bock, Alain Schmitt, et al.. Loss of X-linked
mental retardation gene oligophrenin1 in mice impairs spatial memory and leads to ventricular
enlarge-ment and dendritic spine immaturity.: Phenotypic characterization of ophn1 knockout mice. Journal
of Neuroscience, Society for Neuroscience, 2007, 27 (35), pp.9439-50.
�10.1523/JNEUROSCI.2029-07.2007�. �inserm-00165072�
Development/Plasticity/Repair
Loss of X-Linked Mental Retardation Gene Oligophrenin1 in
Mice Impairs Spatial Memory and Leads to Ventricular
Enlargement and Dendritic Spine Immaturity
Malik Khelfaoui,
1,2Ce´cile Denis,
3Elly van Galen,
4Fre´de´ric de Bock,
5,6Alain Schmitt,
1,2Christophe Houbron,
1,2Elise Morice,
3Bruno Giros,
3Ger Ramakers,
4Laurent Fagni,
5,6Jamel Chelly,
1,2Marika Nosten-Bertrand,
3and
Pierre Billuart
1,21Department of Genetic and Development, Institut Cochin, Universite´ Paris Descartes, Centre National de la Recherche Scientifique (CNRS) [Unite´ Mixte de
Recherche (UMR) 8104], F-75014 Paris, France,2Inserm, U567, F-75014 Paris, France,3Inserm, U513, Neurobiology and Psychiatry, F-94010 Cre´teil,
France,4Netherlands Institute for Neurosciences, Neurons, and Networks, 1105 AZ Amsterdam, The Netherlands,5Department of Neurobiology, Institut de
Genomique Fonctionnelle, Universite´ Montpellier 1 et 2, CNRS (UMR 5203), F-34094 Montpellier, France, and6Inserm, U661, F-34094 Montpellier, France
Loss of oligophrenin1 (OPHN1) function in human causes X-linked mental retardation associated with cerebellar hypoplasia and, in
some cases, with lateral ventricle enlargement.
In vitro studies showed that ophn1 regulates dendritic spine through the control of Rho
GTPases, but its
in vivo function remains unknown. We generated a mouse model of ophn1 deficiency and showed that it mimics the
ventricles enlargement without affecting the cerebellum morphoanatomy. The ophn1 knock-out mice exhibit behavioral defects in
spatial memory together with impairment in social behavior, lateralization, and hyperactivity. Long-term potentiation and
mGluR-dependant long-term depression are normal in the CA1 hippocampal area of ophn1 mutant, whereas paired-pulse facilitation is reduced.
This altered short-term plasticity that reflects changes in the release of neurotransmitters from the presynaptic processes is associated
with normal synaptic density together with a reduction in mature dendritic spines. In culture, inactivation of ophn1 function increases
the density and proportion of immature spines. Using a conditional model of loss of ophn1 function, we confirmed this immaturity defect
and showed that ophn1 is required at all the stages of the development. These studies show that, depending of the context, ophn1 controls
the maturation of dendritic spines either by maintaining the density of mature spines or by limiting the extension of new filopodia.
Altogether, these observations indicate that cognitive impairment related to OPHN1 loss of function is associated with both presynaptic
and postsynaptic alterations.
Key words: X-linked mental retardation; ophn1 knock-out; dendritic spines; brain ventricular enlargement; hippocampal plasticity;
learning and memory
Introduction
Mental retardation (MR) is defined by an overall reduction in
cognitive abilities, which manifests before the age of 18 years old.
The underlying causes of MR are extremely heterogeneous with
environmental factors as well as established genetic causes, many
of which are X-chromosome-linked conditions (XLMR) (Chelly
et al., 2006). Among the XLMR-reported genes, at least four
en-code proteins directly linked to Rho GTPase-dependant signaling
pathways: FMRP, an effector of Rac that is absent in patients with
Fragile X syndrome (Oberle et al., 1991; Schenck et al., 2003);
oligophrenin1 (OPHN1), a RhoGAP protein with a deficiency
that leads to MR associated with cerebellar hypoplasia and lateral
ventricle enlargement (Billuart et al., 1998; Fauchereau et al.,
2003; Zanni et al., 2005); and PAK3 (p21-activated kinase) and
␣PIX, an effector and an activator of Rac and Cdc42 GTPases,
respectively (Allen et al., 1998; Kutsche et al., 2000). Based on the
well described function of Rho GTPases on neuronal
morphol-ogy and function (Luo, 2000), mutation in one of these genes
would disrupt neuronal connectivity and/or impair information
processing leading to MR (van Galen and Ramakers, 2005). This
hypothesis is reinforced by the observation of abnormal dendritic
spines and synaptic activity in some patients with MR (Purpura,
1979).
The OPHN1 is a RhoGAP protein, and its central GAP
do-main inhibits RhoA, Rac1, and Cdc42 without any specificity
Received Oct. 27, 2006; revised June 25, 2007; accepted July 17, 2007.
This work was supported by Agence Nationale pour la Recherche Grant ANR-05-NEUR-040-01, European Grant (Euro-MRX) QLG3-CT-2002-01810, and Fondation Jeroˆme-Lejeune. We thank D. Metzger for providing us with the plox2hygro plasmid, M. Hoezenberger for mouse transgenic lines expressing Cre recombinase, and The Genethon (Evry, France) for the adenovirus expressing the fusion protein GFP-Cre. This work had the support from local facilities, especially the animal and the homologous recombination platforms. M. C. Vinet and L. Castelnau partici-pated, respectively, in the ES cell screening and in the histological analyses. Finally, we acknowledge C. Betancur (Inserm, U513, Neurobiology and Psychiatry, Creteil, France) and C. Sala (CNR Institute of Neuroscience, Milan, Italy) for critical reading, S. Marty (Ecole Normale Supe´rieur, Paris, France) for numerous advice on electronic microscopy, and Vincent des Portes (Service de Neurologie Pe´diatrique, Hoˆpital Debrousse, Hospices Civils de Lyon, Lyon, France) and Monica Zilbovicius (Inserm, U797, Orsay, France) for sharing results about positron emission tomography anal-yses in OPHN1 patients.
Correspondence should be addressed to Dr. Pierre Billuart, Department of Genetic and Development, Institut Cochin, 24 rue du Fabourg St. Jacques, F-75014, Paris, France. E-mail: billuart@cochin.inserm.fr.
DOI:10.1523/JNEUROSCI.2029-07.2007
(Fauchereau et al., 2003; Govek et al., 2004). Its N-terminal end
contains a BAR (Bin, amphiphysin, RSV) domain, which binds to
curved membranes, and a pleckstrin homology (PH) domain,
which should confer to OPHN1 some specificity to the
mem-brane binding through the interaction with phosphoinositides
(Peter et al., 2004). Furthermore, we showed that the OPHN1
N-terminal end inhibits the GAP activity through an as yet
un-known mechanism (Fauchereau et al., 2003). Oligophrenin 1
gene is ubiquitously expressed in the developing and adult brain,
and the protein is present both in neurons and glial cells where it
colocalizes with F-actin (Fauchereau et al., 2003). In mature
neu-rons, the protein is detected on both sides of the synapse,
suggest-ing that it may somehow participate to synaptic formation and/or
function (Fauchereau et al., 2003; Govek et al., 2004). Govek et al.
(2004) have recently found that the rat homologous of OPHN1
interacts with the postsynaptic protein Homer and that reduction
in its expression using RNA interference (RNAi) technology led
to shortening of the dendritic spine of hippocampal CA1 neurons
through inhibition of the RhoA signaling pathway. However, the
functional consequences on synaptic transmission have not been
investigated. To address its function in vivo, we generated a
mouse model deficient in ophn1 expression and report here its
characterization.
Materials and Methods
Generation of OPHN1 knock-out mice
Constitutive inactivation. A 10.5 kb EcoRI DNA fragment containing
ex-ons 8 –10 from the mouse ophn1 gene was isolated from a SV129 genomic library (RPCI21MPAC, clone identifications RPCIP711F03181Q2 and RPCIP711L0992Q2; RZPD, Berlin, Germany) and subcloned to con-struct a targeting vector. A pgk-hygromycin-resistant gene cassette flanked with LoxP sites was inserted into in the exon 9 at the SmaI position to allow positive selection of the homologous recombination event (see Fig. 1a). The designed strategy disrupts the open reading frame of the ophn1 gene by the insertion of 100 bp in the coding sequence of exon 9, which leads to a premature STOP codon after the BAR domain (amino acids 1–242) and before the PH and GAP domains (see Fig. 1a). After electroporation into embryonic stem (ES) cells isolated from SV129/Pas males and selection of⬃200 hygromycin-resistant clones, we detected the homologous recombination event in 11 clones by a combi-nation of PCR and Southern blot analysis (Sambrook et al., 1989). Two of them were used to produce chimeric mice by aggregation into a C57BL/6 blastocyst. The male chimeras were crossed to C57BL/6 females from a transgenic line expressing the Cre recombinase early in development to generate N1 heterozygous females with a “cleaned” mutant allele deleted of the pgk-hygromycin-resistant gene cassette (Holzenberger et al., 2000). The residual 100 bp sequence consists of one remaining LoxP site after excision by the Cre recombinase plus adjacent polylinker sequences from the targeting vector. The genotype of the mice was determined by PCR analysis using SmaI flanking primers (5⬘KOF gcc cat gtt gtg agc aga gaa atc and 3⬘KOR gga agc tag agg atg acc ctg). The N1 animals were backcrossed for at least eight generations (N8) with the C57BL/6 (B6) inbred strain to derive the B6-ophn1 strain that was used in this study.
Conditional inactivation. The strategy used the well known Cre/LoxP
system to generate mosaic animals in which mutated cells expressed a positive marker. To this aim, we have generated a new ophn1 allele using the ES cell homologous recombination technology (see Fig. 5f ). The first coding exon of the ophn1 gene has been deleted and replaced by a LoxP-flanked (“floxed”) cassette. This deletion/insertion causes the simulta-neous disruption of the endogenous gene and its rescue by the cassette, which contains the ophn1 cDNA. The cassette also contains the cDNA of a marker in the opposite direction relative to the transcription. In the absence of active Cre, ophn1 is expressed under its own promoter, and the marker is not expressed. During induction of Cre activity in specific cells, the enzyme catalyzes an inversion of all sequences between the mutated LoxP sites (Arakawa et al., 2001). This inversion leads both to the functional inactivation of ophn1 and to the activation of the marker
under the control of the endogenous promoter. Details about the target-ing vector will be provided under request. Similar techniques as above were used to generate mice with the floxed cassette inserted into the first intron of the ophn1 gene. We tested both in vitro and in vivo this strategy and found that we were able to inactive ophn1 gene during Cre induction; however, we were not able to detect the positive marker for an unknown reason. Anyway, the model is still useable for conditional inactivation of ophn1.
Animals
Animals were weaned at 4 weeks and housed two to four per cage by sex and litter regardless of the genotype under standard conditions, with food and water available ad libitum. Experiments were performed in accordance with the European Communities Council Directive (86/809/ EEC) regarding the care and use of animals for experimental procedures and were approved by the local ethical committee.
Western blot experiment
Total protein lysates of ophn1⫹/yand ophn1⫺/ymice from whole brain or liver were extracted with Laemmli buffer (Bio-Rad, Hercules, CA) and run on a 10% SDS-PAGE according to standard procedures (Sambrook et al., 1989). For Western blot detections, rabbit polyclonal antibodies against ophn1 (Fauchereau et al., 2003) were used at 1:1000 dilution, and monoclonal anti-actin antibodies (1:2500, clone C4; Chemicon, Te-mecula, CA) were used as a loading control for immunoblotting using ECL procedures (Amersham Biosciences, Little Chalfont, UK).
Biochemical measurements of Rac1 GTPase activity
Protein lysates from hippocampus (1-week-old or adult males, n⫽ 3) were used in conventional glutathione S-transferase pull-down experi-ments using binding domains of Rac1/Cdc42 effector PAK1 as described previously (Ren and Schwartz, 2000; Benard and Bokoch, 2002). The Rac1 antibody clone 102 (BD Transduction Laboratories, Franklin Lakes, NJ) was used at 1:1000 dilution.
Measurement of brain and ventricle volumes
Deeply anesthetized mice (10 males of each genotype; age, 8 –9 months) were perfused transcardiacally with 4% paraformaldehyde (PFA) and 0.5% glutaraldehyde in 0.12Mphosphate buffer at pH 7.4. Brains were postfixed overnight and washed twice in phosphate buffer. Thick coronal sections (100m) were cut with a Vibratome (Leica, Nussloch, Ger-many) in phosphate buffer, and six series of floating slices were isolated corresponding to the whole brain. Two series spaced by 200m were stained with cresyl violet and mounted on glass slides using immuno-mount (Thermo Shandon, Pittsburgh, PA). Pictures of each slice were immediately captured with a digital camera (Coolpix990; Nikon, Tokyo, Japan) connected to a binocular lens (Nikon SMZ1000). We calculated mouse brain and ventricle volumes from the two series of sections using pixel counting and Cavalieri’s rule: Vc⫽ d(sum yi)⫺ (t)ymax, where yiis the cross-sectional area of one section, t is the section thickness, d is the distance between the sections, and ymaxis the maximun y value (Rosen and Harry, 1990). After proper calibration, the cross-sectional area of each section was measured by determining the number of pixels in each structure (lateral ventricles and brain sections from bregma position 3.08 to⫺4.84 mm) using Adobe Photoshop software (Adobe Systems, San Jose, CA). Dilatation was estimated by calculating the ventricle-to-brain ratio of volume. We calculated the mean, SE, and confidence interval (␣ ⫽ 0.05) for both genotypes. Ventricular dilatation was defined as a ratio⬎4.6% (Zygourakis and Rosen, 2003). The volumes of the brains, measured before slicing, were not different between the two genotypes. The linear shrinkage caused by the fixation process was 33%. The depen-dence between the genotype and the dilatation of the ventricles was tested with the corrected2test (Statview software; Abacus Concepts, Berkeley,
CA).
Golgi-Cox impregnation
Brains of 12-week-old adult ophn1⫺/y(n⫽ 9) and ophn1⫹/ylittermates (n⫽ 10) were immersed for 21 d in Golgi-Cox solution (1% potassium dichromate, 1% mercuric chloride, and 0.8% potassium chromate in Milli-Q water) (Glaser and Van der Loos, 1981). Subsequently, the brains
were rinsed four times in Milli-Q water, dehydrated, and embedded in celloidin. Coronal sections (200m) were cut using a sledge-microtome. After every fifth section, four 50m sections were cut for Nissl staining. The Golgi-Cox staining was developed by incubation in 16% ammonia for 30 min and fixed in 1% sodium thiosulphate for 7 min. The 50m sections were counterstained with 0.5% cresyl violet. Sections were de-hydrated and embedded in Histomount (National Diagnostics, Atlanta, GA).
Dendritic reconstruction of Golgi impregnated sections
Slides were coded to assure blind recording and reconstruction of the neurons. Decoding was performed during statistical analysis. For record-ing of pyramidal neurons, we used sections in which the apical dendrite was parallel to the cutting plane. Pyramidal neurons were randomly se-lected at low magnification, where spines were hardly visible. Neurons were recorded from the middle of the sections in three-dimensional im-age stacks using an Axioplan2 microscope (Zeiss, Oberkochen, Ger-many) with a 40⫻ air objective (Plan-apochromat; Zeiss) and a digital black-and-white EvolutionQEi camera. Approximately five randomly selected neurons were recorded per animal and manually reconstructed with the ImagePro Plus 5 application Neurodraw. This program stores the three-dimensional coordinates of all structures of the neuron as well as the type of structure (soma outline, apical or basal dendrite, branch points, thick or thin filopodia or spines, etc.). Dendritic protrusions (spines and filopodia) were reconstructed along separate 20m stretches at 90 –110 and 190 –210m from the soma along apical dendrites and at 40 – 60m from the soma along one of the basal dendrites (the first basal dendrite that was encountered when moving in a counterclockwise man-ner from the apical dendrite, again to prevent selection bias). Protrusions were classified as spines if they contained a clear distal thickening (head) and a thinner proximal neck. Otherwise, they were classified as filopodia. In addition, protrusions were distinguished as having either thin (barely visible) or thick (clearly visible) necks. Consequently, thick spines also had relatively big spine heads. As could be expected in adult mice, the majority of protrusions were thick spines. Next came thick filopodia. Very few thin protrusions were observed. After reconstruction, the Neu-rodraw program calculated the following parameters: surface area of the soma; number of dendrites per cell; and for both apical and basal den-drites, total dendrite length, number of branch points, terminal segment length, and intermediate segment length. In addition, the number and length of thin and thick filopodia and spines were calculated. Statistical analysis was performed in SPSS11 (SPSS, Chicago, IL). Because most parameters were not normally distributed, the nonparametric Mann– Whitney U test was used to test for significance.
Electronic microscopy analysis
Three mice of each genotype (age, 6 – 8 months) were deeply anesthetized with phenobarbital and perfused transcardially with 1% parafolmarde-hyde and 1% glutaraldeparafolmarde-hyde in 0.1Mphosphate buffer at pH 7.4. Their brains were removed and immersed overnight in the fixative solution. Thick coronal sections (150m) were cut with a vibratome in phosphate buffer, and sections at position bregma⫺2.70 were trimmed to produce a pyramidal block of tissue (1 mm wide) extending across the CA1 region of hippocampus. Blocks were postfixed in 1% osmide tetroxide. Tissues were rinsed, stained en bloc overnight in 1% uranyl acetate, rinsed and dehydrated, and subsequently infiltrated and flat embedded with Embed 812 resin. Semifine sections (0.5m) were cut and stained with toluidine blue. Ultrathin sections (⬃0.08m) were cut with a diamond knife, placed on carbon Formvar-coated slot grids, and stained with 1% uranyl acetate and lead citrate. Neuronal volume densities were estimated using the unfolding method as described previously (Miki et al., 1997; Kurt et al., 2004). Briefly, adjacent pictures of semifine sections were captured along the neuronal cell layer under a Nikon light microscope with a DXM1200 Nikon digital camera. A counting frame of known area (56⫻ 56m) was created using ImageJ software (public domain), and neuro-nal cell bodies as well as perimeters of nucleus were counted from six adjacent frames using the unbiased counting rule. The volume densities of neurons (NVn) were estimated using the following formula: NVn⫽
Nan/(Dn⫹ t), where Nanis the number of neurons per unit area, Dnis the
mean nuclear diameter estimated from the perimeter assuming a spher-oid shape of the nucleus, and t is the section thickness. For synaptic densities, ultrafine sections were analyzed under a transmission electron microscope (Philips CM10; FEI, Lyon, France) at 60 kV (5500⫻ magni-fication), and synapses with identifiable apposition zones and a presyn-aptic button containing synpresyn-aptic vesicles were counted within the stra-tum radiastra-tum, 200m from the pyramidale cell layer. For each animal, we counted at least 500 synapses over a total surface between 4000 and 8000m2.
Primary culture and immunostaining
Cultured hippocampal neurons were prepared and maintained in Neu-robasal B27-supplemented medium (Invitrogen, San Diego, CA) accord-ing to a procedure recommended by Amaxa (Gaithersburg, MD). Briefly, cell suspensions were plated at a density of 5000 cells/cm2on coverslips
coated with poly-D-lysine. Five days after plating, neurons were treated with 10Mcytabarine to inhibit glial proliferation, and the medium was changed once per week with glial-conditioned Neurobasal/B27 medium until fixation. Cells were fixed with either 100% methanol at⫺20°C for 10 min or with 4% PFA in PBS at room temperature for 20 min. Fixed cells were permeabilized once in PBS with 0.1% Triton X-100, rinsed three times in PBS, blocked for at least 1 h in PBS plus 3% bovine serum albumin, and incubated with the appropriate primary and secondary antibodies. For filamentous actin (F-actin) labeling, 4% PFA-fixed neu-rons were stained for 1 h with 1g/ml Texas Red-conjugated phalloidin (Invitrogen, Cergy Pontoise Cedex, France). The following antibodies were used:-tubulin III (Tuj1) and mitogen-activated protein 2 (MAP2; Sigma, Lyon, France) and rabbit anti-OPHN1 (Fauchereau et al., 2003). Cortical neurons obtained from conditional knock-out animals were cultured as described above. Ophn1 inactivation was induced by the Cre recombinase using an adenoviral vector of expression. For adenovirus infection, culture medium was saved and replaced with fresh neurobasal medium. Cre-enhanced green fluorescent protein (EGFP)-expressing adenovirus (50 pfu per cell) was added to the cultures for 3 h. Afterward, virus-containing medium was removed and replaced by previously saved culture medium. Some neurons were exposed to adenoviral vector 2 d after plating [2 d in vitro (2 div) Cre] and others after 18 div (18 div Cre). Control neurons remain noninfected (no Cre). In addition, we infected cortical neurons from ophn1⫹/ymice with Cre-expressing adenovirus and found that the virus infection and the Cre expression have no effect on dendritic spines (data not shown). All the cultures were fixed at 22 div in 4% PFA, and neurons were counterstained with F-actin. Positive cells expressing Cre-GFP recombinase were analyzed by fluorescence micros-copy and compared with noninfected cells. For quantification, at least 15 GFP-neuronal cells were analyzed and classified as mature or immature depending of their filopodia and dendritic spine content.
Electrophysiology
Acute transverse hippocampal slices were prepared from 6-week-old ophn1⫹/yand ophn1⫺/ymice. Animals were killed by decapitation, and brains were quickly removed and chilled in ice-cold sucrose [artificial CSF (ACSF)] (in mM: 246 sucrose, 26 NaHCO3, 1.25 KH2PO4, 2 KCl, 2
CaCl2, 2 MgSO4, and 10 glucose, pH 7.4). Horizontal sections (400m)
were cut with a vibratome while the brain was submerged in cold sucrose ACSF, bubbled with 95% O2/5% CO2. Slices were kept at room
temper-ature in a holding chamber filled with continuously oxygenated normal ACSF (in mM: 124 NaCl, 26 NaHCO3, 1.25 KH2PO4, 3 KCl, 2.5 CaCl2, 1.5
MgSO4, 10 glucose, and 4 saccharose, pH 7.4).
Experiments were performed at least 2 h after slice preparation. Slices were transferred to a submersion recording chamber, maintained at 30°C, and perfused with oxygenated normal ACSF at a rate of 1.5 ml/min. The CA3 area was excised. Dendritic field potentials [field EPSPs (fEP-SPs)] of no less than 5 mV were evoked in the CA1 region by electrical bipolar stimulations (0 –5 V, 20s every 60 s) of Schaffer-commissural afferents using a twisted nickel– chromium wire. The signal was ampli-fied, filtered (1 Hz, 1 kHz), and digitized. Long-term potentiation (LTP) was induced by applying 10 tetanic stimulations of 100 ms duration and 100 Hz frequency, repeated every 3 s. Long-term depression (LTD) was induced by application of the group I metabotropic glutamate receptor
(mGluR) agonist (RS)-3,5-dihydroxyphenylglycine (DHPG; 100M). After stabilization of fEPSPs, the initial slope of the response was mea-sured and expressed as the percentage of the mean value obtained before the tetanic stimulation or drug. Data were plotted as a function of time. Paired-pulse facilitation of fEPSPs was studied using stimulations of the same intensity and separated by increasing periods of time ranging from 50 to 1000 ms. The ratio of the slope of the second response was then expressed as a percentage of the slope of the first response. The values of the plots represent the mean (⫾SEM) of the indicated number of exper-iments. Statistical analyses were performed using Student’s t test.
Behavioral analyses
To ensure that ophn1 knock-out mice did not exhibit severe neurological deficits, which would potentially interfere with subsequent exploratory-, anxiety-, social-, and cognitive-related behaviors, the B6-ophn1 strain was initially evaluated on a classic neurological screen (Crawley and Pay-lor, 1997). Only male mice (ophn1⫹/yand ophn1⫺/y) were used in this study. All behavioral tests, except for lateralization, were performed on independent groups of naive animals tested in a sound-attenuated room under controlled illumination and by trained observers blind to the ge-notype. Lateralization tests were always performed last on non-naive animals for any other behavioral tests.
Exploration tests
Locomotor activity. The horizontal (locomotion) and vertical (rearing)
activities of ophn1⫹/y(n⫽ 18) and ophn1⫺/y(n⫽ 19) adult males were individually assessed for 2 consecutive hours in transparent activity cages (20⫻ 15 ⫻ 25 cm), with automatic monitoring of photocell beam breaks (Imetronic, Bordeaux, France).
Open-field test. The open-field test, like the light– dark box and the
elevated O-maze, is based on the conflict between the tendency of mice to explore a novel environment and their inhibition to face aversive bright, open areas. Total activity and anxiety-related responses were assessed by comparing the time, the distance, and the number of transitions between the protected and the unprotected areas and the latency to exit the pro-tected area.
Individual activity of ophn1⫹/y(n⫽ 10) and ophn1⫺/y(n⫽ 10) adult males in the open-field environment (108⫻ 108 cm area brightly illu-minated, 250 lux at the periphery and 700 lux at the center) was video-tracked and automatically monitored every 3 min for 9 consecutive min-utes (View Point, Lyon, France).
Light– dark box. The apparatus is a polyvinyl chloride box divided by
an open door into a white illuminated open area and a dark black en-closed area. Male mice (n⫽ 11 ophn1⫹/yand n⫽ 9 ophn1⫺/y) were released into the enclosed area and observed for 9 consecutive minutes.
Elevated O-maze test. The O-maze (outer diameter, 46 cm) consisted
of a 7-cm-wide annular runway divided into two open and two wall-enclosed areas of equal size. Male mice (n⫽ 22 ophn1⫹/yand n⫽ 22 ophn1⫺/y) were released in one of the protected areas, and their activity was automatically recorded every 3 min for 9 consecutive minutes (View Point).
Y-maze. The Y-maze is made of dark plastic and consists of three
identical arms diverging at a 120° angle from the center. Each arm is 15 cm long, 5 cm wide, and 15 cm high and is equipped with two pairs of infrared beams allowing the position of the animal to be detected and its amount of horizontal activity to be automatically recorded (Imetronic). Male mice (n⫽ 10 ophn1⫹/yand n⫽ 10 ophn1⫺/y) were introduced into one arm, their head was oriented in the opposite direction to the center of the maze, and they were allowed to explore freely all three arms over a 10 min period, under dim illumination (30 lux).
Social interactions
Resident–intruder test. ophn1⫹/yand ophn1⫺/ymale mice (n⫽ 17 per genotype) were housed individually for 10 d before the test and used as residents. C3H naive male mice, housed in groups of four, were used as intruders. After transfer of the intruder to the home cage of the resident, the cumulative duration of aggressive (biting attacks and tail rattling) and social (sniffing head or back/sex) behaviors was recorded over a 10 min period.
Social memory. Twenty-four hours after the resident–intruder tests,
isolated males were tested for female recognition. C57BL/6 females were group housed in a large home cage for 10 d before the test. A stimulus female was introduced into the home cage of the resident male for 1 min. After each trial, the female was removed and kept in an individual hold-ing cage for a 10 min intertrial interval, before behold-ing introduced again in the same resident male for a total of four consecutive trials. In a fifth “dishabituation” trial, each resident was exposed to a new female of the B6xD2F1genetic background. Two trained raters recorded
simulta-neously the number and duration of contact and olfactory sex investigations.
Morris water maze
The water maze consists of a circular stainless steel pool (150 cm diam-eter, 29 cm height) filled to a depth of 16 cm with water maintained at 20 –22°C and made opaque using a white aqueous emulsion (Acusol OP 301 opacifier; Rohm Ihaas, Paris, France). The escape platform, made of rough stainless steel, was submerged 1 cm below the water surface. A video tracking system, which included an overhead camera connected to an image analyzer and a computer (View Point), was used to monitor activity. During the training, mice (n⫽ 10 males per genotype) learned the fixed position of a small hidden platform (6 cm diameter), using prominent distal extra-maze cues arranged in the room around the pool. Each trial started with mice facing the interior wall of the pool and ended when they climbed onto the platform or after a maximum searching time of 90 s. Animals that did not find the platform were gently guided and placed on it for 20 s. Animals received one habituation trial on the first day and then two trials per day for 10 consecutive days. On the last day, mice were given one training trial before the 60 s probe test in which the platform was removed. The probe test started from the quadrant oppo-site to the one that originally contained the platform. The distance (per-centage) traveled in each quadrant and the number of times the animal crossed each of the four possible platform sites (annulus) were automat-ically calculated by the video tracking system. Animals were then tested in the cued version as described previously (Morice et al., 2007). Three independent water maze experiments were conducted on naive animals with n⫽ 11–20 males per genotype and per experiment. Animals that exhibited continual floating or thigmotaxic behavior could not be tested for their spatial and cued learning and were thus eliminated for statistical analysis.
Paw preference test
Adult mice (5–7 months old; n⫽ 25 males per genotype) were tested for behavioral lateralization as described previously (Morice et al., 2005). Mice were observed individually for a total of 50 consecutive reaches for food. The direction of lateralization was expressed by the number of right paw entries (RPEs), with right-handed mice having an RPE score higher than 25 and left-handed mice having an RPE score lower than 25 (Col-lins, 1991). Scores for the degree of handedness were given by the abso-lute value of the difference between the number of entries with right and left paws noted兩R-L兩. Because 50 reaches for food were observed per mouse, the兩R-L兩 variable is limited to even values between 0 and 50. Animals with兩R-L兩 scores between 46 and 50 are defined as strongly lateralized (high), whereas ambidextrous (low) individuals have兩R-L兩 scoresⱕ44.
Statistical analysis
Repeated-measures ANOVA was performed to assess the interaction be-tween genotype (bebe-tween factor) and time (within factor). Significant main effects were analyzed further by post hoc comparisons of means using the Newman–Keuls test. Distributions for survival were compared by a Fisher’s exact test for small sample sizes. When values did not follow a normal distribution, statistical analyses were performed using non-parametric tests (StatView software; Abacus). Multisample tests were done using the Kruskal–Wallis test. The Mann–Whitney rank sum test was used to compare quantitative variables between two groups. Propor-tions were compared using the2test. Only significant statistical tests are
Results
Generation of OPHN1 knock-out mouse
OPHN1 mutations in humans are either non-sense or frameshift
deletions predicted to lead to a complete protein loss of function
(Billuart et al., 1998; Zanni et al., 2005); therefore, we generated a
knock-out mouse deficient in ophn1 to mimic the human
pa-thology (Fig. 1a). Because the mouse ophn1 gene is also located
on the X chromosome, only male ophn1 knock-out (ophn1
⫺/y)
and their wild-type littermates (ophn1
⫹/y) were used in this
study. As shown in Figure 1b, we did not detect the full-length
ophn1 protein (91 kDa) or a putative truncated protein (data not
shown) using total brain and liver protein extracts from
ophn1
⫺/yand ophn1
⫹/ymice. We indeed generated a null allele
of mouse ophn1 gene and backcrossed the mutation to the
C57BL/6 (B6) strain for eight generations (N8) to derive the
B6-ophn1 strain that was used in the present study. The B6-ophn1
⫺/ymice were viable (no prenatal lethality) and fertile with normal
body weight. However, premature death was observed in 20% of
knock-out males between weaning and 6 months of age from an
unknown reason.
Behavioral, social, and cognitive impairments in ophn1
ⴚ/yWe assessed locomotor, exploratory, and emotional behaviors in
the actimeter, the open field, the dark–light box, and the O- and
Y-mazes. Interestingly, we observed that in all these tests,
ophn1
⫺/yexhibited higher levels of activity compared with
ophn1
⫹/y(Fig. 2a). This hyperactivity appeared to be novelty
driven because in the actimeter environment, it decreased with
habituation after 20 min (data not shown). No difference was
observed between mutant males and their wild-type littermates
in any anxiety-related variables as tested in the elevated O-maze
and the light– dark box (supplemental Table 1, available at www.
jneurosci.org as supplemental material). However, the mutant
males presented higher exploration scores in the center of the
open field compared with control animals, suggesting that they
were less anxious (F
(1,18)⫽ 5.3; p ⬍ 0.03). We also assessed
mus-cle strength and motor coordination in the rotarod and chimney
tests and found no significant differences between genotypes
(data not shown).
Next, we assessed aggressive behavior using the
resident–in-truder test. The total number of attacks was lower in ophn1
⫺/ybut not significantly different from the ophn1
⫹/y. Notably, only
18% of the ophn1
⫺/ymice attacked the intruder, compared with
47% of the ophn1
⫹/ymice. The behavior of the ophn1
⫺/yresi-dents with respect to the intruders was very different from that of
the ophn1
⫹/ymice. Whereas both genotypes exhibited the same
latency, number, and time to sniff the back of the intruder (data
not shown), ophn1
⫺/ysniffed the snout of the intruder more
often (F(1,31)
⫽ 9.96; p ⬍ 0.01) and for a longer time (F(1,28)
⫽
4.24; p
⬍ 0.05) compared with ophn1
⫹/y. Twenty-four hours
after the resident–intruder test, isolated resident males were
tested for olfaction and social interaction with female mice in the
social memory test. No differences were observed between
genotypes.
Because previous studies have shown abnormal handedness
and brain asymmetry among subjects with moderate to profound
MR (Morris and Romski, 1993; Grouios et al., 1999), we assessed
paw preference in mice using the Collins paradigm (Collins,
1985, 1991). There were as many right-handed as left-handed
subjects in the two genotypes (data not shown). However, the
proportion of strongly lateralized individuals significantly
dif-fered between genotypes. Among ophn1
⫹/ymice, 47% were
strongly lateralized (ⱖ48 same-paw food reaches) compared
with only 15% of the ophn1
⫺/ymice (
2⫽ 30.7; p ⬍ 0.0001).
Therefore, the ophn1
⫺/ymice were less lateralized than ophn1
⫹/ymice.
We next used the Morris water maze to study reference
learn-ing and memory. In the standard place-learnlearn-ing version, mice
learned the fixed position of a small hidden platform using distal
extra-maze cues. Wild-type and mutant mice did not differ in
their swim speed, but ophn1
⫺/yspent less time floating
com-pared with ophn1
⫹/y(genotype: F
(1,300)⫽ 10.3; p ⬍ 0.001). The
distance traveled to escape decreased during the training phase in
the two genotypes, indicating that learning had occurred (Fig.
2b). However, ophn1
⫺/yshowed hardly any improvement
com-pared with ophn1
⫹/yduring the acquisition trial (genotype:
9
Hygro
Insertion by homologous
recombination in ES cells
Cre/LoxP mediated
deletion of Hygro cassette
LoxP
LoxP
Hygro
100 bp insertion
-->frameshift mutation
a
ophn1
brain
liver
actin
+/y
-/y
+/y
-/y
1
GAP
802
b
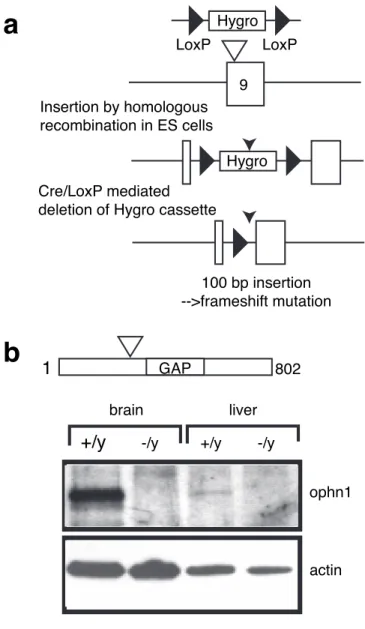
Figure 1. Ophn1 gene inactivation. a, Strategy of mouse ophn1 inactivation gene. The
strat-egy was designed to disrupt the open reading frame of the ophn1 gene by the insertion of 100 bp in the coding sequence of exon 9, which leads to the premature STOP codon after the BAR domain (amino acids 1–242) and before the PH and GAP domains. Exon 9 was targeted by homologous recombination leading to the insertion of a phosphoglycerolkinase-hygromycin-resistant gene cassette (Hygro) flanked with LoxP sites. The Cre recombinase catalyzed the deletion of sequences between LoxP sites and led to the removal of the selective cassette in the final ophn1-mutated allele. b, Western blot analysis of brain and liver lysates from ophn1⫹/y and ophn1⫺/yadult mice. Rabbit polyclonal antibodies recognizing both ends of ophn1 protein demonstrated the absence of full-length ophn1 protein (91 kDa) or truncated products (data not shown) in ophn1⫺/y. Anti-actin antibody was used as a loading control.
F
(1,300)⫽ 25.7, p ⬍ 0.0001; time: F(9,300)
⫽ 11.2, p ⬍ 0.001;
interaction: F
(1,300)⫽ 1.9, p ⱕ 0.05). Mutant mice also succeeded
in escaping on fewer trials compared with ophn1
⫹/y(
21df⫽
11.6; p
⬍ 0.01), suggesting that learning is impaired in ophn1
⫺/ymales. During the probe trial, when the platform was removed,
ophn1
⫹/yexhibited a strong preference for the target quadrant,
whereas ophn1
⫺/yswam an equal distance in all quadrants
(quadrant: F(3,120)
⫽ 9.65, p ⬍ 0.0001; interaction: F(3,120)
⫽ 12,
p
⬍ 0.0001) (Fig. 2c), further demonstrating the spatial learning
impairment in ophn1
⫺/ymice. In addition, ophn1
⫹/yand
ophn1
⫺/yadult males did not differ in the cued version of the
water maze test (data not show). Interestingly, 32% of all the
tested ophn1
⫺/ymice (n
⫽ 57) were eliminated from the analyses
for continual floating or thigmotaxic behavior compared with
only 8% of ophn1
⫹/y(n
⫽ 59;
2⫽ 9.74; p ⬍ 0.002).
General brain anatomy in ophn1
ⴚ/yWe undertook a systematic study of adult brain anatomy in 10
males of each genotype (age, 8 –9 months) using a combination
of anatomical/histological techniques. No difference in the size of
cerebellum was observed, and histological analysis revealed a
normal pattern of foliation in the ophn1
⫺/y(see below). Brain
sizes and weights were similar in the two genotypes, except in one
mutant (1 of 10) with hydrocephaly, enlargement of brain size,
and thin cortex (Fig. 3a,b). To explore further the susceptibility of
ophn1
⫺/ymice to hydrocephaly, we determined the
cerebroven-tricular volumes in each animal using histological analyses and
found that 70% of ophn1
⫺/ymice present a dilatation of lateral
and third ventricles (Fig. 3, compare c, d), whereas this phenotype
was detected in 10% of ophn1
⫹/ymice (corrected
2, p
⫽ 0.01).
No alteration in the communication between ventricles was
no-ticed. Next we determined the cerebroventricular volumes in
young males between 3 and 4 weeks old and found that 22% of
ophn1
⫺/y(n
⫽ 18) present mild dilatation of lateral ventricles
compared with 8% of ophn1
⫹/y(n
⫽ 12). Therefore, the
pheno-type at 1 month was less penetrant and severe than in adult
mu-tants, which suggests that the enlargement of ventricles was
al-ready present at weaning and that it worsened with age.
We next studied in more detail the brain histology at postnatal
day 17 and at 2 months of age. No significant difference was
noticed in the foliation of the cerebellum or in the lamination of
the cerebellar cortex in ophn1
⫺/ywith the typical alternation of
molecular, Purkinje, and granule cell layers (Fig. 3e,g). Structure
and thickness of the cerebral cortex and hippocampus were
nor-mal at least in nonseverely dilated ophn1
⫺/ybrains (Fig. 3f,h).
Several neuronal markers [MAP2, Tuj1, SNAP25 (25 kDa
synaptosomal-associated protein), VGLUT1 and VGLUT2
(ve-sicular glutamate transporter 1 and 2), glutamic acid
decarbox-ylase 67 (GAD67), GAD65, VIAAT (vesicular inhibitory amino
acid transporter)] were used and showed the same pattern of
staining between genotypes (data not shown). Altogether, no
sig-nificant difference could be observed at this level of analysis.
Neuroanatomy in ophn1
ⴚ/yCA1 hippocampus
Because ophn1 protein is highly concentrated in growth cones
and dendritic spines (supplemental Fig. S1, available at www.
jneurosci.org as supplemental material) and because we
hypoth-esized that MR linked to RhoGTPase pathways is associated with
alterations in structural neuronal connectivity (van Galen and
Ramakers, 2005), we analyzed the structural properties of CA1
pyramidal neurons, their dendrites, and their dendritic
protru-sions using the Golgi staining method (Fig. 4a,b). No significant
changes were observed in ophn1
⫺/yin total dendrite length per
neuron or in the mean length or number of branch points of
either apical or basal dendrites (data not shown). Thus, these
observations indicate little, if any, change in overall dendritic
structure in ophn1
⫺/ymice. However, ophn1
⫺/ymice showed a
a
Photocell
beam breaks
Actimetry
Y-Maze
Distance (m)
Open-field
O-Maze
0
0
0
0
10
20
30
40
50
60
70
80
90
*
20
40
60
80
100
120
140
*
10
20
30
40
50
60
70
80
90
*
10
12
14
16
2
4
6
8
*
ophn1-/y
ophn1+/y
0
10
20
30
40
50
D
ist
ance tra
velle
d
(%
)
T
O
R
L
60
T
R
L
O
c
b
1
2
3
4
5
6
7
8
9
10
4
6
8
10
12
14
16
18
Di
stance travelled (
m
)
Days
ophn1-/y
ophn1+/y
Figure 2. Behavioral characterization of ophn1⫺/y. a, Ophn1⫺/ymice show novelty-driven
hyperactivity as tested in the actimeter, the open field, and the O- and Y-mazes and measured as the number of photocell beam breaks (actimetry and Y-maze) or covered distance (open field and O-maze) during the first 10 min (actimetry and Y-maze) or 9 min (open field and Y-maze). Asterisks indicate statistical differences between means. b, Loss of ophn1 function leads to learning deficits in the Morris water maze: compared with controls (open circles), ophn1⫺/y mice (filled squares) traveled a longer distance to reach the platform. The difference is obvious after 7 d of training. c, The quadrant test shows the proportion of distance traveled in the four quadrants. This test confirms the impaired spatial memory in ophn1⫺/ymice. T, Target; O, opposite; R, right quadrant; L, left quadrant. Error bars indicate SEM.
significant decrease in the density of mushroom-shaped
den-dritic spines along apical dendrites (⫺31%; p ⬍ 0.01) (Fig. 4c)
and no alterations in filopodia density. No differences were seen
in the density of protrusions along basal dendrites (data not
shown). On apical dendrites, the length of protrusions was not
altered, but on basal dendrites, spines showed a 13% reduction in
length (data not shown). This decrease was not attributable to
changes in dendritic diameter, because neither apical and basal
dendrite thickness was altered in ophn1
⫺/ymice (data not
shown).
Because we observed a reduction in mature dendritic spines in
ophn1
⫺/y, we questioned whether the
syn-aptic density was accordingly reduced. We
undertook some electronic microscopy
analyses of three pairs of adult males of
each genotype in the corresponding CA1
region (200
m away from the nucleus
layer in the stratum radiatum). We found
that the density of excitatory synapses did
not significantly differ between genotypes
(ophn1
⫺/y,
14.8
⫾ 1.63/100
m
2;
ophn1
⫹/y, 14.6
⫾ 0.73/100
m
2) (Fig 4d).
Analyzes of semifine sections allow us to
determine the neuronal cell densities by
quantification of the pyramidal cell nuclei
present in the corresponding CA1 cell
layer. The neuronal density in ophn1
⫺/yanimals (9.8E5
⫾ 0.65/mm
3) tends to
in-crease compared with ophn1
⫹/y(8.0E5
⫾
0.36/mm
3), but the difference was not
sig-nificant (F(1,4)
⫽ 5.6; p ⫽ 0.077; n ⫽ 3) (Fig
4d). Altogether, the number of excitatory
synapse per neuron is about the same as
opposed to the reduction in dendritic
spine densities observed with Golgi studies
in the same CA1 region of ophn1
⫺/y. This
discrepancy supports the hypothesis that,
in ophn1
⫺/y, more synapses are directly
connected to the dendritic shaft than in
ophn1
⫹/y. Because this profile is rarely
en-countered in the adult brain (Harris et al.,
1992; Petrak et al., 2005), these results
sug-gest that loss of ophn1 function leads to
immaturity of dendritic spines in the adult
CA1
hippocampus
compared
with
ophn1
⫹/y.
In vitro differentiation of ophn1
ⴚ/yhippocampal and cortical neurons
To test whether this immaturity results
from abnormal development,
hippocam-pal pyramidal neurons were isolated from
embryos at 18.5 d postcoı¨tum and allowed
to differentiate at 22 d in vitro (div).
Anal-ysis of the dendritic arborization revealed
no significant differences between the two
genotypes (data not shown). The most
striking phenotype observed in culture
was a large increase in spine protrusions
from dendrites (Fig. 5a– c) (
⫹47% in
ophn1
⫺/ycompared with ophn1
⫹/yneu-rons; F
(1,51)⫽ 22.8; p ⬍ 0.0001). Next, we
discriminated between filopodia, stubby
spines, and mushroom-shaped spines. Whereas stubby spines
displayed similar densities, both filopodia (F(1,51)
⫽ 35.8; p ⬍
0.0001) and mature spine (F
(1,51)⫽ 5.5; p ⬍ 0.023) numbers were
clearly increased in neurons from mutants with a stronger effect
on filopodia (Fig. 5c). Analysis of the relative proportion of each
category of dendritic protrusions clearly showed that the
filopo-dia proportion was increased (F
(1,51)⫽ 8.6; p ⬍ 0.005) (Fig. 5d).
We also measured the length of dendritic protrusions in vitro and
found that loss of ophn1 function had only a small effect on
mature dendritic spines (ophn1
⫹/y, 2.12
⫾ 0.03
m vs ophn1
⫺/y,
2.06
⫾ 0.02
m; F(1,1129)
⫽ 3.1; p ⫽ 0.078) but significantly
ophn1+/y
ophn1-/y
a
b
d
c
e
f
g
h
Figure 3. Ophn1⫺/ymice develop ventricle enlargement but not cerebellar hypoplasia. a, b, In the most severe cases, ventricle
enlargement led to the formation of hydrocephalus. The resulting compression led to deformation of the skull and thinner cerebral cortex being almost transparent. Such a severe phenotype was found in 10% of ophn1⫺/ymice (b) and never in ophn1⫹/ymice (a) (n⫽20).Scalebar,0.5cm.c,d,Ophn1⫺/ymice (d) showed ventricle enlargement compared with ophn1⫹/ymice (c). Serial rostral to caudal coronal sections, stained with cresyl violet, from brains at 8 months are shown, with each pair of sections representing approximately the same coronal plane. The ventricle enlargement, apparent from rostral to caudal parts of the forebrain, is associated with thinning of the cerebral cortex. Note the similar appearance of the aqueduct of Sylvius and the fourth ventricle in the caudal sections, ruling out the possibility of a primary obstructive origin of the dilatation. Scale bar, 0.5 cm. e– h, Normal cerebellar and hippocampal histology in ophn1⫺/y. Cresyl violet staining of sagittal cryosections of the ophn1⫺/yand ophn1⫹/yshows no detectable abnormalities in the histology of the cerebellum (e, g) and hippocampus (f, h). Ophn1⫺/yshows no disruption of lamination in the hippocampus (h) and no defect in the cerebellar foliation (g) but presents some enlargement of lateral ventricles.
increased the length of filopodia (ophn1
⫹/y, 3.95
m vs
ophn1
⫺/y, 4.54; F(1,313)
⫽ 7.5; p ⬍ 0.007) (Fig. 5e). Furthermore,
we also analyzed the morphology of neurons before 22 div and
found that younger neurons also presented an increase in
filop-odia on dendritic shaft, indicating that this phenotype of
imma-turity results from abnormal development rather than a blockage
of synaptic transmission (data not shown).
We then used an in vitro conditional approach based on the
Cre/Lox system to test the differential role of ophn1 in the
mat-uration of dendritic spines according to the stage of the
develop-ment (Fig. 5f ). Neurons from the conditional model (floxed
al-lele) were infected with adenovirus expressing the Cre
recombinase fused to the EGFP marker at 2 and 18 div and left to
develop until 22 div (Fig. 5g). This allowed to temporally control
the ophn1 loss of function before and after spine maturation.
Ophn1 loss of function in young neurons (2 div Cre) mimicked
the previously described phenotype of ophn1
⫺/yneurons. A large
proportion of neurons presented an increase in immature
den-dritic protrusions (Fig. 5h–j), confirming that the previously
de-scribed phenotype was not an artifact. Infection of neurons at 18
div (18 div Cre) led to a shift in maturity with an increase in
filopodia-like protrusions (Fig. 5h–j), whereas the noninfected
neurons had a majority of mature dendritic spines at that time
(data not shown). In conclusion, whenever there was loss of
ophn1 function in culture, we observed the same immature
phe-notype with an excess of filopodia (Fig. 5h,i). This result showed
that the two alternative mechanisms (retraction of mature spines
or elongation of filopodia), which are regulated by ophn1 to
maintain the maturity of dendritic spines, are not dependent on
the development stage but probably on the cellular environment.
Synaptic plasticity in ophn1
ⴚ/yCA1 hippocampus
Because ophn1 knock-out mice exhibited altered spatial memory
and a modification of dendritic spine morphology in the CA1
hippocampal region, we asked whether this was associated with
altered synaptic plasticity. The amplitude and slope of CA1
fEP-SPs were comparable in ophn1
⫹/yand ophn1
⫺/y(Fig. 6c). The
amplitude and temporal characteristics of the LTP obtained in
ophn1
⫺/ywas not significantly different from that obtained in
ophn1
⫹/y(Fig. 6a). Because ophn1 has been described to interact
with Homer (Govek et al., 2004), a protein that is associated with
the postsynaptic mGlu1A and mGlu5 glutamatergic receptors
(Brakeman et al., 1997; Kato et al., 1997), we studied LTD
in-duced by the mGlu1/5 receptor agonist DHPG (100
M). Loss of
ophn1 function did not significantly alter this form of LTD (Fig.
6b). Because ophn1 is located both presynaptically and
postsyn-aptically, we asked whether ophn1
⫺/ydisplayed presynaptic
dys-function. This issue was studied by investigating paired-pulse
facilitation (PPF) of postsynaptic responses, a phenomenon that
is well known to depend on presynaptic mechanisms of
neuro-transmitter release. Facilitation of the fEPSP was observed by
paired-pulse stimulation of Schaffer-commissural afferents in
both ophn1
⫹/yand ophn1
⫺/yat all stimulation interpulse
inter-vals used. However, this PPF was significantly decreased in
ophn1
⫺/ycompared with ophn1
⫹/y(Fig. 6c), suggesting altered
neurotransmitter release in mutant mice. This change was not in
discrepancy with the normal synaptic transmission evoked by
single pulse stimulation of afferents, because it may only affect
repetitive/sustained synaptic activity.
Discussion
In this study, we report the functional characterization of the
mouse model of ophn1 deficiency. OPHN1 mutations in humans
lead to MR associated with cerebellum hypoplasia and variable
dilatation of the lateral ventricles (Bergmann et al., 2003; Philip et
al., 2003; des Portes et al., 2004; Zanni et al., 2005). We found that
loss of ophn1 function in mice recapitulates some of the human
phenotypes, such as behavioral, social, and cognitive
impair-ments, as well as the dilatation of the cerebral ventricles. In the
absence of any available brain samples from patients, this model
allowed us to investigate the consequences of ophn1 loss of
func-tion on neuronal morphology and funcfunc-tion.
Phenotypic characterization showed that ophn1
⫺/ymice are
hyperactive when exposed to a novel environment. Interestingly,
novelty-driven hyperactivity has been previously reported in
other mouse models of MR, and although the nature of this
hy-peractivity is still unclear, it would be worth to evaluate its
poten-tial use as a marker of MR in rodents (The Dutch-Belgian Fragile
X Consortium, 1994; Peier et al., 2000; Bontekoe et al., 2002;
D’Adamo et al., 2004). We also report that ophn1
⫺/ymice are
ophn1+/y
50 μma
5 μmb
ophn1-/y
0.5 1.0 1.5 2.0 2.5 3.0 3.5 4.0 4.5 Density (/20 μm)**
c
d
ophn1+/y ophn1-/y Density (/100 µm 2) Density (10 5/ mm 3) Neurons Excitatory Synapses Dendritic Spines 0 2 4 6 8 10 12 14 16 18 0 2 4 6 8 10 12 14 16 18Figure 4. Reduced apical spine density and basal spine length in ophn1⫺/yCA1
hippocam-pal neurons. a, b, Golgi staining of CA1 pyramidal neurons in ophn1⫹/yand ophn1⫺/yshowing overall normal dendritic tree in ophn1 mutants. Insets show a magnification of 20mdendritic segment arboring spines. Note the reduction in spine density in ophn1⫺/yneurons. Scale bar: 50m; inset, 5 m. c, Quantification of dendritic spine densities in apical dendrites from ophn1⫹/yand ophn1⫺/yCA1 neurons at 100m from the pyramidale cell layer. Analyses at 200m also showed a 30% reduction in dendritic spine densities (data not shown). Asterisks indicate statistical differences between means. d, Quantification of excitatory synapses and neuronal densities in ophn1⫹/yand ophn1⫺/yCA1 hippocampus. The left panel of the histo-gram represents the excitatory synapse densities at 200m from the pyramidal layer in the stratum radiatum. The right panel shows the corresponding neuronal densities in the pyramidal cell layer. There is no significant difference between genotypes for both variables.
dramatically impaired in spatial learning, whereas their
perfor-mances in the cued version of the Morris water maze are similar
to controls. Interestingly, in addition to their deficit in reference
memory, a large proportion of mutants
exhibited continual floating or
thigmo-taxic behavior. Because ophn1
⫺/ymales
did not exhibit anxiety-related behaviors,
as tested in the open field, light and dark
boxes, and O-maze, these floating and
thigmotaxic behaviors strongly support
the hypothesis that ophn1
⫺/ymales are
also impaired in procedural learning,
be-ing unable to understand and learn the
rules of the task or giving up the task in
front of the difficulty. Altered social
be-havior is one of the diagnostic criteria of
MR in humans. The observation that
ophn1 mutants are less aggressive and
showed inappropriate friendly behavior
toward intruders was therefore of great
in-terest. Remarkably, both phenotypes were
also reported in the Gdi1 mouse model of
MR (D’Adamo et al., 2002). Increased
prevalence of left or ambiguous
handed-ness has been reported in various
neuro-logical and psychiatric disorders,
includ-ing MR (Morris and Romski, 1993;
Grouios et al., 1999; Mohan et al., 2001).
Interestingly, positron emission
tomogra-phy experiments on two patients carrying
OPHN1 mutations revealed a reduction in
perfusion in certain regions of the right
hemisphere (temporal lobe, striatum, and
cerebellum) (V. des Portes, personal
com-munication), supporting the hypothesis
that in humans, cognitive deficits could be
associated with a reduction in brain
asym-metry (Toga and Thompson, 2003). In the
present study, we report a loss of
behav-ioral lateralization in ophn1
⫺/ymice. The
ophn1 mouse model of MR will thus be
useful to further investigate the role of
brain asymmetry in cognition. Altogether,
the ophn1 mouse model indicates that in
addition to impaired spatial learning in the
Morris water maze, classically used to
eval-uate cognitive deficits, altered social
be-havior, novelty-driven hyperactivity, and
impaired handedness could also be used as
reliable phenotypes in mouse models of
MR.
In contrast to human, there is no
cere-bellar hypoplasia in ophn1
⫺/ymice.
Be-cause it has been proposed that the
cere-bellum also participates with cognition in
addition to motor coordination (Dolan,
1998), and this proposition is still a matter
of debate, our findings in mice (i.e.,
pres-ence of learning deficit, abspres-ence of
cerebel-lar anatomical and histological anomalies)
open the question whether or not the
ob-served cerebellar anomalies in patients
with mutations in OPHN1 contribute to
the MR phenotype. At first sight, the discordant cerebellar
con-sequences between human and mice suggest that cognitive
func-tions do not require a fully developed cerebellum. However, to
ophn1-/y
c
ophn1+/y
a
b
Mushroom Filopodia Stubby
e
0 0.1 0.2 0.3 0.4 0.5 0.6 0.7 0.8 0.9 1.0 2.1 3.2 4.3 5.3 6.4 7.5 8.5 9.6 10.7 3.4 3.6 3.8 4.0 4.2 4.4 4.6 4.8 *** Cumulative probability Filopodia length (µm) Length (µm) ophn1-/y ophn1+/y 0 10 20 30 40 50 60 70 80Relative proportion of dendritic spines (%)
***
d
ophn1-/y ophn1+/y ophn1-/y ophn1+/y # Protusion/100 µmAll Mushroom Filopodia Stubby *** * *** 0 45 40 35 30 25 20 15 10 5 No Cre No Cre
h
j
100 % 80 60 40 20 0No Cre18div 2div Mature neurons Immature neurons
i
Cre Creg
f
3 4 1 OPHN1 MARKER 3 4 1 MARKER OPHN1 Cre Recombinase AAAA AAAA No Cre 2div Cre 18div Cre 0 div 22 div 2 div 18 divFigure 5. Loss of ophn1 leads to an increase in dendritic protrusions during in vitro differentiation. a, b, Dendritic protrusions
in ophn1⫹/y(a) and ophn1⫺/y(b) neurons at 21 div. Hippocampal neurons were stained with fluorescent dye-conjugated phalloidin, which labels actin-rich dendritic protrusions. Note the existence of numerous long and thin filopodia with mushroom-shaped spines in the ophn1⫺/yneuron along the primary dendritic segment. c, Densities of dendritic protrusions in ophn1⫺/y (black) and ophn1⫹/y(gray) neurons. We discriminated between immature filiform-shaped protrusions (filopodia), stubby spines, and mushroom-shaped spines. All protrusions observed over 100m of primary dendrites were counted, and data were obtained from three independent culture experiments (total number of protrusions, n⫽888ophn1⫹/yand 1088 ophn1⫺/y). d, Relative proportions of dendritic spines in ophn1⫺/y(black) and ophn1⫹/y(gray) neurons. The stubby spines remain unchanged, whereas filopodia and, to a lesser extent, mushroom-shaped spines are increased in ophn1⫺/yneurons. e, Filopodia length cumulative distribution. The line graphs show the cumulative probability distribution of filopodia lengths for ophn1⫺/y(black) and ophn1⫹/y(gray) neurons. Insets show the mean filopodia length for the two genotypes. Filopodia length was significantly longer for mutant neurons than for control (3.95m in wild type vs 4.54 in knock-out; F ⫽ 7.5; p ⬍ 0.007). In c–e, error bars indicate SEM, and asterisks indicate statistical differences between means. f, Schematic representation of the conditional ophn1 knock-out allele before and after cre-mediated inversion. We have deleted the first coding exon from endogeneous ophn1 gene and replaced it with a floxed cassette containing two cDNAs in opposite transcriptional direction: one encodes for ophn1, and the other encodes for a marker. In the absence of Cre recombinase, ophn1 cDNA is expressed under its own promoter. The presence of Cre catalyzes the inversion of the cassette, turning off the ophn1 expression and simultaneously turning on the marker. The use of mutated LoxP site prevents the reversion of inversion (see Materials and Methods for details). g, Schematic representation of the strategy for ophn1 conditional inactivation in culture. Neurons were infected with a GFP-tagged Cre recombinase expressing adenovirus at 2 or 18 div and fixed at 22 div. h, Control cortical neurons from ophn1 floxed allele (No cre) shows numerous mature dendritic spines. i, Infected cortical neurons from ophn1 floxed allele (Cre) developed long and thin filopodia. j, Quantification of the proportion of mature and immature neurons in the absence or in the presence of Cre recombinase at 2 or 18 div (n⫽ 15–20 neurons for each condition).