First International Conference on Bio-based Building Materials June 22nd - 24th 2015
Clermont-Ferrand, France
COMPARATIVE STUDY OF HYGROTHERMAL PERFORMANCES OF
STRAW-CLAY AND VERTICALLY PERFORATED STRAW-CLAY BRICK BUILDINGS
E. Stéphan*, D. Samri, B. Moujalled, F. Pesteil
CEREMA, Rue Pierre Ramond, CS 60013, 33166 Saint-Médard-en-Jalles Cedex *Corresponding author; e-mail: emma.stephan@cerema.fr
Abstract
The use of bio-based materials in new buildings, such as Straw-Clay (SC), corresponds perfectly to the French goal of 10% share of renewable construction materials by 2020. SC is made up of clay soil, straw and water. However, few laboratory and in situ studies have been undertaken on SC. This paper presents a comparative experimental study of transient hygrothermal behaviour of a SC building to a traditional one with vertically perforated clay bricks (VPB). They are located close in South West of France and have same orientation. Same protocol measurement has been used for both constructions. The envelope is examined through airtightness test with infrared thermography survey. Two walls are monitored for hygrothermal performance. Moreover, RH/T sensors for indoor air have been placed in different rooms. Weather station is installed near the SC building. Data presented in this paper are related to the period between July and October 2013. Unlike SC construction which shows homogeneous surface apparent temperature, VPB building presents thermal bridges located at junctions between the intermediate floor and the walls. In situ monitoring of walls underline that VPB structure has a higher ability to dampen variation of external temperature than SC wall. However, the SC wall acts as a moisture buffer managing the humidity levels within the building and contributing to a healthier environment.
Keywords:
Straw-clay, Hygrothermal performance, Experimental study
1 INTRODUCTION
Within the framework of the sustainable development, there is an increasing interest in using vegetal fibre materials in construction in order to obtain high environmental quality buildings (eco-buildings). The French government set the ambitious goal of achieving a 10% share of renewable construction materials by 2020.
This paper presents a comparative experimental study of transient hygrothermal behaviour of a Straw-Clay (SC) building to a conventional insulation one with vertically perforated clay bricks (VPB). The physical properties of VPB are well-known [Miniotaite 2005]. However, research works on hygrothermal properties and performance of SC insulations are mostly based on experimental works under controlled conditions in laboratories ([Attonaty 2004], [Quenard 2008]). There are few works about its hygrothermal performance in real conditions at the building scale.
In order to predict the real hygrothermal behaviour of the SC material, this paper presents a field study of transient hygrothermal behaviour of SC and VPB buildings. Same protocol measurement has been
used for both constructions [Samri 2014]. The walls, internal and external conditions are monitored and the data presented in this paper relate to the period between July and October 2013.
2 CASE STUDY
The two buildings selected as case studies are 2-floor single-detached dwellings. Both buildings are located in South West of France in Carla-Bayle (France, lat. 43°09’02’’N, long. 01°23’37’’E) and are designed using principles of bio-architecture. 2.1 Description of SC building
The surface of SC building is 95 m². A bioclimatic design was chosen with the implantation of the living rooms on the south face (sunspaces) and the creation of a buffer zone with the north face.
Its envelope is made of 300mm thick non load-bearing SC infill cast into walls of timber frame structure. The walls are internally and externally protected respectively with earth coating and earth and lime coating. The roof is composed of Roman tiles and is insulated by 22 cm of straw.
The windows are double-glazed. No ventilation system is installed. The air exchange is assured by a handing windows opening.
2.2 Description of VPB building
The VPB building surface is 126 m². A same bioclimatic design is integrated to the building: the living rooms are faced to south and a garage is placed to the north face. The VPB structure is made of vertically perforated bricks of 375mm thick. The walls are internally protected with earth coating and externally with lime and sand coating. The roof is made of Roman tiles and is insulated by about 20 cm of cellulose wadding. The windows are double-glazed. As for the SC building, the air exchange is only associated with a handing windows opening. 2.3 Synthesis
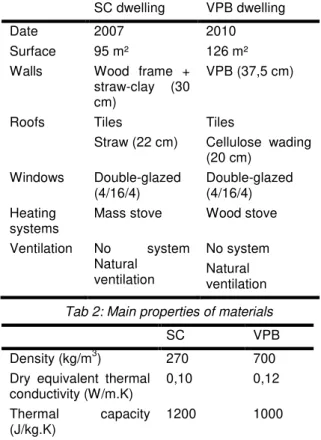
The Tab. 1 presents the main properties of both buildings. The main hygrothermal properties of SC and VPB are described in Tab. 2 [Grelat 2004] [Attonaty 2014].
Tab. 1: Description of case studies
SC dwelling VPB dwelling Date 2007 2010 Surface 95 m² 126 m² Walls Wood frame +
straw-clay (30 cm) VPB (37,5 cm) Roofs Tiles Straw (22 cm) Tiles Cellulose wading (20 cm) Windows Double-glazed (4/16/4) Double-glazed (4/16/4) Heating
systems Mass stove Wood stove Ventilation No system Natural ventilation No system Natural ventilation
Tab 2: Main properties of materials
SC VPB
Density (kg/m3) 270 700 Dry equivalent thermal
conductivity (W/m.K) 0,10 0,12 Thermal capacity (J/kg.K) 1200 1000 Vapour diffusion resistance (-) 1,2-2,8 5-12 Water content at RH80% (kg/m3) 20 5 3 EXPERIMENTAL METHOD
The aim of this experimental study is to compare the hygrothermal behaviour of a traditional building (VPB) to a bio-based building (SC).
3.1 Outdoor conditions
Outdoor temperature, relative humidity, global solar radiation, wind speed and direction are recorded from a weather station 50 m from the buildings with a time step of 15 min.
3.2 Building envelope inspection
Thermographic analysis and airtightness test have been conducted in order to evaluate the envelope performance. Surface temperature of thermal bridges were measured by using infrared image camera “FLIR T620 bx” with minimum indoor and outdoor temperature difference at least 20 K [NF EN 13187 1999]. The airtightness test helps to evaluate the level of air permeability and to detect the air leakages through the envelope. They were measured with the standardized fan pressurization method [NF EN 13829 2001], using Blowerdoor Minneapolis® system.
3.3 Hygrothermal performance of the walls In each building, instrumentation is installed on west and south orientations. The west and south walls of SC building concerned are respectively located in the WC and the living room. The west wall is protected by a wooden cladding and an awning. For VPB building, they are respectively located in the bathroom and the living room.
Relative humidity and temperature (RH/T) sensors (type S-THB-M008 from Onset) are embedded at two depths (70mm from the outside face and at the center), which allowed temperature and humidity profiles through the wall to be measured over time. The data loggers used are quite small (12 mm diameter) and have good accuracy (±0.2°C, ±2.5%RH). They are inserted into the wall through drilled holes at the specific depths. The indoor air T and RH of the rooms are measured with a Hobo data logger.
Thermocouples (type TMC6-H from Prosensor), fixed with adhesive tape, measure the interior and exterior wall surface temperatures.
Each wall is monitored as shown in Fig. 1.
Fig. 1: Sensors wall mapping
3.4 Hygrothermal monitoring of indoor climate The aim of this field monitoring is to analyze the indoor conditions evolution and to characterize the indoor hygrothermal comfort. Data loggers (Hobo U12-012) monitor the temperature and the relative humidity in some rooms of each house. Data are recorded every 15 minutes. Fig. 2 presents the monitoring location in SC building and Fig. 3 in VPB building. Tsi Tp1 Tp2 Tse Tsi Tp1 Tp2 Tse Ta HR CO2 Ta HR Ta HR Ta HR Ta HR Ta HR Ta HR Ta HR CO2
Fig. 3: Sensors mapping in VPB building 4 RESULTS AND DISCUSSION
4.1 Building envelope inspection
The thermographic inspection was performed in November 2013. As seen in Fig. 4, the surface temperatures are homogeneous for both buildings. Losses are observed at the link between walls and roof and the windows. In the case of VPB, thermal bridges are identified for the peripheral chaining above the girders.
Fig. 4: Thermogram of the south elevation of SC building (left) and VPB building (right)
However, the airtightness tests indicate a clearly poor results more than twice as the French mandatory level (0.6 m3.h-1.m-2) (Tab. 3). The main
leakages in the VPB building are due to a bad implementation of the chimney flue and the windows. The leakages are less important in SC building and are observed at the link between the elements.
Tab. 3: Airtightness results
SC building VPB building Q4Pasurf [m3/(h.m²)] 1,67 4,75
4.2 Hygrothermal performance of envelope In a first part, the south-facing walls are analyzed and the second part focused on west-facing walls.
South walls
Fig. 5 presents the statistical temperature results in the wall between June 27th and October 27th 2013.
The average temperatures are homogeneous inside both walls. However, the amplitude are variable with the depth: they decrease from the outside to the inside for both walls.
Moreover, the average and amplitude of the outside surface temperature are higher than the ones of outdoor air temperature. These differences are due to solar radiation. We can notice that for SC house, fluctuation is lower because an awning is protecting the wall. To analyze more precisely thermal dynamics inside materials and to compare their behaviors, temperatures are analyzed during three days when outdoor conditions are globally uniform.
Between July 7th and July 10th 2013, solar radiation is stable around 7 kWh/m² and the average outdoor temperature is around 14°C.
Fig. 5: Temperature average and amplitude – South walls
Fig. 6 presents the temperature evolution inside SC and VPB walls during these three days. External surface temperatures are clearly different (average difference of 2°C) because of the incident solar radiation which is higher for VPB building. However, the internal surface temperature is higher in SC building than VPB building (from 2°C to 4°C of difference). The heat transfer may be more important inside SC material than inside VPB. Also, the lower thickness of SC wall may explain this result.
Fig. 6: Temperature evolutions in South walls – July 7th to July 10th 2013
At the end of these three days, despite the difference of external surface temperature between both walls, the transient evolution of temperatures at 7 cm depth from external surface is found to be similar. Moreover, temperature amplitude are less important in the middle of VPB wall than in SC wall.
To characterize these differences, thermal inertia concept is introduced and calculated for both wall. It is defined by Ferrari [Ferrari 2007] as the heat storage capacity of building structure and its performance to delay the heat transmission. Its
characterization used generally two dynamics indicators [Ulgen 2002]: the decrement factor (Am) and the time lag (ϕ). The decrement factor evaluated the heat storage capacity and the time lag characterizes the heat transmission delay (Eq. (1) and Eq. (2)).
Decrement factor:
(1) Time lag:
(2)
These indicators are calculated for both walls (Tab. 4).
Tab. 4: Thermal inertia indicators – South walls
Decrement
factor (%) Time lag (h) SC VPB SC VPB T at 7 cm from outdoor 60% 72% 2:45 4:30 T at the middle 71% 92% 4:45 10:00 T on indoor surface 91% 94% 4:00 1 :15 Thermal inertia of VPB wall is higher than SC wall for both depth. At 7 cm from outdoor, the same orders are observed for the decrement factor but the time lag is twice higher for VPB wall. It is more complicated to compare the results at the middle of the wall because the thickness are different. However, the time lag is clearly better for VPB building. The VPB has a higher density than SC material (respectively 700 kg/m3 and 270 kg/m3) and both materials have similar thermal capacity (respectively 1000 J/kg.K and 1200 J/kg.K). These properties may explain the better thermal inertia of VPB.
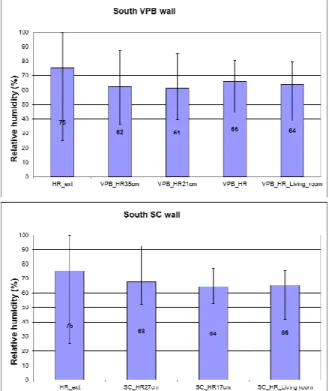
Fig. 7: Relative humidity average and amplitude – South walls
Fig. 7 describes the statistical relative humidity results in the walls.Average relative humidity values in SC material are higher than in VPB. However, the amplitudes are clearly lower in the bio-based wall. In both cases, the amplitude decreases from the outside to the inside. In SC building, the relative humidity in the wall is close to the one of indoor environment. On the contrary, in VPB building the evolutions are clearly different from the wall to the indoor air. The relative humidity evolutions in south walls are presented from July 7th to July 10th 2013
(Fig. 8).
Fig. 8: Relative humidity evolutions in South walls – July 7th to July 10th 2013
Tab. 5: Humidity inertia indicators – South walls
Decrement
factor (%) Time lag (h) SC VPB SC VPB HR at 7 cm from
the outside 74% 70% 8:45 4:45 HR at the middle 86% 51% 12:30 12:30 Relative humidity is higher in SC wall, around 70%, than in VPB wall (62%). Humidity is more important at the middle than at 7 cm from the outside for the VPB building. However, it is the contrary in SC wall. Thermal inertia indicators are exported to humidity to characterize the mass storage capacity and the mass transmission delay. Relative humidity of the outdoor air is the base for the calculation.
SC wall has a better inertia for relative humidity than VPB wall. In coherence with values given in Tab. 2, in the hygroscopic region, SC has a very specific behaviour due to its very low resistance to vapour diffusion combined with quite pronounced hygroscopic uptake (water content at RH80% gives a good idea of hygric capacity).
West walls
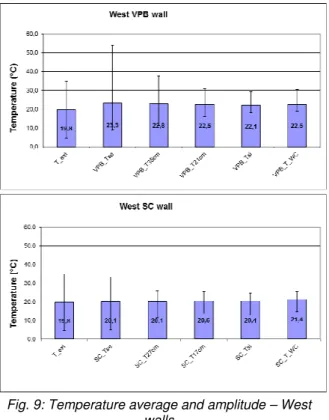
Fig. 9 presents the main temperature results for the west walls of both buildings from June 27th to
October 27th 2013. As for the south walls, the average temperature are homogenous inside each wall. However, temperatures of VPB wall are 1.5°C higher than ones of SC wall. Moreover, contrary to SC wall, the external surface temperature of VPB building is higher than the outdoor air temperature (average and amplitude) due to solar radiation. However, for both buildings, temperature amplitude decreases from the outside to inside. A detailed analyze is conducted on the results from July 7th to
July 10th 2013. Temperature evolutions for each
positions for both walls are presented in Fig. 10. Because of the awning protection of SC wall, its external surface temperature is clearly lower than
VPB building. Logically, the temperatures inside SC material are lower than VPB wall. To not be affected by the solar radiation difference, thermal inertia is based on external surface temperature (Tab. 6).
Fig. 9: Temperature average and amplitude – West walls
Fig. 10: Temperature evolutions in West walls – July 7th to July 10th 2013
Tab. 6: Thermal inertia indicators – West walls
Decrement
factor (%) Time lag (h) SC VPB SC VPB T at 7 cm from outdoor 79% 40% 5:00 1:45 T at the middle 84% 76% 6:00 3:15 T on indoor surface 92% 92% 6:00 1 :00 Thermal inertia indicators for this orientation are different from south wall indicators. Indeed, the time lag and the decrement factor of SC wall is higher than ones of VPB wall for both depths. West facing with a maximum of solar radiation during the evening seem to reduce the heat storage capacity of the VPB wall. It is important to notice that SC material of each orientation may be different because the house was built implementing traditional construction methods. Some parameters can affect physical properties as
compaction, fatigue of the people, etc. The statistical relative humidity results are described in Fig. 11.
Fig. 11: Relative humidity average and amplitude – West walls
Relative humidity of SC wall is clearly homogeneous and stable (12% of amplitude at the middle of the wall). This is due to the moisture capacity of the SC wall system. On the contrary, VPB suffers from a higher average humidity and a large amplitude (from 30% to 63% at the middle). Relative humidity evolutions of both walls for each depths are analyzed more precisely during the period from July 7th to July 10th 2013 (Fig. 12). Relative humidity at the middle of
the SC wall drops slowly over the period (from 75% to 80%) and it is variable in VPB wall (from 45% to 100%). As for south wall, relative humidity is higher at the middle of the wall (average of 92%) than at 7 cm from the outside (70%) in VPB building.
Fig. 12: Relative humidity evolutions in West walls – July 7th to July 9th 2013
The indicators of inertia is calculated with relative humidity (Tab. 7). As for south walls, the inertia of SC wall is clearly better than VPB wall for moisture. However, the implementation of the sensors in VPB could pierce the perforations and could affect the relative humidity results.
Tab. 7: Humidity inertia indicators – West walls
Decrement
factor (%) Time lag (h) SC VPB SC VPB HR at 7 cm from
the outside 93% 2% 13:45 9:30 HR at the middle 98% 63% 20:00 15:00
Conclusions
The SC material has different hygrothermal behavior belong the orientation of the wall. Thermal inertia is higher for VPB than SC for south-facing walls. The opposite behavior is analyzed for west-facing walls. The solar radiation is clearly different between both orientations for VPB building. However, these solar radiation differences are less important for SC walls because of their protection. Moisture inertia is higher for SC wall than for VPB wall for both orientations. 4.3 Hygrothermal monitoring of indoor climate Outdoor conditions
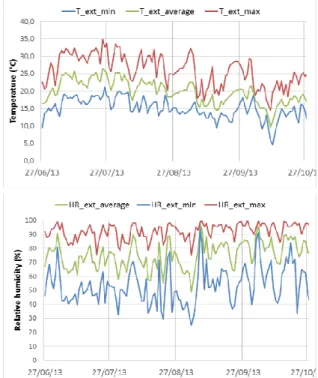
The statistical results of temperature and relative humidity of outdoor conditions for the entire study period are presented in Fig. 13.
Fig. 13: Statistical results of outdoor temperature and relative humidity
Temperature
Fig. 14 describes average temperature during summer period (from 27th June to 27th September
2013) in both buildings.
The rooms located at the first floor are in blue in the Fig. 14 and the rooms at the second floor are in green. For each building, the rooms located at the first floor are colder (0.5°C) than the others. Moreover, the amplitude of the second floor rooms are higher. The solar radiation on the roof and the low thermal inertia may be explained these results [Stéphan, 2014]. The two rooms WC and storeroom have lower average temperature than the other rooms of SC building because of the low windows surface. Tab.8 compares temperature of occupied rooms with same orientation in both buildings.
Fig. 14: Temperature average and amplitude in both buildings
Tab.8: Comparison of temperature main results in occupied rooms
Living room Kitchen Bedroom TP BM TP BM TP BM Aver (°C) 22,5 22,6 22,6 22,0 23,1 23,2 Max (°C) 27,3 27,2 27,3 26,3 29,1 28,4 Min (°C) 17,4 19,5 17,5 18,6 14,7 17,0 Average temperatures are similar in both buildings. However, the amplitude and maximum are higher in SC building even if the differences are globally low. The average temperature are comfortable (around 22°C). However, some maximum are high which may degrade the thermal comfort.
Relative humidity
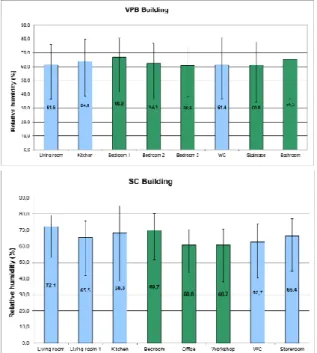
The average and amplitude of relative humidity is presented in Fig. 15 for the period from June 27th to
October 27th 2013.
The relative humidity is higher in SC building but it is more stable. The moisture buffer capacity of SC building is put in relieve. It is important to note that there isn’t any mechanical ventilation system, the air exchange is only caused by windows openings. Relative humidity is globally correct even if for comfort aspect, it is a little high in SC building. 4.4 Hygrothermal comfort
The comfort is characterized thanks to the standard NF EN 15251 [NF EN 15251 2007]. The zones which cause a dry air risk, a bacteria development risk are also located in psychometric data. Fig. 16 shows the coincidence of the measured psychometric data and the comfort zones of the living room of both buildings. The percentage of time in each zone are calculated for each room (Tab. 9 and 10).
In both buildings, percentage of time in comfort is less 95%. Moreover, in both kitchens a high percentage of time is in pathology risk (bacteria and mite). However, the time in pathology risk zone is separated in short periods (max of 3 days). In the SC building, the conditions of the storeroom are mainly in zones of pathology risks, the periods in this zone attain 15 days which may affect the health quality of
the dwellings and the development of bacteria. A washing-machine and a sink are highly used and the absence of windows prevent from a sufficient air exchange. The implementation of a mechanical ventilation system is prescribed. Globally, the comfort is higher in VPB building (73%) than in SC building (54%).
Fig. 15: Relative humidity average and amplitude in both buildings
Fig. 16: Psychometric data of living room of both building
5 CONCLUSIONS
Laboratory tests underline that thermal conductivity of SC is low (0.1 W/m.K) same as VPB. Moreover, SC material has been classified as having an excellent moisture buffer performance, based on the measured Moisture Buffer Value and the Nordtest classification categories [Rode 2005]. The envelope monitoring highlight the good thermal inertia of VPB
and SC. However, some differences between west and south-facing walls are observed. They may be linked to the variation of SC properties and to the impact of solar radiation. Moreover, VPB dampen more temperature variation than SC. On the contrary, SC acts as a better moisture buffer. Globally, VPB building is more comfortable than SC building. Kitchens and storeroom present pathology risks because of high humidity. The implementation of mechanical ventilation may be necessary. The comparison of these buildings underlines the considerable benefits of SC: good thermal inertia and good humidity buffering. It confirms the general idea of agro-sourced material being good indoor climate regulators.
Tab. 9: Percentage of time in each zone for rooms of SC building
Comf
ort Dry air Pathology risk (bacteria) Pathology risk (mite) Living room 63% 0% 7% 5% Kitchen 36% 0% 26% 15% WC 36% 0% 18% 4% Bedroom 75% 0% 0% 0% Office 72% 0% 0% 0% Storeroom 17% 0% 56% 24%
Tab.10: Percentage of time in each zone for rooms of VPB building
Comfo
rt Dry air Pathology risk (bacteria) Pathology risk (mite) Living room 72% 0% 3% 6% Kitchen 59% 0% 10% 13% WC 64% 0% 7% 6% Bedroom 1 77% 0% 0% 2% Bedroom 2 76% 0% 1% 3% 6 REFERENCES
[Attonaty 2014] Attonaty K., Labat M., Oudhof N., Magniont C. Mesure des propriétés de sorption d’un mélange terre-paille, Conférence Matériaux 2014 [Ferrari 2007] Ferrari S., Building envelope and heat capacity: re-discovering the thermal mass for winter energy savings, 28th AIVC Conference, 2007, Greece.
[Grelat 2004] Grelat, Alain. Utilisation de la paille en parois de maisons individuelles à ossature bois. Saint Remy de Chevreuse, 78, 2004.
[Miniotaite 2005] Miniotaite, R. Hygric properties of building materials. IN: The 7th symposium on Building Physics in the Nordic Countries, June 13-15th 2005. Department of Civil Engineering
Technologies, Faculty of Civil Engineering and Architecture, Kaunas.
[NF EN 13187] Thermal performance of buildings - Qualitative detection of thermal irregularities in building envelopes - Infrared method, AFNOR, 1999, Paris, France
[NF EN 13829 2001] Determination of air permeability of buildings - Fan pressurization method, AFNOR, 2001, Paris, France.
[NF EN 15251 2007] Indoor environmental input parameters for design and assessment of energy performance of buildings addressing indoor air quality, thermal environment, lighting and acoustics, AFNOR, 2007, Paris, France.
[Quenard 2008] Quenard, Daniel. «Propriétés hygrothermiques de la terre crue.» Site Web CTMNC. 2008.
[Rode 2005] Rode, C. et al. Moisture buffering of building materials. Department of Civil Engineering, Technical University Denmark. Report BYG.DTU R-126
[Samri 2014] Samri D., Moujalled B., Richieri F., Sgorlon D. Monitoring the hygrothermal performance of a hemp lime building: experimental and numerical approach. International Conference on Zero Carbon Buildings Today and in the Future Birmingham, UK, 11-12 September 2014.
[Stéphan 2014] Stéphan E., Cantin R., Caucheteux A., et al. Experimental assessment of thermal inertia in insulated and non-insulated old limestone buildings. Building and Environment, 2014, vol. 80, pp. 241-248.
[Ulgen 2002] Ulgen K, Experimental and theoretical investigation of effects of wall’s thermophysical properties on time lag and decrement factor, Energy and Building 34 (2002) 273-278.