A Development Perspective on Creating Workforce Rental Housing Proximal to Major Employment Centers
by
Eric Charles Rosenthal B.S., Business Administration, 2013
Northeastern University
Submitted to the Program in Real Estate Development in Conjunction with the Center for Real Estate in Partial Fulfillment of the Requirements for the Degree of Master of Science in Real Estate
Development at the
Massachusetts Institute of Technology September, 2019
©2019 Eric Charles Rosenthal All rights reserved
The author hereby grants to MIT permission to reproduce and to distribute publicly paper and electronic copies of this thesis document in whole or in part in any medium now known or hereafter created.
Signature of Author______________________________________________________________ Center for Real Estate July 26, 2019 Certified by_____________________________________________________________________ Jen Cookke Lecturer, Center for Real Estate Thesis Supervisor Accepted by____________________________________________________________________
Professor Dennis Frenchman Class of 1922 Professor of Urban Design and Planning, Director, Center for Real Estate School of Architecture and Planning
A Development Perspective on Creating Workforce Rental Housing Proximal to Major Employment Centers|2 A Development Perspective on Creating Workforce Rental Housing
Proximal to Major Employment Centers by
Eric Charles Rosenthal
Submitted to the Program in Real Estate Development in Conjunction with the Center for Real Estate on July 26, 2019 in Partial Fulfillment of the Requirements for the Degree of Master of
Science in Real Estate Development
ABSTRACT
Middle-income renters in major cities across the United States are facing an affordability crisis. Many of them earn too much money to qualify for rental assistance programs, but don’t earn enough to comfortably afford market rents.
Developers recognize the need for quality workforce housing close to major employment centers but have been unable to deliver enough projects to satisfy demand. Population growth, urbanization, and low homeownership rates are just a few of the macroeconomic trends that are driving up the demand for rental housing and causing market rents to rapidly appreciate beyond reach for the middle class. Rising construction costs as a result of government regulation, a shortage of skilled construction labor, and foreign trade policy make the production of workforce housing even more challenging. With a shortage of middle-income subsidy programs at every level of government, developers must exhibit creativity if they wish to build or preserve workforce housing.
This Thesis explores the confluence of forces and factors that make it challenging to build new workforce housing and to preserve the existing stock. It then assesses subsidy programs at different levels of government and market-based solutions that developers can add to their toolkit. Three case studies from different parts of the country are used as examples to show how developers can overcome the obstacles and use the tools at their disposal to create workforce housing. Drawing upon the preceding analyses and discussions, the Thesis concludes with a series of recommendations that developers can employ to make workforce projects more economically feasible.
Thesis Supervisor: Jen Cookke
A Development Perspective on Creating Workforce Rental Housing Proximal to Major Employment Centers|3
ACKNOWLEDGMENTS
This Thesis would not have been possible without the generous support of many individuals along the way. Thank you to all the seasoned professionals who took time out of their day to provide me with valuable insight into this topic. I’m grateful for the candor with which so many individuals shared their knowledge.
Thank you to the faculty, staff, and my colleagues at the MIT Center for Real Estate for a rich educational experience and a great year. It has been an honor to work with such a knowledgeable, motivated, and diverse group of individuals who share a passion for real estate.
Thank you to Professor Jen Cookke for all the support and guidance throughout the year, especially with regards to this Thesis. You’ve been a great sound board and resource for this final product and my professional development, and for that I’m truly grateful. It has been a pleasure working with you throughout this process.
Thank you to the team at Round Hill Capital in New York for planting the workforce housing seed in my mind back in January. Without your influence, I may not have chosen to pursue this fascinating topic.
Thank you to the team at WinnDevelopment for providing me with practical insight into the business of mixed-income housing development. Many of the topics covered herein were discovered through candid conversations and engaging projects with you this summer.
Lastly, thank you to my family, especially my wife Catherine, for the endless support you’ve given me every day throughout this whole graduate school process. This Thesis and degree truly would not have been possible without you.
A Development Perspective on Creating Workforce Rental Housing Proximal to Major Employment Centers|4
TABLE OF CONTENTS
Abstract………...………....2 Acknowledgements………...…………...………3 Table of Contents………....………4 Introduction………...6 Part One………...8Chapter One: Introduction to Workforce Housing………...……….8
Chapter Two: Macroeconomic Trends Affecting Workforce Housing………...………...…10
Declining Homeownership………...………..10
Income Growth Trails Rent Growth………11
Rent Burden………...………12
Supply Shortage………...………...13
Urban Migration………...………….……….15
The Time and Cost of Commuting………...16
Greater Boston Case Study………18
Chapter Three: Biggest Impediments……….………20
Rising Cost of Materials……….……...20
Shortage of Construction Labor………..…….22
Government Regulation……….………..22
Lack of Middle-Income Rental Subsidy Programs……….………23
Part Two………...………25
Chapter Four: Solutions at the Federal Level……….25
Low-Income Housing Tax Credit & Income Averaging………..…….25
Historic Tax Credit………...………26
New Markets Tax Credit……….……….26
Freddie Mac……….…27
Opportunity Zones……….….28
Workforce Housing Tax Credit………29
Chapter Five: Solutions at the State Level……….30
MassHousing Workforce Housing Program (MA)………30
Supportive Housing Opportunity Program (NY)……….30
Chapter Six: Solutions at the Local Level………32
Inclusionary Development………...32
New York City………...32
San Francisco………...……….32
Miami………...33
Boston……...………....………...………...33
Tax Increment Financing……….33
Washington, DC Workforce Housing Tax Abatements………34
Payment In Lieu Of Taxes………34
Housing Development Incentive Program………...………...35
Chapter Seven: Market-Based Solutions………...36
Prefabrication………...………..36
Smaller Units………....37
Green Building………...………38
A Development Perspective on Creating Workforce Rental Housing Proximal to Major Employment Centers|5
Flexible Unit Design………40
Part Three………...……….….41
Chapter Eight: Case Studies………..41
Urban Town Homes – Southern California – Urban Pacific……….41
The Watson – Quincy, MA – WinnDevelopment………...……….42
The SIX13 – Fort Lauderdale, FL – Affiliated Development & Round Hill Capital……….44
Part Four………46
Chapter Nine: Recommendations and Conclusion………..….46
Recommendations………...………...46
Conclusion………....………..…….48
Works Cited………...………...49
Figure Sources………...…………54
FIGURES
Figure 1: Rent Growth vs. Income Growth………...11Figure 2: Share of Income Spent on Rent……….13
Figure 3: Class A Stock vs. Class B/C Stock……….13
Figure 4: Most Housing Supply-Constrained Cities in the US………...14
Figure 5: Fastest Growing Cities in the US………16
Figure 6: Average One-Way Commute Times in Minutes by Metro………...17
Figure 7: Average Rental Housing Cost and Commute Times in Greater Boston……….18
Figure 8: Annual Percentage Cost Changes for Construction Materials………21
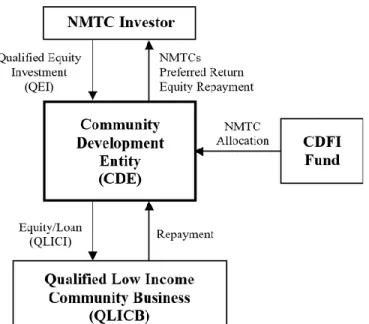
Figure 9: Sample NMTC Transactional Structure………..27
Figure 10: Domain Apartments – Modular Construction in San Jose, CA………..36
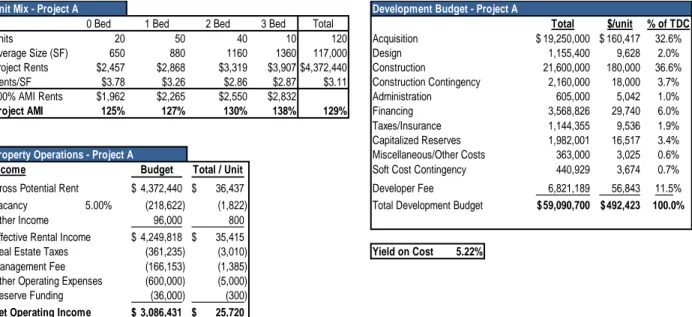
Figure 11.1: Select Project Underwriting Metrics – Baseline Unit Size………37
Figure 11.2: Select Project Underwriting Metrics – Reduced Unit Size………..….38
Figure 12: Rognan Furniture System………...40
Figure 13: UTH Rendering – Montebello, CA………..41
Figure 14: The Watson………...…………43
A Development Perspective on Creating Workforce Rental Housing Proximal to Major Employment Centers|6
INTRODUCTION
Financially and geographically accessible rental housing is imperative for America’s workforce, but developers often have difficulty rehabilitating or constructing quality new homes for this demographic. Responsible for most local goods and services, the middle-income population drives the American economic engine and is what makes the United States so prosperous on a global scale. Despite modest income levels, middle-income households still face many of the housing affordability challenges associated with living in or close to cities with rising housing costs. They often make too much money to qualify for government subsidy programs, yet don’t earn enough to be able to comfortably afford market rents. Their incomes have failed to keep pace with rent growth, leading to a growing cost-burden in almost every major city in the United States. To compensate for the high cost of housing, many households reluctantly retreat outward in search of better quality and extend the length of their commutes. Extended commutes decrease productivity levels, increase traffic congestion, lead to environmental issues as a result of additional air pollution, and cause added stress. Workforce renters who opt to take on those high housing costs in exchange for shorter commutes often end up sacrificing quality, as most of the workforce housing on the market is an aging product.
The affordable housing crisis in the United States has been well-documented through countless editorials, research reports, and academic papers. Our nation’s most vulnerable households, those with income well below the area median, struggle to keep up with rent payments and can seldom entertain the thought of owning a home one day. They have been the primary focus of government subsidy programs through project funding and rental assistance for good reason. While it’s important to direct considerable attention to low-income households, middle-income households have often been neglected when it comes to new housing production. In order to provide quality workforce housing close to employment centers, the “missing middle” needs additional attention from both the public and private sectors.
Broken into four parts, this Thesis aims to articulate the difficulties plaguing workforce housing production in urban areas from a development perspective and offer insight to how projects can improve economic feasibility in ways that the private sector can currently control.
Part One is divided into three chapters that define workforce housing and highlight the macroeconomic and microeconomic challenges that developers face. Chapter One introduces workforce housing and discusses how it fits into the broader conversation about affordable housing. Chapter Two dives into the macroeconomic trends affecting workforce housing including declining home ownership, supply shortage, the growing divide between rent growth and income growth, rent burdens, transportation challenges, and urban migration. Chapter Three focuses on the impediments that are driving up costs and making workforce housing production so challenging including rising materials costs, a shortage of construction labor, government regulations, and a general lack of middle-income subsidy programs.
Part Two consists of four chapters that explore tools available to developers in their endeavors to create workforce housing. Chapters Four, Five, and Six focus on solutions at the federal, state, and local level, respectively. These include public subsidy programs, tax incentives, financing, and others. Some of the contributing solutions discussed in these three chapters aim to provide affordable housing to all income groups, but they can still be utilized to serve middle-income households to a certain extent. Chapter Seven transitions to market-based solutions that require creativity on behalf of the
A Development Perspective on Creating Workforce Rental Housing Proximal to Major Employment Centers|7 developer. These solutions aim to reduce construction and operating costs, ultimately reducing the need for public subsidy.
Part Three uses case study examples to show how developers are using various tools in their respective markets to create workforce housing in different locations around the country. The locations where these projects take place are all among our nation’s most cost-burdened metros. Despite the challenges, some developers manage to find creative solutions and deliver workforce housing where it’s needed most.
Part Four is a conclusion that provides a broad analysis of the challenges facing workforce housing production, the tools available to bring projects to market, whether the tools are being used to their full potential, and whether these solutions are sufficient to meet demand. Drawing upon the analyses and case studies, Part Four will also make recommendations for development strategies that make workforce housing projects more economically feasible.
Disclosure: The scope of this Thesis is intended to be national in nature so that an accurate picture of workforce housing in major metros across the United States is portrayed. Due to the author’s familiarity with the housing market in Boston and the relative progressiveness with regards to affordable housing in the state of Massachusetts, there may be an inherent bias towards this locale. This was not the original intention of the author, but was merely a result of the research process and the public programs available in the state. Nonetheless, a thorough discussion of workforce housing across the country is provided herein.
A Development Perspective on Creating Workforce Rental Housing Proximal to Major Employment Centers|8
PART ONE
Housing affordability has been an issue for families across the United States for decades, and the problem is getting worse in many cities. Middle-income families that live and work in major employment centers are increasingly at a unique disadvantage, and developers are finding it difficult to provide quality, convenient rental housing at an affordable price for this population. To truly understand this phenomenon and its implications for workforce housing development, we must take a step back and assess the macroeconomic forces at play and why the cost of development is so high. By gaining a solid understanding of the problem, we can begin to devise a solution.
Chapter One: Introduction to Workforce Housing
Workforce housing is housing for middle-income individuals and families that is affordable and close to employment centers and major transportation nodes. The Urban Land Institute (ULI) refers to it as housing that’s affordable to those that earn between 60% and 120% of AMI. Some communities use 80% as the lower bound and high cost areas may use up to 140% for the upper limit. For the purposes of this Thesis, we will use the spectrum provided by ULI as our range for workforce housing and interchangeably refer to it as middle-income housing. While there are some programs that provide development subsidy and/or rental assistance for these families, most workforce housing is not government sponsored. Recent research from CBRE shows that roughly 13.5 million households, or 32% of the renter population in the United States, fall within the target population for workforce housing (CBRE 2018). Many of them are also renters by necessity who are unable to adequately save up for a down payment and afford the rising costs to purchase a home. Typical tenants of workforce housing include public employees such as teachers, firefighters, police officers, nurses, and other service workers that are integral to their communities. These households often make too much money to qualify for many rental subsidy programs and don’t make enough to be able to comfortably afford market rate housing.
Because workforce housing often gets intertwined in the broader discussion of affordable housing, it’s difficult to talk about the workforce piece without considering affordable housing as a whole. The definition of affordable housing can vary depending upon location or municipality and is typically answered by federal, state, and local governments with innumerable volumes of laws and regulations. When most people hear the term, they invoke thoughts of low-income housing and public housing projects. While those are examples of affordable housing, they fall short of its true definition. The US Department of Housing and Urban Development (HUD) defines it as “housing for which the occupant is paying no more than 30 percent of his or her income for gross housing costs, including utilities” (2019). Within this definition is no mention of the occupant’s level of income; affordable housing applies to everyone.
Households that exceed the 30% threshold are considered cost-burdened and often have difficulty affording other basic life necessities such as food, transportation, and healthcare. Furthermore, households that pay over 50% of their annual income on housing are considered severely cost-burdened. Beyond being able to afford basic necessities, a high cost of housing can create a snowball effect whereby families at the margin face additional challenges such as saving for retirement and paying for higher education, which has increasingly become a prerequisite to getting ahead in today’s society. Unfortunately this is the reality for millions of Americans across the country, from rural areas to large urban metropolises. A family with one full-time worker earning minimum wage cannot
A Development Perspective on Creating Workforce Rental Housing Proximal to Major Employment Centers|9 reasonably afford the local fair-market rent for a two-bedroom apartment anywhere in the United States (HUD 2019). According to the National Low-Income Housing Coalition, a minimum wage worker must put in 122 hours of work per week for all 52 weeks of the year to meet the national average fair market rent for such a home (NLIHC 2018).
Access to safe, quality, affordable housing within a reasonable distance of one’s employment should be an unencumbered right for all Americans, but the reality is that not everyone can handle the costs of housing on their own. A myriad of government subsidy programs exist that help households meet their monthly expense needs, and within these different programs exist different income brackets. The requirements to qualify for these subsidies are often tied to how a household’s earnings compare to the Area Median Income (AMI). On an annual basis, HUD publishes income limits based on household size and the income distribution midpoint for every metropolitan region in the country. These income limits are then benchmarked against certain percentages of AMI to determine eligibility for various rental assistance programs. Low-Income, Very Low-Income, and Extremely Low-Income households are defined as those with income from 50% to 80% of AMI, 30% to 50% of AMI, and below 30% of AMI, respectfully (Zahalak 2019). Such income bands often receive the most attention from a public policy standpoint as these renters are at the greatest absolute disadvantage when trying to afford market rents. Households that earn between 80% and 120% of AMI are considered Moderate-Income, while those that earn above 120% are deemed High-Income. Middle-income households fall within a portion of these bands and are a segment of the population that’s the backbone of our economy.
One of the biggest challenges about creating workforce housing is ensuring quality properties are located where they’re needed most. People ideally should be able to comfortably afford homes that are near their places of employment with convenient access to transportation. The reality is that many families must make the difficult choice between paying an excessive amount on housing to live close to employment centers or enduring long commutes so that they can save on housing costs. This is not only a problem for the households that must decide between this tradeoff, but also for employers who have difficulty retaining employees in areas with rising housing costs. When people make the decision to save on housing by moving further away, the city sprawl expands thereby straining an aging transportation infrastructure and increasing traffic congestion and air pollution. Commute times get longer and people have less time to devote to their jobs and families. Such effects have unintended negative consequences for all within the community. Because most federal and state subsidy programs cater towards residents that are at the lower end of the income spectrum, local planning departments must incentivize development to meet the growing need for workforce housing near employment centers and reliable transportation infrastructure. Ease of access must be prioritized when it comes to workforce housing.
A Development Perspective on Creating Workforce Rental Housing Proximal to Major Employment Centers|10
Chapter Two: Macroeconomic Trends Affecting Workforce Housing
As previously mentioned, much of the focus surrounding this housing crisis has been on our nation’s most vulnerable population: those who would be homeless without government subsidy programs. Policy makers and developers know that the need for workforce housing is there, but it’s difficult to quantify when many advocates push for public money to go towards supporting low-income populations. These critics argue that diverting resources from those with little or no income to middle-income families, some of which command six-figure middle-incomes, makes no sense when we haven’t solved the issue for those at the bottom. On the other hand, middle-income households include typical blue-collar workers that ultimately determine the health of the economy. It would be foolish to continue to neglect the part of the population that drives the economic engine. Continuing to ignore the “missing middle” could potentially result in a dystopian future with urban communities populated by households on extreme ends of the income spectrum.
Before devising a way to create more options for middle-income renters, we must understand the state of the housing market as it relates to workforce housing. Workforce housing can come in a variety of forms but are typically Class B and C multifamily products that are more affordable to middle-income families due to their age, location, or condition. Many of them come without income restriction requirements, causing rents to vary based on supply and demand within the marketplace. The high demand for workforce housing has kept vacancy rates low in recent years; after hitting a trough in 2015 at 5.1%, vacancies for Class B and C properties have remained at a stable level. On the other hand, Class A vacancies have remained elevated at 8.5% as of the end of 2018 and are projected to rise (Zahalak 2019). These vacancy rates provide valuable insight to the state of workforce housing, yet little data exists that focuses exclusively on this market segment. Furthermore, it’s difficult to ascertain the problems facing workforce housing without discussing the broader trends affecting all of affordable housing.
Declining Homeownership
Since the end of the Great Recession, the affordability of multifamily housing has seen significant erosion across the United States. A major driver of this trend has been the decline in homeownership rates. During the housing crisis, between 8 and 10 million homes were foreclosed upon. This loss of homes has had a lasting impact on the housing market as many of those families have had difficulty recovering and have been relegated to renting. In the years leading up to the recession, homeownership peaked at 69.2% in Q4 2004. The rate bottomed out at 62.9% in Q2 2016 and has made a modest recovery to 64.2% as of Q1 2019, still well below the pre-recession peak (U.S. Census Bureau 2019b).
A significant portion of the depressed homeownership rate can be attributed to millennials, or those aged 34 and below. Such occupants historically have had the lowest homeownership rate of any age group due to a lack of financial maturity, but this cycle has seen the rate fall to its lowest level in over 30 years. Those under 35 own only 35.4% of their residences as of Q1 2019 compared to 43.6% in Q2 2004 (Sparshott 2019). With national student debt reaching unprecedented levels, making it increasingly difficult to save up for a down payment and qualify for a loan, we may be facing a permanent paradigm shift in the way people live. These lower homeownership rates naturally create greater demand for rentals and drive rents upward, absent any appreciable uptick in supply.
A Development Perspective on Creating Workforce Rental Housing Proximal to Major Employment Centers|11
Income Growth Trails Rent Growth
Between 2000 and 2017, real median household income grew from $59,938 to $61,372, an annualized rate of 0.3% (U.S. Census Bureau 2019c). Over that same time period, rents accelerated at 3.0% per year. This widening gap between rents and incomes has left Americans with less money for other basic necessities than they’ve had in previous decades. The shortage in supply and consistently low levels of vacancy have allowed landlords to steadily raise rents year after year. The number of homes renting for at least $2,000 per month grew by 97% between 2005 and 2015 (NLIHC 2018). According to CoStar, rents for Class B and C units grew at an estimated 3.4% and 2.9% in 2018, respectively. These middle-market properties outpaced both inflation (2.4%) and Class A rents (2.6%) (Zahalak 2019). Overall rent growth is projected to soften over the next few years, but the delta with incomes will continue to expand.
Figure 1: Rent Growth vs. Income Growth
Source: U.S. Census Bureau, Federal Reserve Bank of St. Louis, 2019; values indexed to 100 for FY2000
This disparity is especially prevalent with low- and moderate-income households and those without a college education. Inflation adjusted income for the bottom quartile of households only grew by 3% between 1988 and 2016, while young adults aged 25 to 34 – those that have historically been a barometer for the homebuying market – saw their incomes rise by only 5%. Over that same time period, GDP per capita, a key measure of overall economic gains, grew by 52% (JCHS 2018). This signifies that income inequality has been a major contributor to current housing affordability challenges. With regards to education, from 1980 to 2010 the inflation-adjusted average hourly wage of men aged 25 to 60 that only had a high school degree or dropped out of high school altogether decreased by 8% and 14%, respectively. On the other hand, those with a college degree or an advanced degree saw their incomes rise over the same time period by 20% and 32%, respectively (Moretti 2012). This means that the burden of rising rents is being disproportionately felt by the less educated, less skilled portion of the workforce.
80 90 100 110 120 130 140 150 160 170 180 2000 2002 2004 2006 2008 2010 2012 2014 2016
Rent Increases Outpaced Income Growth Since 2000
A Development Perspective on Creating Workforce Rental Housing Proximal to Major Employment Centers|12
Rent Burden
Approximately 44 million households rented in 2016 according to the Joint Center for Housing Studies of Harvard University. In major cities across the country, 47% of these renters routinely pay more than 30% of their income towards housing costs (JCHS 2018). Cities such as New York, Boston, Miami, San Francisco, and Los Angeles are among the least affordable in the country. This cost burden only seems to be growing as rents are growing faster than wages, on average. Furthermore, HUD estimates that over 12 million households pay more than 50% of their annual income towards rent (HUD 2019). Actual rent burden figures may even be understated, as most estimates are based on pre-tax income, which is often considerably higher than the post-tax dollars that are used to pay rent. Rent-burdened households have a greater eviction incidence, increased financial instability, and a higher propensity to utilize social safety net programs. They also have greater difficulty accumulating savings over time, making the transition to homeownership especially challenging and causing undue hardship during periods of income and expense volatility.
Rent-burdened households aren’t limited to a specific age group, income level, or demographic, but some feel the brunt of elevated rents more than others. Unsurprisingly, households with the lowest levels of income have the highest incidence of rent burden as government rental assistance services struggle to meet demand. About 80% of households with less than $30,000 in annual income were rent-burdened in 2016, including 55% that were severely rent-burdened (JCHS 2018). Single-parent households are also more likely to be burdened than those with dual incomes. While the rent-burdened spread between African American and white households has remained relatively stable over the past 15 years, both groups have seen an absolute increase in financial strain. In 2001, 26% of white and 39% of African American households were burdened, respectively. By 2015, those figures had risen to 33% and 46% (Pew 2018). Within income groups, minority households are also more likely to be rent-burdened than white households.
Freddie Mac recently compiled data from four different studies to assess rent burdens across different metro areas. The studies were conducted by The National Low Income Housing Coalition, New York University’s Furman Center, and Harvard University’s Joint Center for Housing Studies and include varying methodologies; some look at percentage of households with severe cost burdens while others look at the number of units affordable to households at differing percentages of AMI. Miami, San Diego, Los Angeles, and New York consistently placed in the top 15 most-rent burdened markets across all four studies and are considered the least affordable rental markets in the country (Freddie Mac 2019b). The share of income spent on rent has unilaterally grown in every major metro in the United States. From 1985 to 2000, the average household dedicated 25.8% of their income to rent. As of Q2 2018, that figure had grown to 28.4% (Zillow 2018). While the national increase may seem modest, some markets have placed disproportionate financial strain on their residents over the past few decades. The chart below shows cities in which residents’ rent-to-income ratio is greater than the national average. The burden in these cities is even more strenuous for lower-income renters, or those in the bottom tercile of incomes. Lower-income figures are inclusive of government rental assistance provided.
A Development Perspective on Creating Workforce Rental Housing Proximal to Major Employment Centers|13 Figure 2: Share of Income Spent on Rent
Source: Zillow, Business Insider, 2018
Supply Shortage
As the cost of new multifamily residential construction continues to rise, it becomes increasingly difficult to deliver new workforce housing product. The rental income commanded by Class B and C products is hard-pressed to cover the expense of building from the ground up or to incentivize landlords to rehabilitate deteriorating properties. When such redevelopment of aging properties in today’s landscape does occur, rents are often pushed towards the top of the market. Consequently, value-add and opportunistic rehab projects turn Class B & C units to Class A and the supply of workforce housing has remained stagnant. Between 2013 and 2017, nearly 1 million Class A units were delivered, while less than 20,000 new construction Class B and C units opened their doors (Gonzalez 2018). Additionally, land use policies and political approval processes have constrained developers’ ability to maximize density.
Figure 3: Class A Stock vs. Class B/C Stock
Source: Fannie Mae, Reis, 2019
Metro Area Historic (1985-2000) Current (Q2 2018) Lower-Income (Q2 2017)
United States 25.8% 28.4% 62.7% Dallas-Fort Worth 21.8% 28.4% 57.8% Houston 24.4% 28.8% 66.1% Portland 23.5% 29.9% 68.8% Seattle 23.8% 30.9% 64.0% Tampa 27.6% 31.0% 66.2% Orlando 22.7% 31.5% 63.7% Denver 23.6% 32.0% 66.1% Sacramento 31.8% 32.4% 76.1% Boston 26.4% 32.7% 83.0% San Jose 26.1% 35.6% 99.8% Riverside 32.7% 36.8% 74.4% New York 26.3% 37.7% 102.9% San Francisco 30.6% 39.2% 95.9% San Diego 34.7% 40.3% 94.9% Miami-Fort Lauderdale 28.6% 41.5% 90.7% Los Angeles 36.3% 46.9% 121.2%
A Development Perspective on Creating Workforce Rental Housing Proximal to Major Employment Centers|14 Attractive value-add opportunities are especially true in the case of urban in-fill development, where properties are moved out of the price range of workforce renters in places that they’re needed most. This has caused a shift in the relative availability of Class B and C product, as its share of the overall rental stock has declined from 59% in 2009 to 52% at the end of 2018. By some estimates, 120,000 Class B and C units are lost annually to obsolescence and gentrification and new additions have struggled to cover these losses (Zahalak 2019). It’s not enough to simply build new workforce housing – we must also take measures to preserve the existing stock.
Most of the new supply of workforce housing occurs through a process known as “naturally occurring affordable housing” (NOAH), whereby Class A units age and no longer command rents at the top of the market. Where this occurs depends on the economics of the local market. In strong housing markets, landlords without affordability restrictions are incentivized to redevelop their units with considerable capital expenditures so that they can command higher rents. In weak housing markets, landlords find difficulty justifying the extensive cost of upkeep when rents can’t cover the cost of remodeling. Some of the new product has been created through local inclusionary housing policies that require developers to make a percentage of their units affordable, but these units represent only a small fraction of the overall supply.
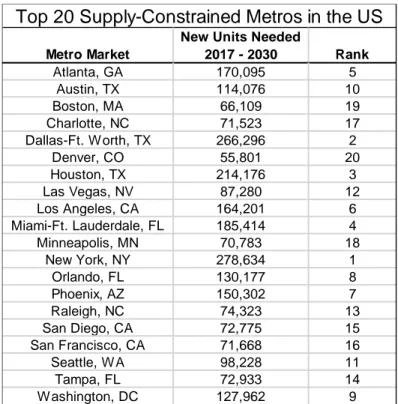
Figure 4: Most Housing Supply-Constrained Cities in the US
Source: Hoyt Advisory Services, Dinn Focused Marketing, Inc. and Whitegate Real Estate Advisors, LLC, 2017
The rate of natural migration of older properties to more affordable levels has decreased in many parts of the country. Between 2006 and 2016, the lowest-cost rental stock shrank by over 10% in 153 of the nation’s 381 metros and by more than 20% in 89 metros (JCHS 2018). With a population growing by 2.2 million people per year, inclusive of both domestic births and net immigration, the United States will need to add approximately 328,000 rental units annually to meet overall housing demands
Metro Market
New Units Needed
2017 - 2030 Rank Atlanta, GA 170,095 5 Austin, TX 114,076 10 Boston, MA 66,109 19 Charlotte, NC 71,523 17 Dallas-Ft. W orth, TX 266,296 2 Denver, CO 55,801 20 Houston, TX 214,176 3 Las Vegas, NV 87,280 12 Los Angeles, CA 164,201 6 Miami-Ft. Lauderdale, FL 185,414 4 Minneapolis, MN 70,783 18 New York, NY 278,634 1 Orlando, FL 130,177 8 Phoenix, AZ 150,302 7 Raleigh, NC 74,323 13 San Diego, CA 72,775 15 San Francisco, CA 71,668 16 Seattle, W A 98,228 11 Tampa, FL 72,933 14 W ashington, DC 127,962 9
A Development Perspective on Creating Workforce Rental Housing Proximal to Major Employment Centers|15 (Miller et al. 2017). This is a level that has only been reached once in the past 30 years. The above table shows how many units are needed by city as of a 2017 report prepared for the National Multifamily Housing Council and the National Apartment Association. Many of these metros are the typical supply-constrained coastal markets, while others represent the fastest growing cities in the nation.
Urban Migration
Since the beginning of civilization, human populations have become increasingly condensed. Prior to the Agricultural Revolution about 10,000 years ago, people operated in small tribal bands of up to 150 that were nomadic in nature and followed food sources wherever they were available. When early humans developed the technology to harness water, grow their own crops, and breed livestock for consumption, permanent villages began to form and expand in size. Similar trends have continued in contemporary society, albeit for different reasons. Today’s urbanization is driven by demand for access to education, competition for talent in the job market, the expanding role of technology, and overall convenience, among others. Cities must attract businesses that will bolster local GDP by creating vibrant communities that draw creative, educated workers.
According to the United Nations, 55% of the global population currently lives in cities. This figure is expected to grow to 68% by 2050. In the United States alone, 82% of people live in an urban environment (Frem, Rajadhyaksha, and Woetzel 2018). The percentage of the American population that lives in cities may be approaching a plateau, but many metro areas are still expected to see population expansion over the next 10 to 15 years (Miller et al. 2017). While cities like Cleveland, Detroit, and Pittsburgh are expected to have little to no population growth over the next couple decades, places like Miami-Ft. Lauderdale, Phoenix, and Atlanta are expected to have substantial growth. Cities losing residents are former manufacturing capitals that have failed to adapt and attract the new wave of technological talent. Many of the fastest growing cities represent technological hubs that attract innovative companies and workers with a college education or above.
The wave of innovation, whether it be technological, financial, or scientific, has a profound effect on the growth of cities through a phenomenon known as the “multiplier effect” (Moretti 2012). The multiplier effect essentially says that for every job created in a local economy, some number of other jobs follow depending on factors such as wage and productivity. As a rule of thumb, a job that commands a higher salary has a larger multiplier effect because the worker has more disposable income to spend on local goods and services. Such local services cannot exist if people have no money to spend on them. One new job in traditional manufacturing, for example, creates an additional 1.6 jobs in local services, such as baristas, yoga instructors, and mechanics. On the other hand, jobs in innovation, such as software engineers at Apple, create 5 additional service jobs in the local economy because these workers consume more. Furthermore, these additional jobs support a diverse set of workers including doctors, lawyers, waitresses, and store clerks. Not only do innovation jobs create demand for such services, they also raise the incomes of all workers in the local economy. Companies that attract skilled workers have the effect of attracting other productive companies within the same sector, as cross collaboration and a deep talent pool are highly desired. The economic explosion of Silicon Valley over the past few decades is a prime example. It’s evident why cities across the country fawned over Amazon’s recent announcement to open a second headquarters; the influx of talented workers would increase demand for additional local services, thereby creating even more jobs and expanding the winning city’s economic footprint.
A Development Perspective on Creating Workforce Rental Housing Proximal to Major Employment Centers|16 When a city attracts companies whose workers have plenty of disposable income, this is a strong indicator of positive population trends and an additional need for workforce housing. Population growth is inclusive of a natural increase, or births minus deaths, and net immigration. Texas is projected to grow especially rapidly, as Austin, Dallas, Houston, and San Antonio are all among the 20 fastest growing cities in the country. Together, those four cities are expected to add nearly 400,000 residents by 2030 (Miller et al. 2017). As people continue to move to cities, additional strains will be placed on urban housing markets. With a finite supply of land, movement into urban centers will increase demand for city living, thereby increasing land values, raising rents, and displacing residents that can’t afford to keep up with rising housing costs.
Figure 5: Fastest Growing Cities in the US
Source: Hoyt Advisory Services, Dinn Focused Marketing, Inc. and Whitegate Real Estate Advisors, LLC, 2017
The Time and Cost of Commuting
According to the US Census Bureau, approximately 130 million people across the country commute to work, the majority by car. Average commute times have grown by 20% since 1980, and the trend is only going up. The fastest growing commuter class is those that spend at least 90 minutes getting to work every day. This is a trend that isn’t restricted to the most expensive cities in the country; 75% of metropolitan areas have seen a spike in commutes longer than 90 minutes. For example, the percentage of workers in Rhode Island that spend more than 90 minutes commuting daily has risen 40% in recent years. Additionally, a University of Minnesota study found that the number of schoolteachers who devote that much time to commuting has gone up 26% from 2002 to 2015 (Borrelli 2019). Moving further away to save on housing isn’t always an option as many communities have expressed NIMBY attitudes and passed zoning laws that restrict the type of mixed-income housing that service workers can afford.
Metro Market Natural Increase Net Migration Total Rank
Atlanta, GA 34.0 90.9 124.9 3 Austin, TX 19.7 45.6 65.3 10 Charlotte, NC 9.9 56.6 66.5 9 Dallas-Ft. Worth, TX 60.7 91.0 151.7 1 Denver, CO 15.6 20.2 35.8 19 Houston, TX 63.8 72.8 136.6 2 Las Vegas, NV 11.3 49.1 60.4 11 Los Angeles, CA 84.4 -3.2 81.2 7 Miami-Ft. Lauderdale, FL 12.0 102.0 114.0 5 Minneapolis, MN 20.8 18.5 39.3 18 New York, NY 98.9 -31.7 67.2 8 Orlando, FL 11.4 71.8 83.2 6 Phoenix, AZ 28.0 91.1 119.1 4 Raleigh, NC 8.9 46.7 55.6 13 Riverside, CA 32.7 2.6 35.3 20 San Antonio, TX 17.2 25.0 42.2 17 San Francisco, CA 22.4 20.8 43.2 16 Seattle, WA 20.5 33.5 54.0 14 Tampa, FL -3.3 56.1 52.8 15 Washington, DC 44.6 12.2 56.8 12
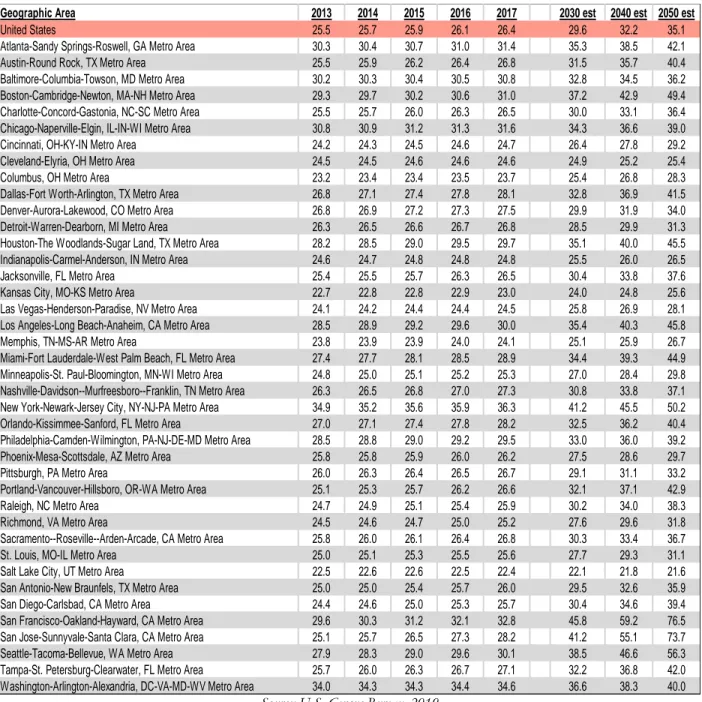
A Development Perspective on Creating Workforce Rental Housing Proximal to Major Employment Centers|17 The United States Census Bureau annually conducts their American Community Survey in which they collect data on a variety of social, economic, housing, and demographic topics by metro area. One of the data points covered is mean one-way travel time to work for workers 16 years and over. In 2009 the United States mean was 25.2 minutes, compared to 26.4 minutes in 2017 (U.S. Census Bureau 2019a). This may seem like a relatively inconsequential increase over an 8-year period, but it’s clear that commute times are getting longer. When drilling down to populous urban areas, the growth starts to become a bit more noticeable. Between 2013 and 2017, one-way commute times in Seattle, San Jose, Portland, and Miami-Ft. Lauderdale grew by 2.2, 3.1, 1.5, and 1.5 minutes, respectively.
Figure 6: Average One-Way Commute Times in Minutes by Metro
Source: U.S. Census Bureau, 2019
Geographic Area 2013 2014 2015 2016 2017 2030 est 2040 est 2050 est
United States 25.5 25.7 25.9 26.1 26.4 29.6 32.2 35.1
Atlanta-Sandy Springs-Roswell, GA Metro Area 30.3 30.4 30.7 31.0 31.4 35.3 38.5 42.1
Austin-Round Rock, TX Metro Area 25.5 25.9 26.2 26.4 26.8 31.5 35.7 40.4
Baltimore-Columbia-Towson, MD Metro Area 30.2 30.3 30.4 30.5 30.8 32.8 34.5 36.2
Boston-Cambridge-Newton, MA-NH Metro Area 29.3 29.7 30.2 30.6 31.0 37.2 42.9 49.4
Charlotte-Concord-Gastonia, NC-SC Metro Area 25.5 25.7 26.0 26.3 26.5 30.0 33.1 36.4
Chicago-Naperville-Elgin, IL-IN-WI Metro Area 30.8 30.9 31.2 31.3 31.6 34.3 36.6 39.0
Cincinnati, OH-KY-IN Metro Area 24.2 24.3 24.5 24.6 24.7 26.4 27.8 29.2
Cleveland-Elyria, OH Metro Area 24.5 24.5 24.6 24.6 24.6 24.9 25.2 25.4
Columbus, OH Metro Area 23.2 23.4 23.4 23.5 23.7 25.4 26.8 28.3
Dallas-Fort Worth-Arlington, TX Metro Area 26.8 27.1 27.4 27.8 28.1 32.8 36.9 41.5
Denver-Aurora-Lakewood, CO Metro Area 26.8 26.9 27.2 27.3 27.5 29.9 31.9 34.0
Detroit-Warren-Dearborn, MI Metro Area 26.3 26.5 26.6 26.7 26.8 28.5 29.9 31.3
Houston-The Woodlands-Sugar Land, TX Metro Area 28.2 28.5 29.0 29.5 29.7 35.1 40.0 45.5
Indianapolis-Carmel-Anderson, IN Metro Area 24.6 24.7 24.8 24.8 24.8 25.5 26.0 26.5
Jacksonville, FL Metro Area 25.4 25.5 25.7 26.3 26.5 30.4 33.8 37.6
Kansas City, MO-KS Metro Area 22.7 22.8 22.8 22.9 23.0 24.0 24.8 25.6
Las Vegas-Henderson-Paradise, NV Metro Area 24.1 24.2 24.4 24.4 24.5 25.8 26.9 28.1
Los Angeles-Long Beach-Anaheim, CA Metro Area 28.5 28.9 29.2 29.6 30.0 35.4 40.3 45.8
Memphis, TN-MS-AR Metro Area 23.8 23.9 23.9 24.0 24.1 25.1 25.9 26.7
Miami-Fort Lauderdale-West Palm Beach, FL Metro Area 27.4 27.7 28.1 28.5 28.9 34.4 39.3 44.9
Minneapolis-St. Paul-Bloomington, MN-WI Metro Area 24.8 25.0 25.1 25.2 25.3 27.0 28.4 29.8
Nashville-Davidson--Murfreesboro--Franklin, TN Metro Area 26.3 26.5 26.8 27.0 27.3 30.8 33.8 37.1
New York-Newark-Jersey City, NY-NJ-PA Metro Area 34.9 35.2 35.6 35.9 36.3 41.2 45.5 50.2
Orlando-Kissimmee-Sanford, FL Metro Area 27.0 27.1 27.4 27.8 28.2 32.5 36.2 40.4
Philadelphia-Camden-Wilmington, PA-NJ-DE-MD Metro Area 28.5 28.8 29.0 29.2 29.5 33.0 36.0 39.2
Phoenix-Mesa-Scottsdale, AZ Metro Area 25.8 25.8 25.9 26.0 26.2 27.5 28.6 29.7
Pittsburgh, PA Metro Area 26.0 26.3 26.4 26.5 26.7 29.1 31.1 33.2
Portland-Vancouver-Hillsboro, OR-WA Metro Area 25.1 25.3 25.7 26.2 26.6 32.1 37.1 42.9
Raleigh, NC Metro Area 24.7 24.9 25.1 25.4 25.9 30.2 34.0 38.3
Richmond, VA Metro Area 24.5 24.6 24.7 25.0 25.2 27.6 29.6 31.8
Sacramento--Roseville--Arden-Arcade, CA Metro Area 25.8 26.0 26.1 26.4 26.8 30.3 33.4 36.7
St. Louis, MO-IL Metro Area 25.0 25.1 25.3 25.5 25.6 27.7 29.3 31.1
Salt Lake City, UT Metro Area 22.5 22.6 22.6 22.5 22.4 22.1 21.8 21.6
San Antonio-New Braunfels, TX Metro Area 25.0 25.0 25.4 25.7 26.0 29.5 32.6 35.9
San Diego-Carlsbad, CA Metro Area 24.4 24.6 25.0 25.3 25.7 30.4 34.6 39.4
San Francisco-Oakland-Hayward, CA Metro Area 29.6 30.3 31.2 32.1 32.8 45.8 59.2 76.5
San Jose-Sunnyvale-Santa Clara, CA Metro Area 25.1 25.7 26.5 27.3 28.2 41.2 55.1 73.7
Seattle-Tacoma-Bellevue, WA Metro Area 27.9 28.3 29.0 29.6 30.1 38.5 46.6 56.3
Tampa-St. Petersburg-Clearwater, FL Metro Area 25.7 26.0 26.3 26.7 27.1 32.2 36.8 42.0
A Development Perspective on Creating Workforce Rental Housing Proximal to Major Employment Centers|18 To truly appreciate the gravity of this trend, we can estimate how long commutes will be 10, 20, and 30 years from now. The above chart uses a simple annualized growth rate calculated using the change in commute times from 2013 to 2017 to estimate what one-way commutes in major cities throughout the country will look like in 2030, 2040, and 2050. Whether this trend will be linear depends on several factors, some more predictable than others, but this is a reasonable projection given population growth trends and existing infrastructure. The results show that by 2050 Bay Area (CA) commutes will more than double and New York City workers will spend an additional 120 hours in round trip transit per year.
Greater Boston Case Study
Basic economic theory states that housing costs decline as you move further away from the central business district of a city. With this added distance, however, workers must pay more in transportation costs and consider the opportunity cost of their time spent commuting. Moving further away to save on housing costs doesn’t necessarily create a net savings at the end of the day. The cost of housing and transportation in the Greater Boston area can provide some valuable insight to this tradeoff. The graph below shows the additive cost of rent and transportation to downtown Boston for several popular commuter suburbs. Places such as Haverhill, Marlborough, and Lawrence yield a clear dollar savings on the cost of housing and transportation, but the daily commutes are around four times longer.
Figure 7: Average Rental Housing Cost and Commute Times in Greater Boston
Source: Zumper, Massachusetts Bay Transit Authority, 2019
The median 2-bedroom apartment in Boston rented for $2,850 per month as of June 2019 (Zumper 2019). The same apartment rented for an average of $2,100 in Framingham, a prominent commuter town located about 20 miles west of Boston. For a household of four with two full-time working adults with jobs in Boston, each adult must pay $291.50 a month for a Massachusetts Bay Transportation Authority (MBTA) pass to take the commuter rail into the city. Isolating the rent and transportation variables, this family’s total monthly outlay is $2,683. Living in Boston would cost them $3,019 a month, including two monthly LinkPasses priced at $84.50 each. By living in Framingham, this working-class household would save $336 per month, or $4,032 per year.
A Development Perspective on Creating Workforce Rental Housing Proximal to Major Employment Centers|19 To truly assess any savings that this family would experience, we need to consider the extra time that the parents spend getting to and from their jobs, or the opportunity cost of the extended commute. The MBTA trip planner estimates that it takes about 46 minutes on the train during rush hour to get from Framingham Station to Back Bay, a central commuter hub in Boston. We can safely assume that an additional 20 minutes should be added to the commute to account for time getting from their home to the train, and from the train to their office. Each adult therefore spends 2 hours and 12 minutes commuting round trip each day from Framingham, compared to an assumed 40 minutes living in Boston. Using 261 workdays per year and 20 vacation days, this couple spends an extra 739 hours per year commuting.
The $4,032 in savings per year equates to $5.46 per extra hour of commute time – but what does this mean? Consider that the 2019 4-person AMI is $113,300 in the Boston-Cambridge-Quincy, MA-NH HUD Metro FMR Area. With 2,087 working hours per year per adult, the average adult in a dual-income, 4-person household in the Boston area makes $27.14 per hour (US OPM 2019). It would be inaccurate to assume that there could be a one-for-one tradeoff in time spent commuting versus time spent working, but the financial benefit clearly sides with additional time spent on the job. While a useful exercise, this analysis only considers the cost of housing, train passes, and the opportunity cost of lost wages. When you add in the cost of owning a car, a necessity for most families living in the suburbs, any dollar savings are instantaneously wiped away. At that point it essentially becomes cheaper to live in the city.
A Development Perspective on Creating Workforce Rental Housing Proximal to Major Employment Centers|20
Chapter Three: Biggest Impediments
Developers seeking to bring new construction workforce housing to market face a myriad of challenges in today’s environment. Among the challenges affecting multifamily housing developers are rising materials costs, a shortage of skilled labor, and government regulations such as zoning restrictions that vary across and within municipalities. Such challenges have increased the cost of delivering new supply and resulted in development concentration in higher rent markets such as New York, Washington DC, and Seattle. As the rate of urbanization increases, developable land in cities has become increasingly scarce. This shortage of land is especially prevalent in cities like San Francisco, Boston, Seattle, Los Angeles, and New York. In rapidly growing cities, developers are finding it difficult to deliver housing at a price point affordable to middle-income renters due to increased competition for attractive parcels. The cost of land, labor, and materials is about the same whether a developer builds housing that’s workforce or market rate. Developers enter a bidding war in which the winner must cover the elevated cost of acquisition by either obtaining subsidies or charging higher rents. Absent sufficient subsidies, the only way to proceed is to raise the rent, thereby pricing out middle-income households.
Rising Cost of Materials
Generally speaking, rising construction costs for multifamily development result in higher rents. When developers must compensate for increased costs to achieve financial feasibility, tenant affordability suffers. As a result, most new deliveries have been Class A properties that offer limited housing opportunities for low- and middle-income renters even when considering inclusionary development mandates. The aggregate prices of raw and manufactured materials used for residential construction in the United States increased by 4% in 2017. While global demand increases for materials such as copper, aluminum, and diesel fuel are partly to blame, international trade wars and tariff policies on imports have had a particularly adverse effect on the price of building materials in the United States. Trade wars and tariff policies have raised costs outright and led to construction delays, ultimately impacting the end users.
The Associated General Contractors of America (AGC) releases statistics monthly that show percentage changes in costs for many processed and unprocessed goods used in construction, and the recent data is forthtelling about the issues facing the industry. Diesel fuel costs increased by 21%, 41%, and 5% in 2016, 2017, and 2018 respectively. Costs for asphalt felts and coatings, a key component in tar roofing and siding products, grew by 11% in 2018. Precast concrete, insulation materials, and architectural coatings costs grew by 6%, 5%, and 7%, respectively, in 2018. Many metals showed double-digit cost increases in 2018, with steel component costs rising by nearly 20%. The chart below shows many of these line items in detail (ACG 2019a). While some material costs decreased in 2018, most have been on a steady upward trajectory for the past five calendar years.
A Development Perspective on Creating Workforce Rental Housing Proximal to Major Employment Centers|21 Figure 8: Annual Percentage Cost Changes for Construction Materials
Source: The Associated General Contractors of America, 2019
In July 2018, the Department of Commerce, as directed by President Trump, announced that it would levy tariffs on $200 billion worth of imports from China. The list of imports included material inputs that are vital to the construction of residential properties; 463 of them are commonplace in both new construction and remodeling. Data from the International Trade Commission and Bureau of Economic Analysis shows that $10 billion worth of goods used in residential construction are subject to these tariffs. Of particular interest, the new trade policy imposed tariffs on steel and aluminum imports of 25% and 10%, respectively. A study conducted by the NAHB Economics and Housing Policy Group estimated that the homebuilding industry could expect a $2.5 billion cost increase over
Changes in PPIs for processed goods important to construction 2014 2015 2016 2017 2018
#2 diesel fuel -26.9 -43.1 21.4 40.9 5.0
Paving mixtures and blocks (asphalt) 2.5 -6.5 -5.6 -0.4 10.2
Asphalt felts and coatings 2.4 -4.7 -1.9 2.2 10.6
Prepared asphalt & tar roofing & siding products 2.5 -2.1 -1.0 1.6 10.9
Cement 5.7 6.5 5.0 4.3 2.8
Concrete products 5.1 2.9 3.1 2.9 3.5
Concrete block and brick 3.2 1.9 2.0 2.9 3.4
Concrete pipe 3.2 2.8 2.2 0.5 -0.6
Ready-mixed concrete 5.5 3.7 3.7 3.1 3.1
Precast concrete products 6.5 1.7 0.5 3.5 6.0
Prestressed concrete products 2.3 -0.9 11.1 1.9 4.3
Brick and structural clay tile 1.4 1.3 1.0 1.7 1.2
Plastic construction products 1.6 0.8 -0.1 4.7 2.7
Flat glass 2.4 5.3 3.1 1.1 1.3
Gypsum products 5.1 0.1 7.9 5.8 2.9
Insulation materials 2.5 0.5 3.1 1.2 5.1
Lumber and plywood 3.3 -7.9 3.6 11.2 -4.4
Architectural coatings 0.9 -2.8 0.9 2.6 7.2
Steel mill products 0.7 -19.4 8.6 7.5 18.5
Steel pipe and tube 0.0 -16.1 5.4 10.2 21.3
Copper and brass mill shapes -4.5 -19.3 21.1 9.0 -5.6
Aluminum mill shapes 10.9 -14.0 5.5 10.1 6.3
Sheet metal products 2.5 -1.5 2.2 2.2 6.7
Fabricated structural metal 1.4 -3.3 2.3 3.5 12.0
Fabricated structural metal bar joists & rebar 2.5 0.1 4.9 -0.5 12.2
Fabricated structural metal for non-industrial buildings 2.2 0.5 4.0 -1.3 13.1
Fabricated structural metal for bridges 5.8 -7.5 -7.0 -0.4 15.0
Ornamental and architectural metal work 3.1 0.1 2.2 3.5 12.4
Fabricated steel plate 1.4 -1.3 0.2 1.4 2.1
Prefabricated metal buildings 3.6 -2.0 4.8 3.1 11.7
Construction machinery and equipment 1.6 1.2 0.9 0.9 3.4
Truck & bus (incl. off-the-highway) pneumatic tires -4.3 -4.2 2.7 1.8 2.5
Changes in PPIs for unprocessed goods important to construction 2014 2015 2016 2017 2018
Asphalt (at refinery) 5.2 -45.5 -9.8 28.3 23.2
Construction sand/gravel/crushed stone 3.3 4.6 2.3 4.2 4.1
Iron and steel scrap -16.9 -50.8 63.7 18.5 13.8
Stainless and alloy steel scrap -4.5 -35.7 30.3 3.9 -13.0
Copper base scrap -11.9 -28.4 11.0 17.5 -9.0
A Development Perspective on Creating Workforce Rental Housing Proximal to Major Employment Centers|22 the year following the announcement (Logan 2018). As a result, of these actions, imports of building materials declined by more than 20% year over year as of January 2019, a stark contrast to the typical 15% increase seen at that time each year. Trade talks with China have been going back and forth, but even speculation on what may happen next has continued to strain the cost of materials affected.
Shortage of Construction Labor
Construction unemployment in the United States is at an all-time low since AGC began tracking the statistic in 2000, indicating the lack of skilled laborers available to fill the growing number of job openings. Other sources even indicate that the unemployment rate in construction is near a 50-year low. The 3.2% unemployment rate as of May 2019 represents 294,000 jobseekers compared to a May 2018 unemployment rate of 4.4%, or 415,000 people. The total number employed is a 12 month increase of 246,000, but still represents 3.6% less than when the sector peaked in April 2006. Contractors in most states increased their workforce in the past year, but economists point out that the number of job openings indicates that they would expand their payrolls even more if they could. As of April 2019, the number of job openings in construction was 360,000, a record setting high for the sector. Although the average pay for such workers is 10% higher than the private sector average, firms have continued to raise their pay and expand their array of benefits to attract a dwindling pool of workers. Despite these concessions, 78% of firms reported difficulty finding salaried and hourly craft workers that possess the necessary skills (ACG 2019b).
Factors driving the labor shortage include a significant loss of workers during the most recent recession, an aging population, and a lack of appeal to millennials. By some estimates, 600,000 workers left the industry for other sectors, including healthcare and social work, and never returned. When there’s a shortage of labor, projects take longer to build and bid contracts become more expensive. While a city may have a strong demand for additional housing, a finite supply of skilled workers means that developers must either get in line or outbid for quality labor. An investment on behalf of the public sector in technical education programs would go a long way in exposing young workers to the benefits of working in construction and ultimately decrease the cost of housing production.
Government Regulation
Developers are well aware of the laundry list of regulatory and permitting costs incurred when creating or preserving multifamily housing, but until recently it was difficult to quantify how prohibitive government regulation is with regards to getting projects to pencil out. A recent joint study by the National Association of Home Builders (NAHB) and the National Multifamily Housing Council (NHMC) undertook efforts to determine the incremental cost that government regulations can have on a project. To do this, they surveyed their developer members about recent projects that had been undertaken. Over 90% of multifamily developers incur hard costs related to paying fees to local jurisdictions when applying for zoning relief and obtaining building permits. Applicable fees may also include wetlands permits, stormwater permits, endangered species or critical habitat permits, impact fees, utility hook-ups, and others. Construction delays as a result of lengthy approvals, stringent development standards, changes to building codes, and OSHA requirements also add to a developer’s costs. They must navigate a complex regulatory framework and occasionally deal with overlapping jurisdictions that may have conflicting agendas. The study concluded that regulations across all levels of government account for 32% of the cost of new multifamily development, and that in a quarter of cases this figure can be as high as 43% (NAHB and NMHC 2018).
Zoning is regulated at the local level and stipulates what kind of building can be constructed on a piece of land, including multifamily, industrial, office, hotel, retail, lab, or mixed-use. Zoning ordinances
A Development Perspective on Creating Workforce Rental Housing Proximal to Major Employment Centers|23 regulate details such as building height, density, lot coverage, setbacks, landscaping, and architectural design. Development design standards of a municipality that go beyond what a developer would typically produce account for an average of 6.3% of total development cost. Developers prefer to find land that has already been permitted and is zoned for the intended use so that they can build as-of-right, but this is rarely the case. Most multifamily developments must go through a rezoning process or obtain some type of variance in order to proceed. The costs associated with zoning approval account for 4.1% of total development costs on average and can include studies such as environmental, traffic, archeological, and geotechnical, in addition to the fees paid directly to the local government. Additionally, prohibitive zoning can hamper a developer’s desire to maximize density, thereby limiting the number of new units built.
Sustainability and energy efficiency are worthwhile objectives, but the upfront cost of meeting changing building codes needs to be kept within reason. Energy efficiency measures have the potential to reduce a property’s operating costs, but the installation costs may be too prohibitive to get the project off the ground in some cases. Rodger Brown, Managing Director for Real Estate Development at Preservation of Affordable Housing (POAH), notes that developers can expect a 5% to 7% increase in initial costs when going from LEED to net zero, although it will ultimately drive operating costs down (Brown 2019). Federal agencies such as the Environmental Protection Agency, the Federal Emergency Management Agency, and the Department of Energy all contribute to the development of new building codes. While their intentions are benevolent and seek to solve long-term problems like climate change, the changes to building codes have unintended consequences that limit developers’ flexibility and occasionally fail to improve energy efficiency. When changing building codes exist, they account for an average of 7.2% of total development costs.
Altogether, the costs associated with adhering to government regulation are so prohibitive that they deter many projects in initial underwriting. The ones that do make it to market will have higher rents in order to cover the costs of construction and will be less affordable for all. The lengthy approval process had a particularly adverse effect on one of POAH’s projects in Detroit. Over the 3 years since initial approval, project costs increased by nearly a third and the developer had to go back to the city to reduce the scope, resulting in fewer units (Brown 2019). This isn’t an isolated incident, but one that is unfortunately increasingly common.
Lack of Middle-Income Rental Subsidy Programs
Given the economic challenges of building new construction affordable housing and preserving the existing stock, obtaining funding through federal, state, and local subsidy programs is a highly competitive process. Many of these programs have rounds of funding that occur only a couple times per year, and all of them have a finite amount of resources. When a developer applies for funding and doesn’t make the cut, they either must delay a portion or all of their project until alternative funding can be sourced, wait for the next round of funding, or abandon the project altogether if the carrying costs are too high. By some estimates, public subsidy programs are 5 to 6 times oversubscribed, meaning countless projects that could create valuable affordable units may not be able to proceed. When considering that developers may not even apply for funding if they feel their project won’t be competitive in the scoring process, the shortage of funding becomes even more pronounced. Additional housing stock, no matter the target tenant, generally relieves demand pressure and makes housing more affordable for all. In that regard, it’s important to consider the state of funding for low-income households to gauge availability of potential funding for workforce housing. Increases in funding through federal programs have trailed the growth in the nation’s lowest income renters.
A Development Perspective on Creating Workforce Rental Housing Proximal to Major Employment Centers|24 Between 1987 and 2015, the number of very low-income renters assisted rose by 950,000 while the total pool rose by 6 million (JCHS 2018). The primary rental assistance programs that developers rely upon are the Low-Income Housing Tax Credit (LIHTC) and Housing Choice Vouchers. While these two programs have been very successful with funding housing production and increasing affordability, it’s evident that they can’t solve the problem alone as evidenced by long waitlists at many properties, especially in urban areas. It’s estimated that only one in four households that needs federal housing assistance receive it. HUD’s Worst Case Housing Need report indicated that low-income households with severe income burdens rose from 6 million in 2005 to 8.3 million in 2015, but the number of assisted households rose by only 150,000 over that same time period. State and local governments have attempted to supplement federal funding through bond issuances, real estate transfer taxes, and linkage fees from commercial developments. The National Low Income Housing Coalition estimates that there are about 100 such programs nationally, yet the need for more remains.
When considering the general lack of funding available for affordable housing across the country, the fact that most of the available public subsidy programs target renters with incomes at the lower end of the spectrum, and that most of these programs fail to meet the demand of target renters, the challenge of constructing workforce rental housing becomes readily apparent. Many critics point to this layer of complications as a reason to continue focusing on low-income households before shifting the focus to the middle-income population. In the same vein, additional workforce housing would relieve overall pressure on the housing market and ensure middle-income households don’t take away units designated for those most vulnerable. Asked what the biggest challenge is that developers face when trying to deliver new construction workforce housing, WinnCompanies CEO Gilbert Winn said “the lack of middle-income subsidy programs” without hesitation (2019).