HAL Id: hal-00296278
https://hal.archives-ouvertes.fr/hal-00296278
Submitted on 4 Jul 2007
HAL is a multi-disciplinary open access
archive for the deposit and dissemination of
sci-entific research documents, whether they are
pub-lished or not. The documents may come from
teaching and research institutions in France or
abroad, or from public or private research centers.
L’archive ouverte pluridisciplinaire HAL, est
destinée au dépôt et à la diffusion de documents
scientifiques de niveau recherche, publiés ou non,
émanant des établissements d’enseignement et de
recherche français ou étrangers, des laboratoires
publics ou privés.
climate monitoring: intercomparison with Envisat
MIPAS and GOMOS and different atmospheric analyses
A. Gobiet, G. Kirchengast, G. L. Manney, M. Borsche, C. Retscher, G. Stiller
To cite this version:
A. Gobiet, G. Kirchengast, G. L. Manney, M. Borsche, C. Retscher, et al.. Retrieval of temperature
profiles from CHAMP for climate monitoring: intercomparison with Envisat MIPAS and GOMOS and
different atmospheric analyses. Atmospheric Chemistry and Physics, European Geosciences Union,
2007, 7 (13), pp.3519-3536. �hal-00296278�
www.atmos-chem-phys.net/7/3519/2007/ © Author(s) 2007. This work is licensed under a Creative Commons License.
Chemistry
and Physics
Retrieval of temperature profiles from CHAMP for climate
monitoring: intercomparison with Envisat MIPAS and GOMOS
and different atmospheric analyses
A. Gobiet1,2, G. Kirchengast1,2, G. L. Manney3,4, M. Borsche1,2, C. Retscher5, and G. Stiller6
1Wegener Center for Climate and Global Change, University of Graz, Austria 2Institute for Geophysics, Astrophysics, and Meteorology, University of Graz, Austria 3Jet Propulsion Laboratory, California Institute of Technology, CA, USA
4New Mexico Institute of Mining and Technology, NM, USA 5ESA/ESRIN, Frascati, Italy
6Institut f¨ur Meteorologie und Klimaforschung, Forschungszentrum Karlsruhe, Germany
Received: 13 December 2006 – Published in Atmos. Chem. Phys. Discuss.: 27 February 2007 Revised: 31 May 2007 – Accepted: 18 June 2007 – Published: 4 July 2007
Abstract. This study describes and evaluates a Global
Nav-igation Satellite System (GNSS) radio occultation (RO) re-trieval scheme particularly aimed at delivering bias-free at-mospheric parameters for climate monitoring and research. The focus of the retrieval is on the sensible use of a pri-ori information for careful high-altitude initialisation in or-der to maximise the usable altitude range. The RO re-trieval scheme has been meanwhile applied to more than five years of data (September 2001 to present) from the German CHAllenging Minisatellite Payload for geoscientific research (CHAMP) satellite. In this study it was validated against various correlative datasets including the Michelson Inter-ferometer for Passive Atmospheric Sounding (MIPAS) and the Global Ozone Monitoring for Occultation of Stars (GO-MOS) sensors on Envisat, five different atmospheric analy-ses, and the operational CHAMP retrieval product from Ge-oForschungsZentrum (GFZ) Potsdam. In the global mean within 10 to 30 km altitude we find that the present valida-tion observavalida-tionally constrains the potential RO temperature bias to be <0.2 K. Latitudinally resolved analyses show bi-ases to be observationally constrained to <0.2–0.5 K up to 35 km in most cases, and up to 30 km in any case, even if severely biased (about 10 K or more) a priori information is used in the high altitude initialisation of the retrieval. No evi-dence is found for the 10–35 km altitude range of residual RO bias sources other than those potentially propagated down-ward from initialisation, indicating that the widely quoted RO promise of “unbiasedness and long-term stability due to intrinsic self-calibration” can indeed be realised given care in the data processing to strictly limit structural uncertainty. Correspondence to: A. Gobiet
(andreas.gobiet@uni-graz.at)
The results thus reinforce that adequate high-altitude initiali-sation is crucial for accurate stratospheric RO retrievals. The common method of initialising, at some altitude in the upper stratosphere, the hydrostatic integral with an upper bound-ary temperature or pressure value derived from meteorolog-ical analyses is prone to introduce biases from the upper boundary down to below 25 km. Also above 30 to 35 km, GNSS RO delivers a considerable amount of observed infor-mation up to around 40 km, which is particularly interesting for numerical weather prediction (NWP) systems, where di-rect assimilation of non-initialised observed RO bending an-gles (free of a priori) is thus the method of choice. The results underline the value of RO for climate applications.
1 Introduction
The Global Navigation Satellite System (GNSS) radio oc-cultation (RO) technique (e.g., Kursinski et al., 1997) is an active satellite-to-satellite limb sounding concept using GNSS signals to probe the atmosphere. It provides atmo-spheric parameters like refractivity, geopotential height (or pressure), and temperature with high vertical resolution (0.5 to 1.5 km), high accuracy (<1 K), long-term stability, virtual all-weather capability (insensitivity to clouds), and global coverage over an altitude range from the lower troposphere to the upper stratosphere showing best performance in the up-per troposphere-lower stratosphere region (5 to 35 km) (e.g., Steiner and Kirchengast, 2005). A key asset of the RO technique for climate applications is its traceability to the most reliable and accurate calibration standard available, the S.I. (Syst`eme International d’Unit´es) definition of the second
(Leroy et al., 2006), which enables long-term stability with-out need for instrument or satellite inter-calibration, usually termed “self-calibration” property of RO.
Owing to these characteristics the RO technique is a unique new data source for atmospheric and climate sciences. Particularly the high vertical resolution and accuracy in re-gions where so far predominantly rather low vertical res-olution satellite-based data from nadir looking instruments are available (e.g., over remote oceanic areas and in polar regions) opens new possibilities for the evaluation and ad-vancement of analyses and forecasts of numerical weather prediction (NWP) systems (e.g., Gobiet et al., 2005; Healy et al., 2005; Borsche et al., 2007; Healy and Th´epaut, 2006) and for stratospheric process studies (e.g., Alfred et al., 2006). In addition, its “self-calibrating” nature makes it ideal for pro-viding benchmark datasets for the validation of other remote sensing systems (Schroeder et al., 2003; Wang et al., 2004, 2005; Steiner et al., 20071) the evaluation and advancement of climate models (Goody et al., 1998; Leroy et al., 2006) and for climate monitoring in general (Foelsche et al., 2005, 2006).
Evaluation studies showed that RO temperatures are gen-erally derived with an accuracy of better than 1 K (e.g., Hajj et al., 2002; Wickert et al., 2004; Steiner et al., 2004) though it has also been found that RO retrieval results of major pro-cessing centres show, compared to other remote sensing in-struments, radiosondes, and amongst themselves, biases ex-ceeding 1 K above 25 km (e.g., Wang et al., 2004; Wickert et al., 2004; von Engeln, 2006) which is mainly due to the methodology of integrating a priori information in the high-altitude initialisation of the retrieval process as will be dis-cussed in this study. Biases induced by downward propa-gated a priori information are a particular concern for cli-mate applications like, e.g., long-term trend studies, since a priori data (often meteorological analyses) are on one hand particularly prone to model errors due to sparse observational data at high altitudes, and on the other hand they are far from long-term stable due to frequent model, observational data, and data assimilation system changes and improvements. Systematic changes in the a priori information could there-fore severely degrade the basic self-calibrating nature of RO measurements by introducing artificial trends down into the lower stratosphere below 30 to 35 km. It is thus of high im-portance to maximise the altitude range of unbiased RO data upwards by as adequate data processing as possible (Gobiet and Kirchengast, 2004; Steiner and Kirchengast, 2005).
This study proceeds as follows: In Sect. 2 the developed operational RO retrieval scheme for data from the German CHAllenging Minisatellite Payload for geoscientific research (CHAMP) satellite, with particular focus on the requirements
1Steiner, A. K., Kirchengast, G., Borsche, M., Foelsche, U., and Schoengassner, T.: A multi-year comparison of lower strato-spheric temperatures from CHAMP radio occultation data with MSU/AMSU records, J. Geophys. Res., revised, 2007.
of climate monitoring and bias minimisation at high alti-tudes, is described. The subsequent validation of the per-formance of this retrieval scheme in Sects. 3 and 4 is based on a broad range of correlative data sources including Envisat limb sounding instruments, various NWP analyses, and a dif-ferent RO retrieval scheme. This provides a reliable basis for the summary and conclusions in Sect. 5, where the biases (upper bounds) are summarised based on the intercompari-son results and the conclusions are drawn.
2 Retrieval of RO temperature profiles
The presented retrieval scheme (CHAMPCLIM Retrieval, CCR) aims at optimal exploitation of RO data for climate research with a particular focus on avoidance of systematic errors and eventual drifts by minimising the influence of a priori information used for initialising the retrieval at high altitudes (upper stratosphere upwards) as a potential source of temporarily inhomogeneous biases. A related aim is to minimise the amount of background information entering the retrieval process and to make the influence of the background information traceable. Based on these measures, CCR aims to extend the altitude range of reliable, accurate retrieval re-sults (currently up to about 25 km; see Sect. 4; Wang et al., 2004; Wickert et al., 2004; von Engeln, 2006) towards the upper stratosphere (up to about 35 km). The development of the algorithmic basis and careful performance assessment via end-to-end simulation studies by Gobiet and Kirchen-gast (2004) and Steiner and KirchenKirchen-gast (2005) have demon-strated that this improvement potential exists.
The described CCR scheme is currently applied to data from the first satellite providing RO measurements on a longer term, CHAMP (Wickert et al., 2001, 2004), and is the basis for the first RO-based multi-year temperature cli-matology, which has been developed in the framework of the CHAMPCLIM project (Foelsche et al., 2005, 2006), a coop-eration of the Wegener Center, University of Graz, Austria and the GeoForschungsZentrum (GFZ) Potsdam, Germany. 2.1 Basic RO retrieval
The basic CCR scheme developed and applied here is a so-called dry air retrieval scheme. It is briefly summarised here; a detailed treatment of basic RO retrieval techniques is given in a review-type manner by Kursinski et al. (1997) and Hajj et al. (2002). The primary observables of RO measurements are phase delays of GNSS signals, i.e., the consequences of deceleration of electromagnetic wave’s phase velocities by the atmosphere. Doppler shifts and subsequently the total bending angle (α) and impact parameter (a) of an occulta-tion ray are deduced from phase delays involving transmit-ter and receiver orbit data using geometric optics and local spherical symmetry assumptions. Using GNSS signals from the Global Positioning System (GPS), two different carrier
frequencies are available, which allow to remove large parts of the dispersive ionospheric contribution to the signal by linear combination of bending angles of both frequencies (Vorob’ev and Krasil’nikova, 1994). The refractive index of the neutral atmosphere (n) can then be derived via the inverse Abel transform (Fjeldbo et al., 1971),
n(a) = exp 1 π ∞ Z a α(a′) √ a′2− a2da ′ , (1)
from which refractivity as a function of height, N (z), is obtained via the relation N (a)=106(n(a)−1) and
z(a)=a/n(a)−RC. RCis the radius of curvature of the Earth
along the occultation plane (Syndergaard, 1998). Refractiv-ity is related to atmospheric pressure (p), temperature (T ), and the partial pressure of water vapour (pw) via
N = k1
p T + k2
pw
T2, (2)
where k1 and k2 are constants (k1=77.60 K/hPa,
k2=3.73·105K2/hPa; e.g., Bevis et al., 1994).
Using the refractivity equation (Eq. 2), the hydrostatic equation, the equation of state, and the gravity formula, at-mospheric parameters can be derived. For example, dry pres-sure pd(z) (which equals the total air pressure p(z) if
humid-ity can be neglected, i.e., above the middle troposphere) is obtained via hydrostatic integration,
pd(z) = Md k1R ∞ Z z g(z′)N (z′)dz′, (3)
where R is the universal gas constant (8.3145·103 JK−1kg−1), Md is the molar mass of dry air (28.964 kg
kmol−1), and g(z′) is the acceleration of gravity. Dry
tem-perature (which, similarly to dry pressure, absorbs the effect of water vapour) is then obtained as
Td(z) = k1
pd(z)
N (z). (4)
We note that if the air is sufficiently moist so that humid-ity cannot be neglected, as is typically the case in the lower and middle troposphere, then temperature and water vapour can only be retrieved separately if a priori information on at least one of the two parameters is available (e.g., Kursinski et al., 1997; Healy and Eyre, 2000). This moist air retrieval, a part of the CCR follow-on retrieval scheme at the Wegener Center, is not further treated here since the lower and middle troposphere is below our analysis domain limited to above 10 km in this study. We thus exclusively regard dry tempera-ture as defined above, assuming the contribution of the water vapour to be negligible, which is generally a very good as-sumption above 10 km (e.g., Gobiet, 2005).
2.2 High-altitude initialisation and statistical optimisation The integrate formulae, Eqs. (1) and (3), are crucial links in the RO retrieval chain. Equation (1) indicates that the inversion of bending angles leads to downward propaga-tion of high altitude errors. Due to the localised kernel (a’2−a2)−1/2of the inverse Abel transform, this vertical cor-relation is limited in N (z) but further and stronger error prop-agation occurs in the hydrostatic integration, Eq. (3). A de-tailed theoretical analysis of this error propagation has been performed by Rieder and Kirchengast (2001). It is thus vital to use adequate bending angles also at altitudes above any height of interest. On the other hand, since atmospheric den-sity decreases exponentially with height and residuals from the ionospheric correction significantly disturb the RO sig-nal above about 45 km, the high-altitude sigsig-nal-to-noise ratio (SNR) is low. Without careful initialisation of the two inte-grals, errors in temperature profiles may propagate down to 20 km or even below (Gobiet and Kirchengast, 2004), which are altitudes generally considered to be “optimal” for RO re-trieval performance.
To cope with this problem, usually both integrals in Eqs. (1) and (3) are initialised by some kind of a priori infor-mation about the atmosphere at high altitudes. The standard approach, inherited from planetary occultation (e.g., Fjeldbo et al., 1971), is to independently initialise both integrals. The Abel transform is often initialised by extrapolating the bend-ing angle profile exponentially (e.g., Kursinski et al., 1997). Since the resulting refractivity profile usually lacks quality at high altitudes, the hydrostatic integral is again initialised at some fixed altitude between 30 and 50 km with temperature (or pressure) upper boundary “guess” value (e.g., Kursinski et al, 1997; Hajj et al., 2004; Wickert et al., 2004), usu-ally derived from a meteorological analysis. A modifica-tion of the extrapolamodifica-tion approach is statistical optimisamodifica-tion (Sokolovskiy and Hunt, 1996), which optimally (in a least-squares error sense) combines the retrieved bending angle profile with a background profile from a climatology or a meteorological analysis, taking into account the error charac-teristics of both profiles (see Gobiet and Kirchengast (2004) for details). Usually, the hydrostatic integral is subsequently still initialised as described above.
Steiner and Kirchengast (2005) have, in the context of an error analysis based on ensembles of GNSS RO profiles from end-to-end simulations, discussed the weakness of the dou-ble initialisation approach and found: “Regarding the clima-tological use of geopotential heights and temperature this ap-proach is problematic, since it leads to intricate error char-acteristics and a priori dependence in the stratospheric data down to about 20 km, which threats the crucial aims of un-biasedness and a clear understanding of the degree of resid-ual biasedness.” Gobiet and Kirchengast (2004) presented a retrieval scheme avoiding the 2nd initialisation by using full downward integration of the hydrostatic integral from 120 km in order to eliminate these problems and the related
Table 1. Overview of the CHAMPCLIM retrieval (CCR) scheme, dry air.
Early outlier rejection “3σ ” outlier rejection on 50 Hz sampling rate L1 and L2 phase delay data, based on a one-second moving window over the profile.
Phase delay smoothing Smoothing of 50 Hz phase delay profiles using regularization (third order norm, regularization parameter = 105, following Syndergaard, 1999).
Bending angle retrieval Geometric optics retrieval (e.g., Kursinski et al., 1997) at both L1 and L2 frequencies.
Ionospheric correction Linear combination of L1 and L2 bending angles (Vorob’ev and Krasil’nikova, 1994). Correction is applied to low-pass filtered bending angles (1 km moving average), L1 high-pass contribution is added after correction (Hocke et al., 2003). L2 bending angles <15 km derived via L1-L2 extrapolation.
Statistical optimisation of bending angles
Statistical optimisation of bending angles between 30 and 120 km. Vertically correlated back-ground (corr. length = 6 km) and observation (corr. length = 1 km) errors. Observation error estimated from observed variance of observed profile >65 km. Background error: 15%. Back-ground information: collocated profile derived from ECMWF operational analysis (T42L60; resp. T42L91 as of 01/02/2006). Above ∼60 km: MSISE-90 (Hedin, 1991). Optional: MSISE-90 climatology as background profiles search library (following Gobiet and Kirchengast, 2004). Abel transform Numerical integration over bending angle (Simpson’s trapezoidal rule) from each height (impact
parameter) to 120 km. Impact parameter to height conversion with radius of curvature at mean tangent point location following Syndergaard (1998).
Hydrostatic integral initialisation No initialisation below 120 km. At 120 km: pressure = pressure (MSISE-90).
Lower cut-off altitude The lowermost altitude, where retrieved data is kept, is set to the altitude, where severe impact parameter ambiguities occur (impact parameter increase >0.2 km from one data point to the next downwards).
External quality control (for outlier profiles)
Refractivity 5 km–35 km: 1N/N<10%; Temperature 8 km–25 km: 1T<20 K. Reference: collo-cated ECMWF operational analysis profiles (T42L60 resp. T42L91 as of 01/02/2006).
Reference frame, vertical coordinate Earth figure: WGS-84 ellipsoid; Vertical coordinate: mean-sea-level (MSL) altitude; conversion of ellipsoidal height to MSL altitude (at mean tangent point location) via EGM-96 geoid smoothed to 2◦×2◦resolution.
over-accentuation of a priori information in the retrieval. Following these findings we use in the CCR scheme a sta-tistical optimisation approach that introduces background in-formation exclusively to the bending angles, yielding high-quality refractivity profiles up to high altitudes so that effec-tively no “2nd initialisation” is needed to initialise the hydro-static integral subsequently. This follows from the fact that the initialisation of the hydrostatic integral with zero pres-sure at 120 km, compared to initialisation with prespres-sure from the MSISE-90 climatology, has no noticeable effect on the retrieved temperature profiles at any height of interest below the stratopause. 120 km can be regarded as being outside of the atmosphere from a RO retrieval point of view and effec-tively no further a priori information needs to be introduced to the retrieval after statistical optimisation of the bending angles. This strategy ingests less a priori information com-pared to most other RO retrieval schemes and allows clear tracing of the amount of non-observed information entering the retrieval (see Sect. 2.3). As will be shown below based on real data, rather than on simulated data as used by Gob-iet and Kirchengast (2004), a significantly higher degree of independence from a priori information can be achieved in the critical 30 to 40 km altitude range compared to retrieval schemes applying “2nd initialisation” of the hydrostatic inte-gral. A more detailed description of the general methodology
can be found in Gobiet and Kirchengast (2004), its specific application to CHAMP data is described as part of the fol-lowing subsection.
2.3 The CHAMPCLIM retrieval
The CHAMPCLIM retrieval (CCR) scheme, more precisely the dry air retrieval core scheme of interest here, starts with phase delays from CHAMP provided by GFZ (“level 2 data”) and returns (dry air) profiles of refractivity, density, pressure, geopotential height, and temperature, respectively. Com-pared to the pre-operational retrieval scheme described in Gobiet and Kirchengast (2004) several aspects were im-proved for its operational application to CHAMP data and to improve the retrieval performance. Table 1 provides an overview on the main ingredients of the scheme and we briefly describe the main (improvement) aspects below; some more details are described in Gobiet (2005).
More stable ionospheric correction could be achieved by low-pass filtering the signals before dual-frequency correc-tion and adding the high-pass fraccorrec-tion of the stronger signal afterwards (Hajj et al., 2002; Hocke et al., 2003). Tests iden-tified a 1 km-width boxcar filter applied to bending angles and impact parameters being most effective, whilst broader filters created biases above 30 km and more narrow filters
were less effective in terms of retrieval efficiency (i.e., a smaller number of occultation events could be successfully processed). Additionally, the retrieval quality in terms of sta-tistical error could be slightly improved in the 15 to 20 km altitude range.
The statistical optimisation of bending angles needs an es-timation of the error characteristics of the data. Unlike sev-eral retrieval schemes that use the root-mean-square (RMS) differences relative to the a priori for this purpose we derive observation errors independently from the background by analysing the altitudinal variance of the ionosphere-corrected bending angle profiles at high altitudes, where it predomi-nantly contains noise and the neutral atmospheric contribu-tion to the signal is close to negligible. Compared to the RMS method, this generally reduces the observation error estimate by 10 to 20% (which does not necessarily mean that the lower value is more realistic). More important are single cases with severely biased background information. Depending on the quality of the background information, such cases can lead to a more than 50% overestimation of the observation error.
The error estimation was derived from the height interval between 65 and 80 km. Though a lower boundary of 70 km would better fulfil the low-atmospheric-signal assumption, 65 km was used in case of CHAMP as compromise for the sake of higher retrieval efficiency. Typically, the observation error standard deviation is estimated to amount to 1 to 4 µrad at this altitude. For more recent RO receivers with nominally higher SNR like the GNSS Receiver for Atmospheric Sound-ing (GRAS) on MetOp (GRAS-SAG, 1998; Loiselet et al., 2000) or the Integrated GPS Occultation Receivers (IGOR) on the COSMIC constellation (Rocken et al., 2000; Wu et al., 2005), it might be meaningful to raise the lower boundary.
As background information we used what we consider to be the best dataset available, the operational analyses of the European Centre for Medium-Range Weather Fore-casts (ECMWF, cf. Sect. 3.3.3). Due to ECMWF having started RO data assimilation as of mid December 2006, CCR is scheduled to use short-range forecasts instead of analy-ses as a priori information beyond 2006 in order to have available sufficiently independent, yet physical consistent a priori profiles with good error characteristics (any poten-tial influence of this change on climatology fields will be checked). For each observed bending angle profile, one col-located set of atmospheric parameters was extracted from the temporally closest of the six-hourly ECMWF analysis fields. This was converted into a refractivity profile (Eq. 2), expanded upwards from ∼60 km (the second-highest level of the ECMWF model) to 120 km using refractivity derived from the MSISE-90 climatology (Hedin, 1991) and half-Gaussian weighting (vertical scale length 7.5 km) to ensure a smooth transition, and transformed into a bending angle pro-file using the forward Abel transform (the inverse of Eq. 1; e.g. Rieder and Kirchengast, 2001; their Eq. 14). The error of the background profile was assumed to amount to 15% of the background bending angle value at each altitude, which
is in reasonable agreement with the climatological variability in the upper stratosphere and lower mesosphere and ensures that the background profile dominates only at the uppermost part of the profile, where the SNR of the observation is small (cf. also Healy, 2001; Rieder and Kirchengast, 2001). Since the bending angle in the atmosphere increases exponentially with decreasing height, the a priori error estimate grows very fast with decreasing height and is not very sensitive to the actual percentage value (values of 5 to 20% are commonly used and yield comparable results).
Statistical optimisation restricted to altitudes above 30 km was performed using the inverse covariance weighting ap-proach (Healy, 2001; Rieder and Kirchengast, 2001), which combines the observed and background profile in a statis-tically optimal way regarding their error characteristics, in-cluding vertical error correlation.
To trace errors from bending angle to temperature level in CCR, transformation matrices for background (B), ob-servation (O), and retrieval (R) error covariance matrices (R=(B−1+O−1)−1) have been implemented following
Syn-dergaard (1999). As a measure of the relative importance of the background and observed information after the statistical optimisation, profiles of the square root of the ratio of the di-agonal elements of the retrieval error and background error covariance matrices were analysed (qr), where the
retrieval-to-background error ratio qr can be regarded to indicate the
fraction of the retrieval error stemming from the background error following Rieder and Kirchengast (2001) (their Eq. 8).
qr allows to define background dominated (qr>0.5) and
ob-servation dominated (qr<0.5) altitude ranges, with the
tran-sition height (hq50) between these two regimes at the altitude where qr equals 0.5.
In CCR temperature profiles, hq50 typically lies between 40 and 55 km and it lies about 4 km higher for the corre-sponding bending angle profiles, the actual height primarily depending on the observation error estimate for each given CHAMP bending angle profile. Two exemplary profiles, one with hq50=40 km (“low” case) and one with hq50=57 km (“high” case) are displayed in Fig. 1. These two cases mark the range of virtually all CCR temperature profiles for which error estimation as described above could be performed. However, about one quarter of all CHAMP phase delay pro-files showed data weaknesses at high altitudes where the ob-servation error is estimated (indicated by negative bending angles in ionosphere-corrected bending angle profiles above some height). In these cases we down-weighted the observa-tion by assuming a large observaobserva-tion error (50 µrad) which results in lowering hq50 to about 32 km. We regard a more sophisticated treatment of these profiles, part of on-going work on CCR upgrades, as a major possibility for further reducing the dependence of CCR from background informa-tion.
After application of the inverse Abel transform, a high quality refractivity profile is available, which can be directly processed via the hydrostatic integral without adding further
Fig. 1. Retrieval-to-background temperature error ratio profiles (in
percent, 100·qr) for two cases corresponding to approximately the upper and lower limits of qr in CCR (more details and exception see text). hq50 is indicated by dark-grey dashed lines, the 30 km level by a light-grey solid line.
background information. For the sake of correctness, the in-tegral is initialised with pressure derived from MSISE-90 at 120 km, but simply starting the integration from zero pro-duces negligible differences in the results in the domain of in-terest below 50 km. Note that this does not imply that the ob-servations significantly contribute to the retrieved tempera-ture above about 65 km. The “effective” initialisation height, where retrieved temperature essentially equals the tempera-ture corresponding to the background bending angle profile (qr>0.95), lies within about 60 to 77 km (see Fig. 1).
Finally, a rough quality control is applied in order to re-move outlier profiles featuring a relative refractivity differ-ence greater than 10% between 5 and 35 km or a temper-ature difference greater than 20 K between 8 and 25 km, respectively, compared to the collocated ECMWF profile. The acceptance ranges have been deliberately chosen that large (more than an order of magnitude larger than the stan-dard errors of any of the two datasets) to ensure that indeed only severe outliers, caused by technically corrupted data, are rejected and that eventual biases in the reference dataset (ECMWF) are not introduced into the statistics of the RO retrieval results. The entire CCR quality control system (in-cluding the rejection of technical corrupted data during the retrieval) removes about 10% of the profiles entering the re-trieval (GFZ level 2 data at phase delay level).
3 Validation methodology and correlative data
A range of suitable correlative datasets were used to vali-date the CCR scheme temperature product in order to de-rive a well-founded estimation of the retrieval performance characteristics. Though the correlative data in general fea-ture error characteristics larger than can be expected from the RO method, the combination of these comparisons pro-vides a well-balanced picture of the retrieval performance, particularly on upper bounds of eventual biases.
3.1 Validation periods and spatial setup
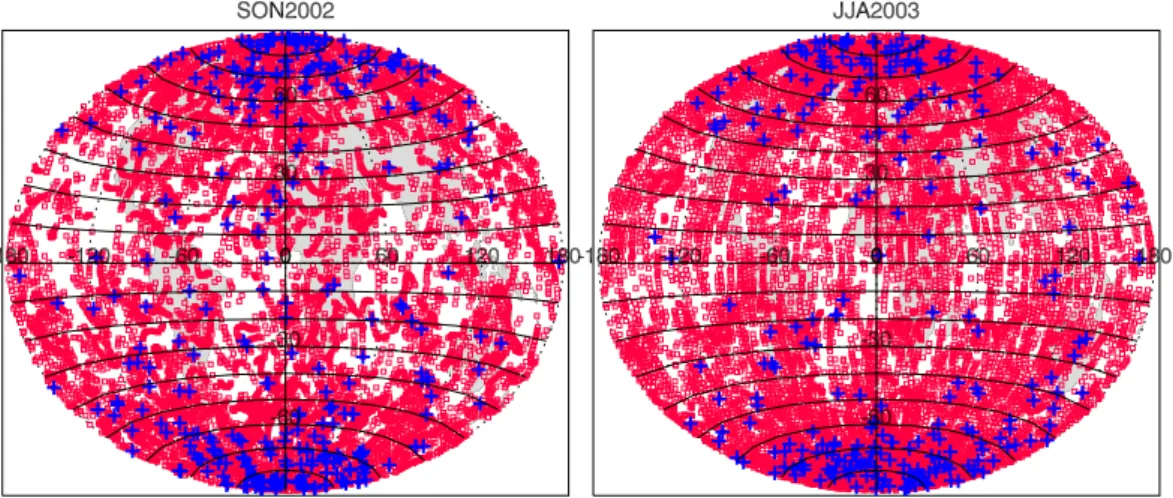
Out of 20 available seasons analysed (September 2001 to Au-gust 2006; cf., e.g., Borsche et al., 2007), two representative seasons were selected to be closely validated and presented in more detail here: September, October, and November 2002 (SON 2002) and June, July, and August 2003 (JJA 2003). Figure 2 illustrates the coverage. SON 2002 is, regarding the comparison of CCR RO to correlative data, a representative typical season and JJA 2003 stands for a more “extreme” sea-son featuring prominent deviations between the datasets. A further practical reason for selecting these periods was the limited availability to us of the Envisat correlative datasets (see Sect. 3.3.2) in other seasons.
In order to be able to analyse not only seasonal, but also latitudinal effects, the two seasonal samples were further separated into latitudinal sub-samples: low latitudes (−30◦
to +30◦), mid latitudes (±30◦to ±60◦), and high latitudes (±60◦to ±90◦) for the depiction of error statistics profiles, and 18 ten-degree latitude samples (bounded by black lines in Fig. 2) for the depiction of zonmean latitude versus al-titude plots of the bias (Sect. 4). The latitudinal separation is particularly important since the quality of both the CCR and the correlative data may depend on latitude. Addition-ally, bias estimates including significance level indication are summarised in a more compact manner (Sect. 5) by averag-ing over 10 km altitude intervals (10 to 20 km, 20 to 30 km, 30 to 40 km). The uppermost interval is of particular inter-est for judging the influence of a priori information on the retrieval and the lower and middle intervals mark the best performance RO retrieval range.
The spatial coverage of CHAMP occultation events is denser near the poles than at low latitudes due to the high in-clination (87◦) of the CHAMP orbit. This affects particularly
the density of coincidences with profiles from a dataset with qualitatively similar coverage characteristics such as MIPAS, as clearly visible in Fig. 2.
3.2 Validation methodology
The validation methodology is based on simple statistics of differences between CCR RO dry temperature profiles and temperature profiles from the other data sources. Since no data below 10 km are compared, the water-vapour effect in
Fig. 2. Geographical distribution of CHAMP events (red squares) and coinciding MIPAS profiles (blue crosses) in SON 2002 (12 950
CHAMP profiles, 368 coincidences, left panel) and JJA 2003 (13 655 CHAMP profiles, 254 coincidences, right panel). The black circles of latitudes indicate the latitudinal separation into 18 ten-degree bands of zonal-mean sub-ensembles.
dry temperature can be neglected for our purposes (e.g., Go-biet, 2005) and dry temperatures can be regarded as actual temperatures (small potential differences remaining in the tropical latitudes up to about 12 km are easily diagnosed). For each CCR profile, a collocated correlative profile is searched (the definition of collocation is given in the follow-ing subsections) and, if found, vertically linearly interpolated to the CCR standard altitude levels (regular 200 m level spac-ing). The correlative profile is then subtracted from the CCR profile and the difference profile 1x is added to the valida-tion ensemble from which error statistics are derived. The ensemble mean profile represents the systematic difference (bias profile b) and the subtraction of b from each difference profile gives a centred (unbiased) ensemble of difference pro-files from which the ensemble variance profile (mean squared centred difference at each altitude level) and its square root, the standard deviation profile s, are estimated. While s char-acterises the statistical variability of the differences, the un-certainty of the bias b is characterised at any given altitude level by the standard deviation profile of the mean, s/N1/2,
N being the ensemble size. All comparisons in this study
are based on b and s, separating the systematic (b) from the random (s) part of the more frequently used aggregate root-mean-square error. Furthermore, 2×s/N1/2is used as a 2σ -measure of statistical significance (95% level) of the es-timated biases (Sect. 5).
Since we are not only interested in quantifying the discrep-ancies between different observational and modelled data but also in their relation to the actual state of the atmosphere, in-cluding effects of inadequate vertical resolution, we did de-liberately not match the resolutions, e.g., by adjusting the av-eraging kernels as described by Rodgers and Connor (2003). Resolution-induced differences were found to point to inter-esting atmospheric structures so we considered it counter-productive to smooth them out in the context of this study.
Regions featuring differences primarily due to lacking reso-lution of correlative data are readily diagnosed by comparing the full-resolution bias profiles with 10 km mean biases.
We note that the validation and error analysis presented here is not intended to quantify the climatological error of gridded RO climatologic datasets derived from CHAMP (see Foelsche et al., 20072, for this purpose), which would addi-tionally include sampling errors caused by the non-uniform and limited spatial and temporal measurement profile distri-bution and resolution effects. Here, we rather restrict the analysis to combined observational error of collocated tem-perature profiles, i.e., we minimise sampling errors. This al-lows direct insight into the RO retrieval accuracy, together with the accuracy of the correlative datasets, and, based on the diversity and various known strength and weaknesses of the different datasets allows isolation of valuable information on the individual dataset quality.
3.3 Correlative datasets 3.3.1 Operational GFZ retrieval
Temperature profiles from the most recent operational CHAMP-GFZ retrieval (version 5; e.g., Wickert et al., 2004) are used for a focused analysis of the effects of different ele-ments in RO retrieval strategies. This yields no comprehen-sive information on the overall RO retrieval performance but rather estimates structural retrieval uncertainty starting from phase delays. Von Engeln (2006) performed a similar study for the entire RO retrieval process by comparing CHAMP data from two independent processing centres. The GFZ retrieval employs statistical optimisation of bending angle
2Foelsche, U., Borsche, M., Steiner, A. K., Gobiet, A., Pirscher, B., Kirchengast, G., Wickert, J., and Schmidt, T.: Observing Upper Troposphere-Lower Stratosphere Climate with Radio Occultation Data from the CHAMP Satellite, Clim. Dynamics, submitted, 2007.
profiles using the MSISE-90 climatology (Hedin et al., 1991) as a priori data and adds further a priori information derived from operational ECMWF analyses by initialising the hydro-static integral at 43 km (i.e., the systematic and random error of ECMWF at 43 km is assumed to be zero). This results, similar to other double-initialisation schemes described in lit-erature (e.g., Hajj et al., 2004), in overemphasis of ECMWF a priori information and physically inconsistent refractivity and temperature profiles near the “2nd initialisation” upper boundary. We note that an enhanced version of the GFZ re-trieval is scheduled to be released later in 2007 (J. Wickert, personal communication, 2007). Evaluation studies showed that RO temperatures in general and CHAMP-GFZ temper-atures in particular are derived with a statistical error of less than 1 K between 10 and 30 km (Hajj et al., 2002; Wickert et al., 2004) though it has also been shown that GFZ temper-atures above 25 km are cold biased by 1–2 K (Wang et al., 2004; Wickert et al., 2004).
The vertical resolution of GFZ profiles can be regarded to be similar to CCR profiles (∼1 km), neglecting minor differ-ences in the retrieval process. Collocation of CCR and GFZ profiles is trivially achieved by selecting the same CHAMP measurement. Since CCR uses quality controlled phase de-lay data from GFZ (i.e., only data that could be processed with the operational GFZ retrieval as well), the entire set of CCR temperature profiles could be used and a total of 26 605 difference profiles entered the error statistics, 12 950 in SON 2002 and 13 655 in JJA 2003, 10 926 at high latitudes, 9299 at mid-latitudes, and 6344 at low latitudes.
3.3.2 Envisat instruments MIPAS and GOMOS
Comparison to other remote sensing instruments is of par-ticular importance in order to independently evaluate CCR results. We present comparisons with two instruments on-board ESA’s (European Space Agency) Envisat satellite, the Michelson Interferometer for Passive Atmospheric Sound-ing (MIPAS) (Fischer and Oelhaf, 1996; European Space Agency, 2000) and the Global Ozone Monitoring by Occul-tation of Stars (GOMOS) (Bertaux et al., 1991; Kyr¨ol¨a et al., 2004) instrument.
MIPAS is a Fourier transform spectrometer for the mea-surement of gaseous mid-infrared emission spectra at the Earth’s limb. It is dedicated to distribute profiles of atmo-spheric constituents from 6 km to 70 km altitude with a verti-cal resolution of about 3 km between 6 and 42 km and a hor-izontal resolution between 300 km and 500 km along track. Since thermal emissions in the infrared are sensitive to tem-perature, MIPAS is also capable to measure temperature. The temperature profiles used for this study were retrieved by the Institut f¨ur Meteorologie und Klimaforschung (IMK) in Karlsruhe (version V3O T 8). Though ECMWF analyses are used as a priori in the retrieval process, MIPAS is not bi-ased against ECMWF, since the latter data are used within a smoothness constraint matrix of the type γ LT1L1, where γ is
a scaling factor and L1is a first order finite differences
op-erator. The use of the first order finite differences operator does not constrain the column information but only how this information is distributed over altitude (von Clarmann and Grabowski, 2007). For the focus of this study, inspection of biases, MIPAS can be regarded as independent from CCR and ECMWF for biases in those data being vertically resolv-able by MIPAS. More details about the MIPAS temperature retrieval are described in von Clarmann et al. (2003a, b).
For individual profiles, MIPAS temperatures have been re-ported to be retrieved with a total error of 0.5 to 1.5 K (von Clarmann et al., 2003a) and comparisons to other instru-ments confirmed these figures in principle (with few excep-tions) (Wang et al., 2004, 2005). It has also been demon-strated that the difference in vertical resolution to RO mea-surements significantly influences the comparison with RO profiles only in the tropopause region (Wang et al., 2004).
Due to MIPAS’ sensitivity to clouds, the number of available measurements per day varies from several tens to hundreds. When this study was performed, 68 days of MIPAS data from the most recent retrieval version were available in the two evaluation periods (SON 2002: 04/09/2002, 05/09/2002, 12–14/09/2002, 1– 28/092002, 17/10/2002, 25/10/2002, 26/10/2002, 4/11/2002, 5/11/2002, 7–9/11/2002, 11–13/11/2002, 15/11/2002, 22/11/2002, 23/11/2002, 29/11/2002, 30/11/2002; JJA 2003: 05–09/06/2003, 12/06/2003, 13/06/2003, 24/06/2003, 25/06/2003, 29/06/2003, 30/06/2003, 01/07/2003, 05/07/2003, 06/07/2003, 14/07/2003, 16–18/07/2003, 26–31/07/2003, 05/08/2003, 06/08/2003, 16–18/08/2003, 26–28/08/2003, 30/08/2003, 31/08/2003), all together yielding 24 187 profiles. As collocation criteria a maxi-mum horizontal distance of 300 km and a maximaxi-mum time difference of 3 h were allowed. 622 CHAMP profiles met these criteria, most of them at high latitudes (441), but still a statistically reasonable number at mid (122) and low (59) latitudes (cf. Fig. 2). In cases where more than one MIPAS profile met the collocation criteria, the average of the collocated profiles was used for comparison with CCR RO.
GOMOS, a further Envisat instrument for atmospheric sounding, exploits stellar occultation (i.e., the information carried by a star’s light when it is modified during its travel through the Earth’s atmosphere as the star sets behind the horizon) with the major objective of monitoring ozone and ozone depleting trace gases in the altitude range between 15 km and 90 km. In addition, GOMOS data can be ad-dressed to retrieve bending angle, density, pressure, and temperature profiles. Results from a temperature retrieval based on bending angle profiles extracted from GOMOS star tracker data are used for comparison with CCR RO. The re-trieval chain roughly follows the CCR scheme explained in Sect. 2.3. Details are discussed in Retscher et al. (2004, 2006). The vertical resolution of GOMOS temperature pro-files is about 1.7 km corresponding to a sampling rate of 2 Hz.
Only a very limited amount of GOMOS data was available for this study, resulting in 49 collocated temperature profiles (same collocation criteria as for MIPAS), most of them at high latitudes. In order to retain reliable statistics, no further separation into latitudinal sub-ensembles was performed. 3.3.3 NWP analyses
Analyses of numerical weather prediction (NWP) centres combine short-range model forecasts with various sources of observational data. In the stratosphere they are pre-dominantly constrained by radiosondes (up to 25–30 km) as well as low vertical resolution satellite-derived radiances like those of the Advanced Microwave Sounding Unit A (AMSU-A). Their reliability is best in the troposphere and lower stratosphere and decreases in the middle and upper strato-sphere due to decreasing availability and quality of observa-tions, particularly over polar regions and the oceans. We col-lected data from five major analysis systems for comparison with CCR RO temperature profiles.
The first ones, ECMWF operational analyses are also used in CCR as a priori information above 30 km (cf. Sect. 2.3) and can therefore not be regarded as an entirely indepen-dent evaluation dataset. Their importance here as correlative dataset is for assessment of the level of (in)dependence of CCR RO temperatures from its ECMWF constraint at high altitudes (above 25 km) and for use as independent evalua-tion dataset below about 25 km. The analysis version oper-ational during our evaluation periods used 60 vertical lev-els up to 0.1 hPa, spectral representation in the horizontal with triangular truncation at wave number 511 (T511, cor-responds to ∼40 km grid spacing) for upper air fields and horizontal derivatives, and a Gaussian grid in the horizontal for dynamic tendencies and diabatic physical parameterisa-tions (ECMWF, 2004). The operational forecasts are started twice a day from the initial state (i.e., the previous analysis), produced via four-dimensional data assimilation. Analyses are produced for 00:00, 06:00, 12:00, and 18:00 UTC every day.
For this comparison, ECMWF analyses have been ex-tracted from the ECMWF data archive on model levels at full vertical resolution (>1.5 km in the tropopause region, i.e., somewhat coarser than CCR RO) and reduced horizontal res-olution (T42, corresponds to ∼300 km, which is roughly the horizontal resolution of RO measurements). Vertical profiles of temperature bi-linearly interpolated to the mean tangent point of the occultation event were derived from the nearest analysis time layer, which ensured that the maximum time difference between the CCR and the ECMWF profile corre-sponds to the collocation criteria for MIPAS and GOMOS, and linearly interpolated to the CCR standard altitude levels. Since ECMWF analyses are available for the entire evalu-ation periods, the entire set of CCR profiles (26 605) could be used for evaluation, as for the comparison to GFZ RO re-trievals.
Further analyses used for comparison were provided in the framework of the Stratospheric Processes And their Role in Climate (SPARC) project and are particularly important to estimate the uncertainty of recent analyses in different alti-tudes and at different latialti-tudes in order to allow a proper in-terpretation of the comparison results. These analysis data are interpolated linearly in time, bi-linearly in the horizon-tal to the CHAMP observation locations, and linearly to the CCR standard altitude levels. Descriptions of each of the assimilation/analysis systems are given by Manney et al. (2005a).
GEOS-4 (Goddard Earth Observing System, Version 4.03; Bloom et al., 2005) analyses from NASA’s Global Mod-eling and Assimilation Office are provided on a 1◦×1.25◦ latitude × longitude grid on 55 model levels from the sur-face to 0.01 hPa. The fields are six-hour averages valid at 00:00, 06:00, 12:00, and 18:00 UTC. Analyses from the UK Met Office (referred to as MetO analyses; Swinbank et al., 2002) are provided by the British Atmospheric Data Centre (BADC) once daily at 12:00 UTC. They are on a 2.5◦×3.75◦ latitude × longitude grid, on six levels per decade in pres-sure (“UARS prespres-sure levels”, 40 levels in total) from 1000 to 0.1 hPa. NCEP/CPC (National Centers for Environmental Prediction/Climate Prediction Center) analyses are available once daily at 12:00 UTC, provided on a 65×65 point polar stereographic grid for each hemisphere. The fields used here have been interpolated bi-linearly to a 2.5◦×5◦ latitude × longitude grid prior to the interpolation to the CHAMP loca-tions. They are available on 18 pressure levels from 1000 to 0.4 hPa. The NCEP/NCAR (NCEP, National Center for At-mospheric Research) 50 year reanalysis (NCEP Rean) data are daily average fields valid at 12:00 UTC, on a 2.5◦×2.5◦
latitude × longitude grid. There are 17 pressure levels from 1000 to 10 hPa. NCEP Rean data are considered unsuitable for detailed stratospheric studies, since the temperatures are severely biased according to Manney et al. (2005a, b).
4 Results and discussion
The results of the comparisons are presented as latitude ver-sus altitude slices of zonal-mean bias as well as in form of bias ± standard deviation profiles separated into global do-main and low, mid, and high latitudes, respectively. For GO-MOS, due to the limited collocation ensemble, only global mean difference statistics are presented and discussed. For the analyses other than ECMWF, the results are shown and discussed as latitude versus altitude slices only. The dis-played altitude range is 10 to 40 km, of which 10 to 30 km is generally regarded as the reliable (best performance) range for RO measurements, and 30 to 40 km marks the potentially a priori influenced, but still measurement dominated range. The maximum usable altitude of properly processed stand-alone RO products can be expected to be found within 30 to 40 km. Soon above 40 km a RO profile quickly becomes a
Fig. 3. CCR CHAMP temperature differences relative to operational GFZ CHAMP retrievals, i.e., positive values correspond to higher CCR
temperatures. Top row: Systematic differences (bias) in 18 latitude bands (left: SON 2002, right JJA 2003). Middle and bottom row, from left to right: Global, low latitude (−30◦to 30◦), mid latitude (±30◦to ±60◦), and high latitude (±60◦to ±90◦) bias (black) ± standard deviation profiles (grey) for SON 2002 (middle) and JJA 2003 (bottom), respectively.
priori dominated (details depending on the high altitude ini-tialisation strategy used; cf. Gobiet and Kirchengast, 2004, and Sect. 2.3). White areas in the plots correspond to miss-ing correlative data. Statistical significance is not displayed, but generally any bias larger than ∼0.2 K can be regarded as statistically significant on the 2σ -level (∼95% significance). A more condensed view on the results including significance indication follows in Sect. 5.
4.1 Comparison to operational GFZ CHAMP temperatures Figure 3 illustrates the intercomparison results between CCR and GFZ retrievals from CHAMP. Due to the decreasing
ac-curacy above 30 km, operational CHAMP temperature pro-files from GFZ are delivered for altitudes up to 35 km only. Generally, as Fig. 3 shows, the differences to CCR temper-atures are small below about 26 km (<0.5 K) with standard deviations of 1 to 2 K. At higher altitudes CCR is increas-ingly warmer than GFZ, reaching about 3 K difference at 35 km. Parts of this bias can be attributed to the treatment of a priori information in the GFZ retrieval (see Sect. 3.3.1). As will be shown in Sect. 4.4 later, the source of this bias is a general cold bias (except southern JJA high latitudes) in ECMWF temperatures above 30 km, to which the GFZ re-trieval is more strongly attached than the CCR. Additional
Fig. 4. CCR CHAMP temperature differences relative to Envisat MIPAS retrievals. Same format as Fig. 2.
causes could be a numerical incorrectness found in the GFZ retrieval (J. Wickert, personal communication, 2007) and the influence of the MSIS a priori information used for statis-tical optimisation in that retrieval. A similar bias of the GFZ operational temperatures has been found by Wang et al. (2004) relative to MIPAS (1 to 1.5 K at 30 km), by Wickert et al. (2004) relative to radiosondes (about 2 K at 35 km), and by von Engeln (2006) relative to UCAR (University Cooper-ation for Atmospheric Research) RO retrievals (about 2 K at 31 to 33 km). The important conclusion of this comparison is that the way of introducing a priori data into the RO re-trieval can significantly influence the retrieved temperature profile result down to about 26 km even in well tested opera-tional retrieval schemes, in line with studies by, e.g., Steiner et al. (1999), Marquardt et al. (2003), Hajj et al. (2004), and
Steiner and Kirchengast (2005). Additionally, a bias reach-ing to about 20 km is visible at southern high latitudes of JJA 2003, which will be discussed in Sect. 4.4.
4.2 Comparison to Envisat MIPAS temperatures
Figure 4 illustrates the intercomparison results between CCR CHAMP and MIPAS, which exhibits a different picture than Fig. 3. In the global mean, the bias stays below 0.5 to 1 K in the entire altitude range up to 40 km, except for a devia-tion caused by a severe bias in the JJA 2003 southern high latitudes (bottom, right panel; also see Sect. 4.4). In the lati-tudinal comparison the bias stays at below 2 K (standard de-viation about 2.5 K) except for a peak in JJA 2003 at low latitudes near 29 km (bottom, middle-left panel) which can
Fig. 5. CCR CHAMP temperature differences relative to Envisat
GOMOS retrievals from star tracker data. Bias (black) ± standard deviation profiles (grey) for an ensemble from SON 2002 (plus one day in December 2002).
be attributed to the lower MIPAS vertical resolution and also the rather small ensemble size of less than 30 profile pairs, and the JJA high latitude bias mentioned before. There is no sign of a general CCR warm bias above 30 km like in the comparison to GFZ. Since MIPAS can be regarded as vir-tually independent from ECMWF for biases, this indicates that CCR is as well independent to significant extent from its high-altitude initialisation data (ECMWF) up to 40 km. We find that the only severe deviation that cannot be explained by the different CHAMP and MIPAS vertical resolution is in the JJA 2003 southern high latitudes above 30 km (Sect. 4.4), which is also present in the comparison to other correlative datasets (see Sect. 4.5). The systematic differences are statis-tically significant in most regions but fairly small compared to the combined general error characteristics of RO (∼1 K) and MIPAS (0.5 to 1.5 K). This is particularly encouraging, since MIPAS and CCR RO are independent from each other. 4.3 Comparison to Envisat GOMOS temperatures
Due to the limited GOMOS data availability for this study, only a small ensemble could be used for intercomparison here (49 collocations in total) and no latitudinal separation has thus been done. All profiles analysed are in the period SON 2002 plus one day of December 2002. Figure 5 shows the intercomparison results (the scale of the abscissa is ex-tended compared to other figures). Recall that GOMOS
tem-peratures are from star tracker data (Sect. 3.3.2). The com-parison shows a severe deviation below 25 km (up to about 6 K), and biases below 2 K from 25 to 35 km with a stan-dard deviation of 5 to 8 K. Due to the large stanstan-dard devia-tion and the small ensemble only biases larger than about 2 K can be regarded as statistically significant at the 2σ -level. Since the GOMOS temperatures are preliminary data on a small dataset (a more advanced temperature product based on GOMOS fast photometer data is currently under develop-ment; V. Sofieva, FMI Helsinki, Finland, personal commu-nications, 2006), this comparison mainly demonstrates the value of CCR RO data for evaluation of new remote sens-ing products. The bias below 25 km is significant and can be attributed to GOMOS, since CCR comparisons to the other correlative dataset give no indication for such a bias in CCR retrievals. Further results from comparisons of GOMOS data to CHAMP and ECMWF data are discussed by Retscher et al. (2006).
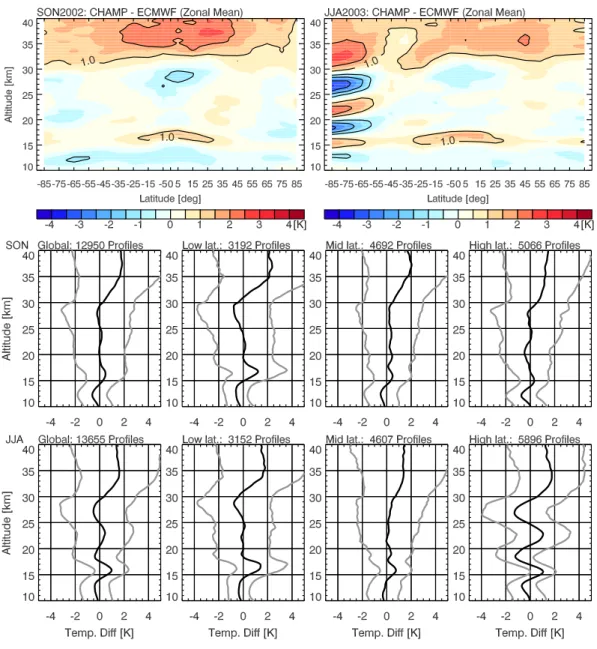
4.4 Comparison to ECMWF analysis temperatures Figure 6 illustrates the intercomparison results between CCR CHAMP and ECMWF temperatures. ECMWF analyses gen-erally agree very well with CCR temperatures (bias <0.5 K in most regions below 30 km, accompanied by standard de-viations of ∼1.5 to 2.5 K) with three remarkable exceptions: An oscillatory bias structure in JJA 2003 at southern high lat-itudes (polar vortex), a bias in the vicinity of the low latitude tropopause, and a general bias over all latitudes above 30 km. The oscillatory bias has been shown to be a feature of ECMWF’s representation of the polar vortex in the anal-yses and is probably an artefact from bias adjustments in the ECMWF data assimilation system in data sparse regions (Gobiet et al., 2005). It can be found in any JJA season from 2002 to 2006 to varying extent (not shown). The polar vor-tex bias seems to be the most severe bias in ECMWF anal-yses and a combined inspection of Fig. 4 (CCR vs. MIPAS) and Fig. 6 (CCR vs. ECMWF) indicates that this bias (rel-ative to the presumed “true” state of the atmosphere) above 30 km might be even larger than indicated by the compari-son with CCR (about 10 K or more). Such a large bias in the high-altitude initialisation data degrades the CCR retrievals down to about 30 km (see Figs. 3, 4, and 7). However, this comparative inspection indicates as well that this downward propagated bias is restricted to the JJA southern high lati-tudes above 30 km in CCR RO data.
The tropical tropopause bias is present in any season from 2002 to winter 2005/2006 and has been found as well to be attributable to ECMWF analyses (Gobiet et al., 2005; Borsche et al., 2007). It was probably related to under-represented atmospheric wave activity in the ECMWF model and is found strongly reduced since an update and resolution improvement of the ECMWF model system, which became operational in February 2006 (Borsche et al., 2007).
Fig. 6. CCR CHAMP temperature differences relative to ECMWF analyses. Same format as Fig. 2. The general warm bias above 30 km is of particular
in-terest here since it demonstrates the relative independency of CCR retrievals from their high-altitude initialisation data, thanks to the careful initialisation approach. CCR shows no warm bias compared to any other correlative dataset ex-cept GFZ, which is strictly tied to ECMWF at high altitudes (cf. Sect. 3.3.1). The bias above 30 km visible in Fig. 6 is thus attributable as cold bias to the ECMWF analyses. Par-ticularly the comparison to MIPAS (Fig. 4) indicates no CCR bias between 30 and ∼37 km (except the JJA polar vortex bias), which in turn indicates that the CCR high-altitude ini-tialisation scheme is insensitive to moderate biases (∼3 K) in the a priori data at least up to 35 km (a potential residual cold bias above 35 km is discussed in Sect. 4.5). Comparison to other analyses (see next Sect. 4.5) indicate no warm CCR bias above 30 km as well.
4.5 Comparison to other atmospheric analyses
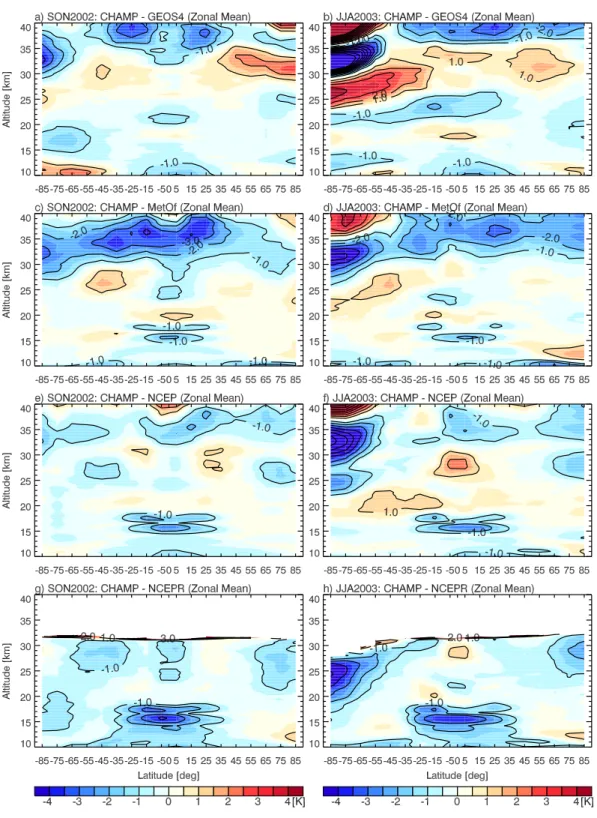
Figure 7 shows the intercomparison results between CCR CHAMP and four atmospheric analyses (as introduced in Sect. 3.3.3), which allows to cross-check and further as-sess the consistency of the results found so far. Generally, Fig. 7 indicates that the bias in JJA at southern high latitudes above 30 km is partly attributable to CCR. It is visible in all JJA 2003 differences except for NCEP Rean which does not reach high enough. Below 30 km, the biases are in gen-eral found below 1 K in most altitudes and latitudes but sev-eral exceptions occur: In the MetO, NCEP/CPC, and NCEP Rean comparisons, a cold bias appears near the low latitude tropopause. This can be mainly attributed to the lower ver-tical resolution of the analyses relative to CCR. In case of NCEP Rean (see Sect. 5) also a further bias plays a role. In
Fig. 7. CCR CHAMP zonal-mean systematic temperature differences (bias) in 18 latitude bands (left column: SON 2002, right column
JJA 2003) relative to four meteorological analyses. Top row: GEOS-4 (GEOS4), upper middle row: MetO (MetOf), lower middle row: NCEP/CPC (NCEP), bottom row: NCEP Rean (NECPR).
addition to the tropopause features, there are several severe biases visible (e.g., around 25 km in GEOS-4), but none of these appear consistently in more than one analysis. This implies that they are related to the specific problems in the
different analysis systems and underlines the value of the RO data as reference dataset.
Above about 35 km, a consistent (cold) bias shows up in the GEOS-4, MetO, and to a lesser extent the NCEP/CPC
Fig. 8. CCR CHAMP average temperature differences [K] relative to the operational CHAMP retrieval results from GFZ (CHGFZ),
En-visat MIPAS, ECMWF operational analyses, GEOS-4 analyses, MetO analyses, NCEP/CPC analyses, and NCEP Reanalyses in SON 2002 and JJA 2003, respectively, at low (0◦to 30◦), mid (30◦to 60◦), and high (60◦to 90◦) latitudes of the northern (NH) and the southern hemisphere (SH) between 10–20 km, 20–30 km, and 30–40 km. Aggregate means (averages of the individual comparison means) are also shown (rightmost column and four bottom lines). The colours in each cell visualise the magnitude of a cold (blue) and warm (yellow/red) difference, respectively, crosses indicate statistically insignificant (<2σ -level) differences/biases. Empty white cells indicate that there was no comparison due to insufficient correlative data.
comparisons. This could be partly a CCR cold bias (though not visible in the comparison to MIPAS), at least above 35 km, which would be reasonable given the upper stratosphere cold bias in the ECMWF analyses serving as initialisation data.
Generally, these comparisons are consistent with and add confidence to the results of the previous sections. Addition-ally, interesting details about the specific analyses can be de-rived, for example, the significant cold bias (now viewed rel-ative to CCR) of GEOS-4 in the JJA 2003 southern high lati-tudes between about 25 and 30 km and the strong warm bias of NCEP Rean in about the same region.
5 Summary and conclusions
This study described and evaluated the CCR RO processing scheme of the Wegener Center, Univ. of Graz, which
partic-ularly aims at delivering bias-free atmospheric profiles for climate monitoring and research. The CCR RO temperature retrievals from CHAMP data of two representative seasons (SON 2002 and JJA 2003) were validated against correlative datasets from operational GFZ Potsdam CHAMP retrievals, Envisat MIPAS and GOMOS temperatures, ECMWF analy-ses, and four further atmospheric analyses.
Figure 8 provides a summary overview on the validation results of the study in the form of an “error portrait dia-gram”, which shows 10 km-altitude-mean systematic differ-ences (biases) for all comparisons presented and indicates statistically insignificant differences with crosses.
Figure 8 shows that temperatures in the region above 30 km are strongly varying between the correlative datasets. ECMWF and GFZ are significantly colder than CCR (1.3 to 1.8 K), all other analyses are warmer than CCR (0.4 to 1.7 K). MIPAS is closest to CCR, with mean biases below 0.5 K.
This gives confidence in the CCR temperatures above 30 km, since MIPAS is the only (in a bias-sense) virtually model-independent correlative dataset in this evaluation study and uses an entirely different measurement principle than CCR. However, a consistent CCR cold bias against three different analyses above 35 km (Sect. 4.5) is also to be noted. Addi-tionally, it has been found (Sect. 4.4) that an extremely biased a priori (about 10 K or more) degrades CCR RO temperature accuracy down to 30 km (JJA southern high latitudes).
Below 30 km, no systematic biases were found for CCR RO. NCEP Rean stands out a little bit being generally warmer than CCR (∼0.7 K), in accordance with Manney et al. (2005a), who concluded that NCEP Rean is not suited for stratospheric studies due to extensive biases. The global mean intercomparison bias (over all correlative datasets, all regions, and both seasons) between 10–20 km and 20–30 km amounts to −0.2 K, whereby half of this biases is caused by NCEP Rean. The following main conclusions can be drawn. 1. In the global mean within 10–30 km altitude we find that the present validation observationally constrains the poten-tial RO temperature bias to be <0.2 K. Latitudinally resolved analyses show biases to be observationally constrained to
<0.2–0.5 K up to 35 km in most cases and up to 30 km in
any case, even if a severely biased (about 10 K or more) a priori information is used in the high altitude initialisation of the retrieval.
2. No evidence is found for the 10 to 35 km altitude range of residual RO bias sources other than potentially propagated downward from initialisation. This indicates that the widely quoted RO promise of “unbiasedness and long-term stability due to intrinsic self-calibration” can indeed be realised given care in the data processing to strictly limit structural uncer-tainty.
3. Adequate high-altitude initialisation is crucial for ac-curate stratospheric RO retrievals. Still common methods of initialising, in addition to bending angle initialisation, the hydrostatic integral with an upper boundary temperature or pressure value derived from meteorological analyses, are prone to introduce biases from the initialisation down to be-low about 25 km.
4. Also above 30 to 35 km GNSS RO still delivers a considerable amount of observed information up to around 40 km. This is particularly interesting for NWP assimila-tion systems where direct assimilaassimila-tion of non-initialised (a priori-free) observed RO bending angles appears thus to be the method of choice.
Overall we conclude that the RO method in general, and the Wegener Center CCR scheme based on GFZ Potsdam phase delay and orbital data in particular, is capable of pro-viding high quality and essentially unbiased atmospheric profiles up to about 35 km with high vertical resolution (∼1 km) and global coverage, adequate for climate monitor-ing and research.
While this study based on single-satellite CHAMP data clearly underlined the value of RO for climate
applica-tions, upcoming data from new missions such as Formosat-3/COSMIC (launched in April 2006) and MetOp (launched in October 2006) will strongly further enhance the utility of RO for improved operational monitoring of climate variabil-ity and change in the future.
Acknowledgements. We thank J. Wickert and T. Schmidt (GFZ Potsdam, Germany) for cooperation and the provision of CHAMP data, D.-Y. Wang (Univ. of New Brunswick, NB, Canada; formerly IMK Karlsruhe, Germany) for support and advice regarding MIPAS data, ECMWF for access to their operational analysis data, the British Atmospheric Data Centre for MetO data, the GSFC ACD Science Data System for NCEP/CPC data, and NASA’s GMAO for GEOS-4 data. NCEP reanalysis data were provided by the NOAA/CIRES Climate Diagnostics Center, Boulder, CO. Work at the Jet Propulsion Laboratory, CalTech, CA, was done under contract with the National Aeronautics and Space Administration. A. Gobiet received funding for the work from the START research award of G. Kirchengast funded by the Austrian Ministry for Education, Science, and Culture and managed under Program Y103-N03 of the Austrian Science Fund (FWF). M. Borsche received funding from the Austrian Aeronautics and Space Agency (FFG-ALR) via the CHAMPCLIM project.
Edited by: R. Cohen
References
Alfred, J., Fromm, M., Bevilacqua, R., Nedoluha, G., Strawa, A., Poole, L., and Wickert, J.: Observations and analysis of polar stratospheric clouds detected by POAM III and SAGE III during the SOLVE II/VINTERSOL campaign in the 2002/2003 North-ern Hemisphere winter, Atmos. Chem. Phys., 7, 2151–2163, 2007,
http://www.atmos-chem-phys.net/7/2151/2007/.
Bertaux, J. L., Megie, G., Widemann, T., Chassefiere, E., Pelli-nen, R., Kyr¨ol¨a, E., Korpela, S., and Simon, P.: Monitoring of ozone trends by stellar occultations: the GOMOS instrument, Adv. Sapce. Res., 11, 237–242, 1991.
Bevis, M., Businger, S., Herring, T. A., Rocken, C., Anthes, R. A., and Ware, R. H.: GPS meteorology: Mapping zenith wet delays onto precipitable water, J. Appl. Met., 33, 379–386, 1994. Bloom, S. C., da Silva, A. M., Dee, D. P., et al.: The Goddard
Earth Observing Data Assimilation System, GEOS DAS Ver-sion 4.0.3: documentation and validation, Technical Report No. 104606 V26, NASA, 2005.
Borsche, M., Kirchengast, G., and Foelsche, U.: Tropi-cal tropopause climatology as observed with radio occul-tation measurements from CHAMP compared to ECMWF and NCEP Analyses, Geophys. Res. Lett., 34, L03702, doi:10.1029/2006GL027918, 2007.
ECMWF: IFS documentation CY28r1, ECMWF, Reading, UK, 2004.
European Space Agency: Envisat, MIPAS An instrument for atmo-spheric chemistry and climate research, ESA Publications Divi-sion, SP-1229, ESTEC, Noordwijk, The Netherlands, 2000. Fischer, H. and Oelhaf, H.: Remote sensing of vertical profiles of
atmospheric trace constituents with MIPAS limb-emission spec-trometers, Appl. Opt., 35, 2787–2796, 1996.


![Fig. 8. CCR CHAMP average temperature differences [K] relative to the operational CHAMP retrieval results from GFZ (CHGFZ), En- En-visat MIPAS, ECMWF operational analyses, GEOS-4 analyses, MetO analyses, NCEP/CPC analyses, and NCEP Reanalyses in SON 2002 a](https://thumb-eu.123doks.com/thumbv2/123doknet/14759280.584155/16.892.153.747.94.596/temperature-differences-relative-operational-retrieval-operational-analyses-reanalyses.webp)
