HAL Id: hal-01945682
https://hal.sorbonne-universite.fr/hal-01945682
Submitted on 5 Dec 2018
HAL is a multi-disciplinary open access
archive for the deposit and dissemination of
sci-entific research documents, whether they are
pub-lished or not. The documents may come from
teaching and research institutions in France or
abroad, or from public or private research centers.
L’archive ouverte pluridisciplinaire HAL, est
destinée au dépôt et à la diffusion de documents
scientifiques de niveau recherche, publiés ou non,
émanant des établissements d’enseignement et de
recherche français ou étrangers, des laboratoires
publics ou privés.
Distributed under a Creative Commons Attribution| 4.0 International License
Imaging Lithospheric Discontinuities Beneath the
Northern East African Rift Using S -to- P Receiver
Functions
Aude Lavayssière, Catherine Rychert, Nicholas Harmon, Derek Keir, James
O.S. Hammond, J.-Michael Kendall, Cécile Doubre, Sylvie Leroy
To cite this version:
Aude Lavayssière, Catherine Rychert, Nicholas Harmon, Derek Keir, James O.S. Hammond, et al..
Imaging Lithospheric Discontinuities Beneath the Northern East African Rift Using S -to- P Receiver
Functions. Geochemistry, Geophysics, Geosystems, AGU and the Geochemical Society, 2018, 19 (10),
pp.4048-4062. �10.1029/2018GC007463�. �hal-01945682�
Imaging Lithospheric Discontinuities Beneath the Northern
East African Rift Using S-to-P Receiver Functions
Aude Lavayssière1 , Catherine Rychert1 , Nicholas Harmon1 , Derek Keir1,2 , James O. S. Hammond3 , J.-Michael Kendall4, Cécile Doubre5 , and Sylvie Leroy6 1
National Oceanography Centre, University of Southampton, Southampton, UK,2Dipartimento di Scienze della Terra, Università degli Studi di Firenze, Firenze, Italy,3Department of Earth and Planetary Sciences, Birkbeck, University of London, London, UK,4School of Earth Sciences, University of Bristol, Bristol, UK,5Institut de Physique du Globe de Strasbourg, UMR 7516, Université de Strasbourg/EOST, CNRS, Strasbourg, France,6CNRS, UMR 7193, Institut des Sciences de la Terre de Paris, Sorbonne Université, Paris, France
Abstract
Imaging the lithosphere is key to understand mechanisms of extension as rifting progresses. Continental rifting results in a combination of mechanical stretching and thinning of the lithosphere, decompression upwelling, heating, sometimes partial melting of the asthenosphere, and potentially partial melting of the mantle lithosphere. The northern East African Rift system is an ideal locale to study these processes as it exposes the transition from tectonically active continental rifting to incipient seafloor spreading. Here we use S-to-P receiver functions to image the lithospheric structure beneath thenorthernmost East African Rift system where it forms a triple junction between the Main Ethiopian rift, the Red Sea rift, and the Gulf of Aden rift. We image the Moho at 31 ± 6 km beneath the Ethiopian plateau. The crust is 28 ± 3 km thick beneath the Main Ethiopian rift and thins to 23 ± 2 km in northern Afar. We identify a negative phase, a velocity decrease with depth, at 67 ± 3 km depth beneath the Ethiopian plateau, likely associated with the lithosphere-asthenosphere boundary (LAB), and a lack of a LAB phase beneath the rift. Using observations and waveform modeling, we show that the LAB phase beneath the plateau is likely defined by a small amount of partial melt. The lack of a LAB phase beneath the rift suggests melt percolation through the base of the lithosphere beneath the northernmost East African Rift system.
1. Introduction
Continents are expected to be underlain by thick lithosphere (Sleep, 2005; Tharimena et al., 2017) but the timing and distribution of the lithospheric deformation during continental breakup is still debated and the mechanisms responsible not well understood (Corti, 2012; Ziegler & Cloetingh, 2004). The East African Rift system (EARS) is the ideal region to understand how the lithosphere is modified by extensional tectonics since it exposes the transition between continental breakup and incipient seafloor spreading, hence the tem-poral and spatial evolution of continental rifting.
The northern part of the EARS encompasses Ethiopia, Eritrea, Djibouti, and part of the Arabian Peninsula (Figure 1). It marks a junction of three rifts: the Red Sea rift (RSR), the Gulf of Aden rift (GOA), and the Main Ethiopian rift (MER). Estimates for the initiation of rifting in the region range around 29 to 35 Myr ago with initiation of the separation of Arabia from Africa (Leroy et al., 2010; Watchorn et al., 1998). This occurred either before or roughly at the same time as the eruption of the Ethiopianflood basalts (Wolfenden et al., 2004). Subsequently, the MER started extending 11–18 Myr ago (Wolfenden et al., 2004), forming a triple junction with the RSR and the GOA. Structural and geochronological studies suggest that crustal extension has migrated from being either broadly distributed (Stab et al., 2016) or more focused on major rift-bounding border faults (Wolfenden et al., 2004), to being localized to Quaternary-Recent volcanic segments along the rift axis with extensive intrusion (Ebinger & Casey, 2001).
Plate tectonic theory suggests the existence of a transition between a rigid plate, the lithosphere, and a weaker layer, the asthenosphere. The nature of this boundary, the lithosphere-asthenosphere boundary (LAB), is still poorly constrained. Mechanisms such as dehydration (Hirth & Kohlstedt, 1996; Karato & Jung 1998), grain size (Faul & Jackson, 2005), partial melting (Anderson & Sammis, 1970; Schmerr, 2012), and tem-perature and/or effects of near solidus conditions (Priestley & McKenzie, 2006; Yamauchi & Takei, 2016) have been proposed. Understanding the gradient in seismic velocity at this boundary is key to constrain those
RESEARCH ARTICLE
10.1029/2018GC007463Special Section: Magmatic and volcanic processes in continental rifts
Key Points:
• S-to-P receiver functions image lithospheric discontinuities beneath northern East African Rift
• The Moho shallows from 28 km in the MER along the rift to 23 km in the northern Afar triple junction • The LAB is strong beneath the
Ethiopian plateau but not imaged beneath the rift valley in Afar or MER
Correspondence to:
A. Lavayssière, [email protected]
Citation:
Lavayssière, A., Rychert, C., Harmon, N., Keir, D., Hammond, J. O. S., Kendall, J.-M., et al. (2018). Imaging lithospheric discontinuities beneath the northern East African Rift using S-to-P receiver functions. Geochemistry, Geophysics,
Geosystems, 19, 4048–4062. https://doi. org/10.1029/2018GC007463 Received 27 FEB 2018 Accepted 26 AUG 2018 Accepted article online 3 SEP 2018 Published online 30 OCT 2018
©2018. The Authors.
This is an open access article under the terms of the Creative Commons Attribution License, which permits use, distribution and reproduction in any medium, provided the original work is properly cited.
mechanisms. Recently, receiver functions and SS imaging of strong, sharp seismic discontinuities have been interpreted as the LAB and used to argue that the boundary cannot be purely thermally defined (Hopper et al., 2014; Kawakatsu et al., 2009; Rychert et al., 2012; Rychert & Shearer, 2009; Tharimena et al., 2017). Indeed, the sharpness of the discon-tinuity is inconsistent with thermal gradients that occurs over more than 70-km depth but it is consistent with a deep layer containing a small amount of partial melt (Fischer et al., 2010; Hopper et al., 2014; Kawakatsu et al., 2009; Rychert et al., 2005, 2012; Rychert & Shearer, 2009; Tharimena et al., 2017). Knowing the LAB depth and properties, with their respective spatial variations, helps to better understand the evolution of the lithosphere during continental rifting.
Numerous analytical and geodynamical models have attempted to explain continental extension, from the pure shear mechanical model (McKenzie, 1978) and the magma-assisted model (Buck et al., 1999) to depth-dependent models (Huismans & Beaumont, 2011). All models have different implications in terms of the geometry and sharpness of the LAB. Therefore, imaging this transition can be used to test the applicability of rifting models in nature. The pure shear model of McKenzie (1978) involves uniform ductile stretching of the crust and mantle lithosphere, and faulting of the upper crust. Such a model predicts symmetrical and proportionate shallowing of the Moho and LAB beneath the rift.
More recently, a variety of depth-dependent stretching models (e.g., Huismans & Beaumont, 2011) have been developed in which either the crust or mantle lithosphere is preferentially thinned. Preferential thinning of the crust would image no Moho and a strong LAB, whereas preferential thinning of the mantle lithosphere would image a strong Moho and no LAB.
Rifting can also be assisted by magma emplacement (Bialas et al., 2010; Ebinger & Casey, 2001; Kendall et al., 2005). The magma-assisted rifting model of Buck et al. (1999) predicts that if magma is present, then it can accommodate extension at much lower stresses than the previously mentioned mechanical rifting models. The intrusion of magma is likely to complicate the behavior of the mantle lithosphere since it could thin by thermal erosion (Holtzman & Kendall, 2010; Lenoir et al., 2001; Monnereau et al., 1993; Saunders et al., 1992), or be preferentially stretched due to thermal weakening (Bialas et al., 2010), potentially destroying the rigid, seismically fast lithosphere beneath the ridge (Armitage et al., 2015; Rychert et al., 2012). The magma could also add material to the crust and/or lithosphere (Bialas et al., 2010).
With magma-assisted rifting, the spatial variation in sharpness of the LAB is likely to be linked to the supply of melt into the lithosphere and as such S-to-P receiver functions may also provide a tool to test mechanisms of melt generation. The involvement of hot plume material has been presented as a mechanism of rift initiation and lithosphere weakening (Furman, 2007; Schmeling, 2010; White & McKenzie, 1989). However, the location and degree of influence of such a plume nowadays is highly debated (Armitage et al., 2015; Civiero et al., 2016; Ebinger & Sleep, 1998; Rychert et al., 2012; White & McKenzie, 1989). In addition to elevated mantle temperature, explanations for melt production during rifting processes include mantle composition (Shillington et al., 2009), melt focusing along the LAB (Holtzman & Kendall, 2010), or prerift history (Armitage et al., 2010). Knowing the depth of melting and if partial melt is present in the lithosphere will aid discrimination between models of rifting.
Presence of melt in the mantle can modify the sharpness of the LAB in two different ways. If partial melt is ponding along the LAB interface (Rychert et al., 2005, 2007) then the velocity decrease expected by the tran-sition from asthenosphere to lithosphere would occur over a smaller depth range than with an interface only thermally defined. In this scenario the solidus would prevent melt from rising into the lithosphere and it is thought to be what defines the LAB in itself (Fischer et al., 2010; Rychert et al., 2005, 2007; Tharimena Figure 1. Map of the northern East African Rift with network distribution.
Green triangles are the stations used in this study. Red triangles are Quaternary-Recent volcanoes. Purple shades are active magmatic segments. Red lines are border faults. Left insert is the location of the teleseismic earthquakes used in this study (red stars). Blue rectangle is the study area.
10.1029/2018GC007463
et al., 2017). The second scenario is where melt crosses the LAB. This vertical distribution of melt would destroy the LAB signature as there would be no velocity constrast (Dugda et al., 2007; Hopper et al., 2014; Rychert et al., 2012).
Previous P-to-S receiver function studies (Dugda, 2005; Hammond et al., 2011; Reed et al., 2016; Stuart et al., 2006) have constrained variations in crustal thickness and ratio of P wave to S wave velocities (Vp/Vsratio) in
the region. These studies show that the crust varies from 40–45 and 35 km thick beneath the Ethiopian and Somalian plateaux, respectively, to 26 km thick beneath the northernmost MER (Hammond et al., 2011; Stuart et al., 2006), 20–26 km thick beneath Afar (Hammond et al., 2011; Reed et al., 2016), and 16 km thick beneath northernmost Afar (Hammond et al., 2011). Vp/Vsratio varies from ~1.8 beneath the Ethiopian plateau not
covered byflood basalts to 1.9 beneath the flood basalt provinces and above 1.95 beneath the rift. The data was interpreted to show that extension occurs by a combination of mechanical and magmatic extension, with magma intrusion mostly focused within the rift (Hammond et al., 2011). They also show that the high
Vp/Vsratios result from aligned melts in the rift (Hammond et al., 2014). The results of these receiver functions
studies concur with wide-angle reflection/refraction studies (Mackenzie et al., 2005; Maguire et al., 2006; Makris & Ginzburg, 1987) and inversion of gravity data for crustal thickness (Makris & Ginzburg, 1987; Tiberi et al., 2005). These studies also suggest presence of lower crustal intrusions beneath theflood basalt provinces of the Ethiopian plateau (Mackenzie et al., 2005; Maguire et al., 2006; Makris & Ginzburg, 1987; Tiberi et al., 2005).
Previous teleseismic body and surface wave tomography studies constrained spatial variation in mantle wave speeds (Bastow et al., 2005; Gallacher et al., 2016; Hammond et al., 2013). These are broadly consistent in spa-tial variations of seismic wave speeds with the absolute shear velocity (Vs) maps of Gallacher et al. (2016),
showing that the seismic wave speeds of the upper mantle beneath the Ethiopian plateau are relatively fast (Vsof 4.3–4.4 km/s) compared to the rift valley. Seismic velocities are slower beneath the rift, with absolute Vs
of 3.85–4.0 km/s, best explained by a small fraction (<1%) of partial melt in the upper mantle. The spatial var-iation of slow Vsis not continuous beneath the rift, but instead segmented in nature (Gallacher et al., 2016;
Hammond et al., 2013). Other recent seismology studies found evidence of melt in the crust and upper man-tle beneath the Afar rift and velocities 5–10% slower than global average (Bastow et al., 2008; Civiero et al., 2016; Fishwick, 2010; Hammond et al., 2011; Kendall et al., 2005).
A joint inversion of Rayleigh wave velocities and receiver functions (Dugda et al., 2007) and a previous S-to-P receiver function study (Rychert et al., 2012) imaged the shear velocity structure of the crust and upper man-tle beneath the Afar rift. They both identified a shear velocity decrease at 60- to 80-km depth beneath the Ethiopian plateau, consistent with the velocity decrease expected for the LAB. Therefore, the lithosphere in Ethiopia is 30 to 50 km thinner than beneath the central and southern part of the East African Rift (Dugda et al., 2007; Fishwick & Bastow, 2011), showing evidence for more extension and/or more lithospheric mod-ification from magmatism beneath Ethiopia. In the two studies no strong LAB is imaged beneath the MER and Afar. They suggest that partial melting is required, in addition to temperature, to explain the shear velocity structure in the region (Dugda et al., 2007; Rychert et al., 2012).
Here we present a S-to-P receiver functions study and image lithospheric structures in the northern EARS with improved resolution, including new data sets in comparison to previous study and extending coverage to the southern MER and southwest Arabia.
2. Data and Methods
2.1. Data
We use an array of 182 seismic stations deployed during 1997–2015 in the Afar depression, MER and surrounding plateaux in Ethiopia but also stations in Djibouti, Eritrea, and Yemen. Data are sourced from different projects including the Ethiopian Afar Geoscientific Lithospheric Experiment (EAGLE) deployment in 2001–2003 (e.g., Bastow et al., 2005; Keir et al., 2006; Stuart et al., 2006), the Afar Consortium project in 2007–2009 (e.g., Hammond et al., 2011; Belachew et al., 2011), the Geoscope station ATD in Djibouti in 1993–2010 (e.g., Debayle et al., 2001; Sicilia et al., 2008), a temporary Eritrean deployment in 2011–2012 (e.g., Hammond et al., 2013; Goitom et al., 2015), the YOCMAL project in Yemen in 2009–2011 (Ahmed et al., 2013; Korostelev et al., 2014, 2015), and a French deployment in Djibouti in 2009–2011 (Figure 1).
The majority of the data is publicly available and was downloaded from the Incorporated Research Institutions for Seismology (IRIS) database. All instruments are three-component broadband seismometers with varying natural period, including Güralp models CMG-40TD (0.01–30s), CMG-ESP (0.02–60s), CMG-6TD (0.01–30s), CMG-3TD (0.02–120 s), and Streckeisen model STS-2 (0.1–120 s).
2.2. Methods:S-to-P Receiver Functions
To image lithospheric structures beneath the northern EARS we use S-to-P (Sp) receiver functions. In this method, the deconvolution of the S wave from the P component removes source and instrument effects, illu-minating the seismic velocity discontinuities. In Sp receiver functions, reverberations associated with the crust (commonly the Moho or strong intracrustal interfaces) arrive after the direct phase, whereas direct con-versions arrive before it. The separation prevents contaminations of the direct arrivals from crustal multiples, allowing us to better image lithospheric structures, such as the lithosphere-asthenosphere boundary. We use teleseismic earthquakes from 55–80° and of all magnitudes. We picked 16,076 waveforms from 182 stations, compared to the 10,737 waveforms from 100 stations used in the previous Sp study (Rychert et al., 2012). We will hence improve resolution. In this study we manually pick and rate all the waveforms as well as their deconvolution to select only the best quality waveforms. This results in a more selective data set than pre-vious studies with 3,688 best quality waveforms (1,215 from the EAGLE, ATD and Afar network, 2,183 from the IRIS database, 171 from the Eritrean stations, and 119 from the Djibouti network). Waveforms are band-passfiltered to higher frequencies, 0.03–0.25 Hz, to get finer-scale resolution compared to previous receiver functions study using a similar methodology (Rychert et al., 2012). The waveforms are then decon-volved in the frequency domain using an extended time multitaper technique (Helffrich, 2006; Rychert et al., 2012).
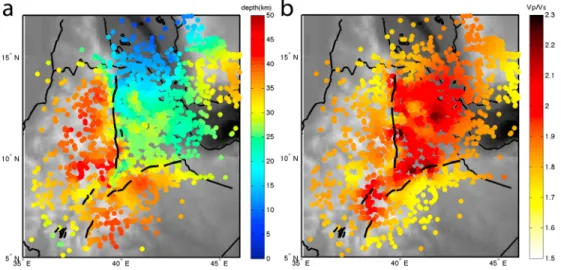
We inverse the polarity of the waveforms so that it is consistent with P-to-S (Ps) imaging and that a positive phase represents a velocity increase with depth and a negative phase a velocity decrease with depth. We migrate the waveforms in 3-D using a crustal model specific to each waveform (Figure 2). We calculate the piercing points at 32 km assuming IASP91 and, for each of these piercing points, we use the crustal thickness and Vp/Vsratio obtained from Hammond et al. (2011) model developed by H-κ stacking of Ps waveforms. To
get those values we take the nearest point in the interpolated grid of Hammond et al. (2011) Figure 2. We use IASP91 for regions and depths not included in Hammond et al. (2011). We then calculate Vs, assuming an average Vp of 6.25 km/s (Hammond et al., 2011, and references therein). Waveforms are binned on a
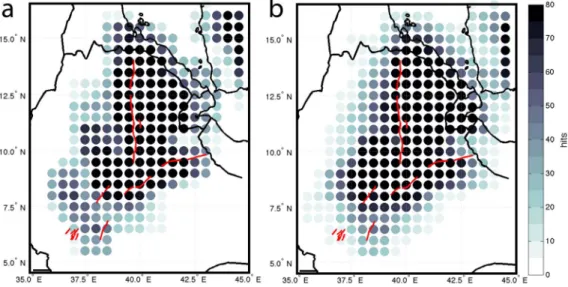
50 × 50-km grid, which is then smoothed with a radius corresponding to the Fresnel zone of a waveform at a given depth. Only bins with at least three traces are included, providing high coverage of the northern EARS (Figure 3).
Figure 2. Models used for the migration plotted on the conversions points (80 km) of Sp receiver functions. (a) Crustal thickness and (b) Vp/Vsratio both from Hammond et al. (2011). The model uses a thin crust beneath Afar and the MER and a higher Vp/Vsratio beneath the rift than beneath the adjacent plateaux.
10.1029/2018GC007463
2.3. Methods: Waveform Modeling
Synthetic waveform forward modeling is conducted with three representative regions from the Afar depres-sion, the MER, and the Ethiopian plateau. First, for each region, we compute waveform stacks of the data. We calculate which waveforms convert within the given bin at 5-km depth intervals and then deconvolve and migrate each of these sections to depth in 1-D using the same multitaper and migration model applied for our 3-D model. We then stack these sections andfilter the result to get a 1-D waveform stack for each of the three bins. Our waveforms are primarily sensitive to shear wave velocity (Rychert et al., 2007) and we cre-ate a 1-D shear velocity model for each bin, assuming Vp/Vsratios of 2.0 (Afar), 1.95 (MER), and 1.9 (Ethiopian
plateau), values based on previous studies (Hammond et al., 2011). We calculate the synthetic seismograms using the reflectivity method of Shearer and Orcutt (1987). The seismograms are then simultaneously decon-volved (Bostock, 1998; Rychert et al., 2007) and migrated to depth with the input velocity model to model the receiver function representative of the Earth’s impulse response. This method provides weak constraints on absolute velocity but gives a good picture of the velocity changes. A phase is considered significant if the bootstrap limit is above or below zero in case of positive or negative polarity, respectively.
3. Results
3.1. Major Discontinuities
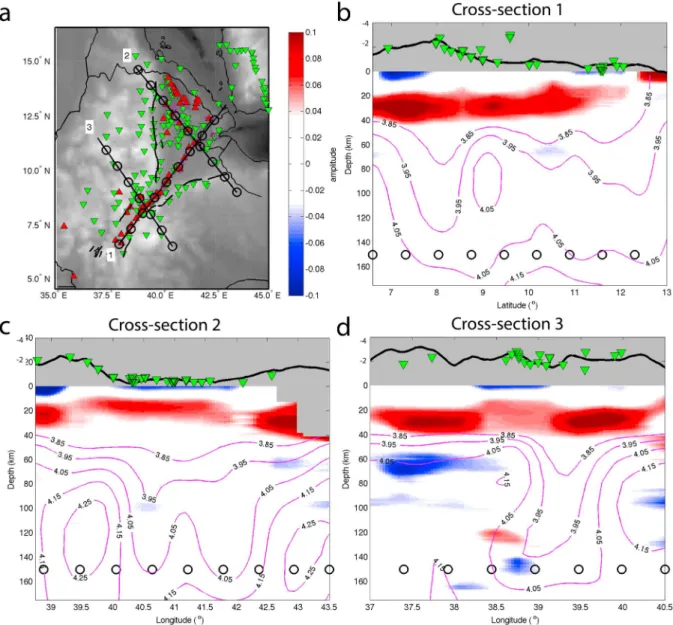
To understand the significant lithospheric features beneath the northern EARS, we produced images of litho-spheric structures as cross sections of the migrated receiver functions at representative locations along and across the rift zones (Figure 4). The shallowest discontinuity that we image is at 17–35-km depth and charac-terized by a positive polarity. The depth of this increase in seismic velocity with depth is consistent with pre-vious estimates of the Moho depth based on H-κ stacking of Ps receiver functions (Hammond et al., 2011) and joint inversions of surface waves and Ps receiver functions (Dugda et al., 2007). The other feature besides the Moho is a negative polarity at around 65 km beneath the Ethiopian plateau, with little variability in depth. This interface is clearly imaged beneath the plateau but is generally absent or low amplitude in most places beneath the rift zones (Figures 4b–4d). The depth of this negative discontinuity is broadly consistent with the 75-km-deep LAB imaged by previous Sp receiver functions (Rychert et al., 2012) and also with the gradual drop in velocity from 40 to 150 km from surface waves (Fishwick, 2010). The discontinuity is observed in regions where generally higher velocities exist, in comparison to the rift, in regional surface waves (Gallacher et al., 2016), even if this study found less evidence for a velocity decrease with depth in the areas of our cross sections (Figure 4d). In order to discuss the spatial variability of those two interfaces, the Moho and the LAB, we compute maps of their depth in the study area (Figures 6 and 8b). The error bars for the depth of each interface are standard deviations by region.
Figure 3. Hit count maps at (a) 30 km and (b) 65 km showing the data coverage for this study. Number of waveforms that contribute to each 50 × 50-km bin. This shows a high coverage for the MER, Afar, and the adjacent Ethiopian plateau.
3.2. Moho
Cross sections 1 to 3 (Figures 4b–4d) show a major positive feature at a depth of 35 to 17 km. The observed Moho depth beneath the Ethiopian plateau varies from 31 ± 6 km in the south to 26 ± 3 km in the north (Figure 6). Beneath the rift, the Moho thins to 26 ± 3 km in southern Afar and to 23 ± 2 km in northern Afar (Figure 6). Going further than previous studies we extended our analysis further south along the MER to constrain and image the crust to be 28 ± 3 km thick (Figure 6). The Moho signal is strong beneath the Ethiopian plateau but weaker beneath the rift in the MER and Afar. In cross section 3 a larger positive signal is visible beneath the rift valley and west of the MER (Figure 4d).
3.3. Lithosphere-Asthenosphere Boundary
Cross section 3 (Figure 4d) shows a seismic velocity decreasing with depth at 67 ± 3 km beneath the Ethiopian plateau, consistent with the gradual decrease in seismic velocity at the base of the seismic fast lid from surface waves (Gallacher et al., 2016). However, its existence is discontinuous beneath the overall region: though it is present beneath the Ethiopian and Somalian plateaux (cross sections 2 and 3; Figure 4. Cross sections. (a) Cross-section locations. (b) Cross section 1 along the rift. (c and d) Cross sections 2 and 3 across northern Afar and the MER, respectively. Positive polarity amplitudes, in red, represent velocity increasing with depth. Negative polarity amplitudes, in blue, represent velocity decreasing with depth. Black circles at 150-km depth show 100-km intervals. Red triangles on the map are Quaternary-Recent volcanoes. Green triangles are the stations used. Bins with less than three waveforms are not shown. Pink contours are shear velocity (3.85–4.15 km/s; from Gallacher et al., 2016). Only major features are interpreted.
10.1029/2018GC007463
Figures 4c and 4d), it is not imaged beneath northern and central Afar (cross sections 1 and 2; Figures 4b and 4c) and beneath the rift valley of the MER (cross sections 1 and 3; Figures 4b and 4d). In cross sections 1 and 3 (Figures 4b and 4d), the absence of an imaged LAB correlates with the slowest shear velocities from Gallacher et al. (2016). There is less correlation in cross section 2 (Figure 4c). The absence of an imaged LAB in the cross sections can be linked either to a velocity decrease too gradual to be imaged by Sp receiver functions or a low-amplitude to nonexistent LAB signal. We tested those hypotheses with waveform modeling.
3.4. Waveform Modeling
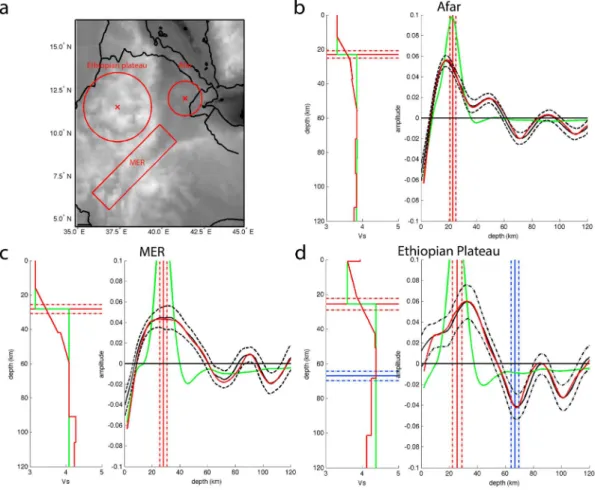
In order to get an insight into the velocity changes responsible for the structures of the northern EARS, we computed three synthetic forward models for three representative areas (Figure 5a). The three velocity pro-files in Figures 5b–5d (left graphs) show the observed waveforms and their 95% confidence limit (right graphs) for Afar (Figure 5b), the MER (Figure 5c), and the Ethiopian plateau (Figure 5d), respectively. Standard deviation error bars (dashed black lines; Figure 5) showing the 95% confidence limit are calculated from bootstrap tests. A wide range of velocity contrasts (sharp and gradual contrasts from 0 to 50% velocity change) and crustal structures (multiple or single boundaries at different interval, structural models proposed in previous studies) were tested to strengthen the results and the bestfitting model for each representative region is shown in red. Very different velocity changes are required to explain each waveform. Error bars in depth/magnitude of the velocity gradient are determined by the depth/amplitude shift of the synthetic model at which the modeled waveform intersects with the bootstrap error bar.
Figure 5. Synthetic waveform modeling. (a) Locations of the three representative bins. (b) Afar. (c) MER. (d) Ethiopian pla-teau waveform modeling. Left graph is the shear velocity model with a sharp Moho model (green) and the bestfitting model (red). Right graph is the waveform modeling showing data (black line) with 95% confidence limits from bootstrap test (dashed black lines), synthetic waveform from the sharp Moho model (green line), and synthetic waveform from the bestfitting model (red line). Red and blue lines represent an increase and a decrease in velocity, respectively. Average depths of interfaces from Sp receiver functions results (full lines) are represented with standard deviation error (dashed-dotted lines).
In Afar (Figure 5b), a positive peak representative of the Moho depth is observed, centered at 18 km, best fitted with a gradual Moho. The best fit crustal model has a shear velocity increasing by 11 ± 1% from 14 to 26 km then by 2 ± 1% from 26 to 37 km. The range 14–26 km for the Moho depth fits with the range 21–25 km of crustal thicknesses found in this study (solid and dashed-dotted red lines). A second deeper positive phase at 49 km requires a 4 ± 1% velocity increase from 37 to 56 km. It could be related to frozen-in basaltic intrusions or the base of a melt rich layer (Rychert et al., 2012). Beside the Moho, there is a negative peak at 72 km (blue dashed line), not significant in term of velocity change and primarily an artifact caused by the sidelobe of the shallower positive phase, with potential smearing from the nearbyflank. The other negative phase at 112 km is also not significant in velocity change and is possibly related to complex lateral variability.
Beneath the MER (Figure 5c), we can see a very large peak centered at 29-km depth. There is no negative peak visible at LAB depth, the synthetic modelfits the data by a sidelobe linked to the large Moho peak. There is an 5 ± 1% increase in velocity with depth at 91 km (red dashed line), which may be related to the base of melt, as suggested in previous studies (Armitage et al., 2015; Rychert et al., 2012). However, we see no evidence for this discontinuity in our cross sections, and in addition, there is another negative phase at greater depth (112 km). Therefore, this stack may be affected by waveform interference, lateral smearing of off-rift structure, and/or dipping structures. Indeed, double phases such as those seen in the data waveforms are indicative of dipping structures (Lekić & Fischer, 2017), and a topic of future work.
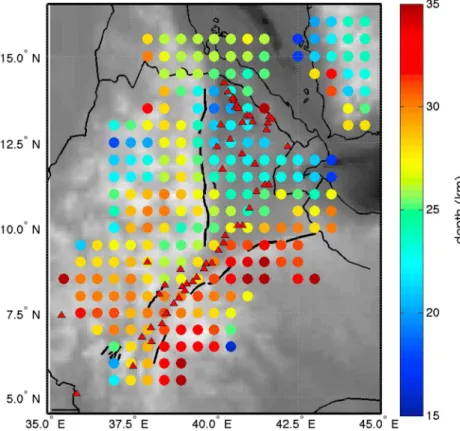
Figure 6. Map of Moho depth from Sp receiver functions results. Bins represent a 50 × 50-km grid. Only bins with more than three waveforms are plotted. Red triangles are Quaternary-Recent volcanoes.
Figure 7. Graph comparing Moho depth estimates beneath seismic stations from this study and Hammond et al.’s (2011) study. Error bars for this study are calculated by region. The black dashed line represents perfect agree-ment. See text for further discussion.
10.1029/2018GC007463
The Ethiopian plateau crustal structures (Figure 5d) are described by a complicated positive structure starting at very shallow depth with a peak centered at 33-km depth. The negative peak is stronger with a 3 ± 2% drop at 69 ± 2 km. This is consistent with the depth of our interpreted LAB on the above cross sections (solid and dashed-dotted blue lines).
4. Discussion
4.1. Crust Compared to Previous Studies
The range of crustal thicknesses of 17–35 km in our study is broadly consistent with previous models, for example 15–45 km (Hammond et al., 2011) and 36–42 km (Cornwell et al., 2010) based on H-κ stacking of
Ps receiver functions and 25–45 km based on joint inversion of surface waves and Ps receiver functions
(Dugda et al., 2007). A direct comparison of crustal thickness (Figure 7) shows good agreement in Afar, with northern and southern Afar results particularly consistent. However, the main discrepancies in the results are beneath the Ethiopian plateau (Figure 7).
Beneath the Ethiopian plateau, our Moho depths range from 20 to 35 km (Figures 6 and 7) and Hammond et al. (2011) depths from 32 to 45 km. Therefore, our crust is 12 ± 6 km shallower than imaged by Ps receiver functions. However, discrepancies between P-to-S and S-to-P Moho depths are not uncommon, and might even be expected in volcanic regions where the crust may contain multiple layers and complexities (e.g., Rychert et al., 2013, 2014, 2018). Waveform modeling (Figure 5) suggests a complicated crustal structure beneath the plateau that explains the wide range of thicknesses. In particular, we require a 22-km gradual increase in shear velocities across the lower crust, rather than a sharp boundary, to model the transition from the crust to the mantle. Given previous evidence from seismology and gravity studies for an up to 10-km-thick high velocity-high density layer in the lower crust beneath the Ethiopian plateau near the MER (Cornwell et al., 2006; Mackenzie et al., 2005), the gradual shear velocity structure of the crust in this region is likely caused by the presence of lower crustal intrusions widely distributed beneath the Ethiopian plateau. Though the Moho depth map (Figure 6) represents the depth of the signal’s peak amplitude, cross sections show the structure of the crust. In cross section 3 (Figure 4d), we can see that while the top of our interpreted Moho phase thins beneath the MER and westward beneath the plateau, the bottom part of the signal isflat throughout the cross section. The images are consistent with the waveform modeling and provide evidence Figure 8. Maps of the LAB (a) amplitude and (b) depth from Sp receiver functions results. Only depths where amplitude< 0.03 are plotted. Bins represent a 50 × 50-km grid. Only bins with more than three waveforms are plotted. Red triangles are Quaternary-Recent volcanoes. Pink contours are slowest (3.85–3.95 km/s) shear velocity at 40–100 km (from Gallacher et al., 2016).
for the presence of a gradational Moho. Such a character to the lower crust is especially pronounced around 9°N, where it correlates with Miocene to Recent volcanic centers near the MER margin and on the plateau (Figure 6). The combination of our seismic images and waveform modeling suggest the surface expression of volcanism on the Ethiopian plateau and parts of the rift are associated with significant thickness of lower crustal intrusions. These intrusions are thought to be emplaced by theflood basalt volcanism ~30 Myr ago and from Miocene to ongoing rift flank magmatism (Keir et al., 2009; Whaler & Hautot, 2006). The observations are similar to the mafic intrusions in the lower crust at the Baikal rift, extending to the northwest side of the rift valley (Thybo & Artemieva, 2013; Thybo & Nielsen, 2009). In Siberia magmatic intrusions compensate the Moho uplift expected from lithosphere stretching, which could explain the base of the gradual velocity contrast interpreted to be the Moho beingflat at the location of lower crustal intrusions. Hammond et al. (2011) also suggest that their wide range of thicknesses beneath the Ethiopian plateau could be explained by highly intruded lower crust. There are similar lower crustal intrusions creating a major velocity contrast above the Moho beneath central Afar (Hammond et al., 2011; Makris & Ginzburg, 1987; Stab et al., 2016), particularly beneath the Dabbahu-Manda Harraro magmatic segment. That can explain the few differences between our crustal thicknesses and those estimated by Hammond et al. (2011) in central Afar (Figure 7).
4.2. LAB Beneath Northern EARS
Lithospheric thickness and behavior of the LAB show evidence for a magmatic component as mechanism of rifting in the northern EARS. The sharp LAB phase observed beneath the Ethiopian plateau in our cross sections and waveform modeling suggests a variation in bulk composition, volatile content, or melt (Hopper et al., 2014). Indeed, effects of temperature and pressure alone would create velocity gradients over broad depth ranges (>50 km), as observed for cratonic lithosphere (Hopper et al., 2014). For the Ethiopian plateau, partial melt ponding at the base of the lithosphere is a plausible cause of this sharp LAB. GPS measurements show direct evidence for 1–2 mm/year of ongoing extension across the Ethiopian plateau (Birhanu et al., 2016; Doubre et al., 2017), providing a mechanism to generate partial melt (Birhanu et al., 2016). Such a hypoth-esis is consistent with the low-velocity anomaly imaged in the uppermost mantle beneath the Ethiopian pla-teau, and with presence of Holocene to Recent volcanism (Civiero et al., 2015, 2016).
The locations where there is no LAB signal beneath the rift valley in Afar and the MER correlate with the pre-sence of Quaternary to Recent volcanism which lavas are thought to derived by melting at lithospheric depth (Furman, 2007; Furman et al., 2006). They also correlate with where the surface waves model of Gallacher et al. (2016) shows the slowest shear velocities Vs(Figures 4b–4d and 8) and agrees with P wave tomography studies (Hammond et al., 2013), receiver functions (Rychert et al., 2012), and surface wave and receiver func-tion inversions (Dugda et al., 2007). Gallacher et al. (2016) found an absolute Vsof 3.85–4.0 km/s beneath Afar
and the MER. Those velocities would require mantle temperatures of 1,650–1,700 °C with a temperature only model. However, Gallacher et al. (2016) showed evidence that presence of partial melt is another way of matching their observations and is more consistent with petrological estimations (Rooney et al., 2012). They interpreted their locations of slowest shear velocities as regions of retained melt. The presence of partial melt in the sub crustal mantle beneath the rift would explain the absence of an imaged LAB in our study, since the melt would likely reduce seismic velocity (Hammond & Humphreys, 2000) and eliminate any velocity decrease with depth associated with the fast lid. If melt is retained in these regions it would also likely reduce mantle viscosity (Hirth & Kohlstedt, 1996; Jackson et al., 2006; Rychert et al., 2005). Such a weakened layer may be an important factor in facilitating rifting (Huismans & Beaumont, 2007).
We observe less evidence for the subtle velocity increase at ~75-km depth previously imaged by S-to-P receiver functions and interpreted as the base of a melt rich region (Rychert et al., 2012). This feature was previously imaged beneath the MER as a low-amplitude phase just above the noise level from migrated Sp receiver functions at lower frequency. Our large waveform stack from the MER (Figure 5c) may support a velo-city increase, with waveform modeling suggesting a gradual velovelo-city increase from 40- to 60-km depth and a subtle increase at 90-km depth. This could be related to the velocity increase imaged by Rychert et al. (2012) and related to the base of a melt-rich layer suggested by petrology and geochemistry (Ferguson et al., 2013; Rooney et al., 2005) and supported by geodynamic modeling (Armitage et al., 2015). However, the waveforms are complicated and the increase at 90 km in the large waveform stack could also be caused by waveform interference and/or lateral complexity making strong interpretation tenuous.
10.1029/2018GC007463
The reason for the discrepancy may be related to the higher-frequency contents of the waveforms in our study and a gradual velocity gradient in depth. Gradual velocity gradients can be imaged by S-to-P receiver functions if relatively strongfiltering is applied to the data (e.g., low pass of 0.06 Hz; Mancinelli et al., 2017). The low-passfilter applied by Rychert et al. (2012) was lower (0.175 Hz) in comparison to that used in this study (0.25 Hz). Moreover, inspecting our data set, wefind that because we used this higher-frequency con-tent, we also picked more impulsive S waves with generally shorter dominant periods, and used shorter source windows overall. These shorter period waveforms start to lose significant amplitude when gradients occur over more than 20–30 km (Rychert et al., 2010). This kind of amplitude loss (>25%) would mean that the phase that was barely significant in Rychert et al. (2012) would not necessarily be significant from zero amplitude in our study. This suggests that the velocity gradient may be gradual, which is also generally con-sistent with the results from our large waveform bin from the region, and also reasonably expected for a phase from the base of melting (Rychert et al., 2012).
4.3. Models of Rifting
Assuming that the Arabian platform is unaffected by extensional processes (Hansen et al., 2007), we can use it as a reference point to estimate the Oligocene to Recent extension of the northern EARS. Using the undeformed crust of 40–45 km beneath the Arabian platform from Hansen et al. (2007) and the crustal thicknesses from our waveform modeling results, wefind stretching factors (i.e., original crustal thickness divided byfinal thickness) of 1.2–1.4 for the Ethiopian plateau, 1.4–1.5 for the MER, and 2.2–2.5 for Afar. There is greater thinning of the crust beneath Afar than beneath the rest of the region. We notice a crustal stretching factor>1 beneath the Ethiopian plateau. This can potentially be explained by our study under-estimating crustal thickness because we image the higher-velocity contrast created from continental mid-crust to mafic lower crust, rather than the lower velocity contrast between mafic lower crust and mantle. Our waveform modeling shows a gradational Moho beneath the plateau, and when we consider the base of the velocity increase (~40 km), it is more consistent with a stretching factor of 1. This implies that crus-tal thinning beneath the Ethiopian plateau is fully compensated by magmatic intrusions in the lower crust. Estimated stretching factors for the crust beneath the rift overlap with the lower end of the range of exten-sion predicted in plate reconstructions models (1.2–3 Eagles et al., 2002; 2–4 Redfield et al., 2003). These low values could again be explained by intrusion compensated crustal thinning. However, in this case, our wave-form modeling supplemented by previous controlled source images of the crust (e.g., Mackenzie et al., 2005) suggests that intrusions are distributed through a range of crustal depths, causing the highest observed velo-city contrast to still be the base of the intruded crust. Our estimates of the stretching factor include the pre-sence of new intruded material and are therefore underestimates. This magma-compensated crustal thinning is supported in Afar by structural analysis and radiodating (Stab et al., 2016) and by refraction and gravity study (Makris & Ginzburg, 1987), providing evidence of the involvement of mafic intrusions in the lower crust during crustal stretching.
The lithosphere beneath the Arabian platform has been resolved at 160 km (Hansen et al., 2007) and our LAB depth at 66 km beneath the Ethiopian plateau. Assuming that the lithosphere beneath Ethiopia had a similar thickness to that of Arabia prior to rifting andflood basalt volcanism, this shows evidence that there has been plate thinning over the last 35 Myr. Taking the current 1–2-mm/year extension observed across the Ethiopian plateau (Birhanu et al., 2016) as representative of the broad extension since rifting initiated, the plateau should have extended by 35–70 km. Considering the plateau ~400 km wide at the present, the stretching factor for the plateau is 1.1–1.2, which represents a 130–145-km-thick lithosphere. This does not correlate with the 66-km-thick lithosphere currently observed beneath the Ethiopian plateau. We therefore appeal to our previous interpretation that the lithosphere has probably undergone thermal thinning on a regional scale from the impact of the plume associated withflood basal volcanism (e.g., Dugda et al., 2007). We do not resolve thinning of the lithosphere beneath the rift but instead we cannot resolve a significant LAB, suggesting presence of partial melt in the mantle. This favors a magma-assisted rifting mechanism (Buck et al., 1999; Kendall et al., 2005) with the lithosphere heavily modified by melt infiltration, rather than by mechanical stretching.
Our observations beneath the Ethiopian plateau are similar to lithospheric structure beneath the rift sides of the Salton Trough in the Gulf of California (Lekić et al., 2011). The LAB beneath the flanks of the Salton
Trough is imaged at around 70-km depth, similar to our results beneath the Ethiopian plateau. However, Lekić et al. (2011) do image a well-defined LAB beneath the rift itself at around 40 km. The thinning of the lithosphere in this region differs from our observations of a weak butflat LAB beneath the northern EARS. Lekić et al. (2011) interpret the rifting of the Salton Trough as either a greater thinning of the man-tle lithosphere compared to the crust or as a weakening of the manman-tle lithosphere by melt intrusion. In our case, we show evidence for a melt intrusion mechanism beneath the northern EARS. No LAB imaged beneath a zone of magmatic activity has also been observed beneath the active Yellowstone caldera (Hopper et al., 2014). They interpreted that elevation in temperatures and partial melt infiltrating the lithosphere have destroyed the velocity lid, similar to our own interpretation in the MER and localized areas in Afar.
5. Conclusions
This S-to-P receiver functions study provides new estimates of lithospheric structures in the northernmost EARS. The new high-resolution images suggest that the crust has significantly thinned beneath the rift with greater thinning toward the Afar depression. We show that the crust is 31 ± 6 km thick beneath the Ethiopian plateau, 28 ± 3 km thick beneath the rift valley of the MER, and 23 ± 2 km thick beneath the Afar depression, consistent with the amount of extension in the region. We also provide evidence for lower crustal intrusions beneath localized areas of the Ethiopian plateau. The LAB is clearly imaged at around 67 ± 3 km beneath the Ethiopian plateau but it is not well resolved beneath the rift. Partial melt in the asthenosphere percolates through the lithosphere, masking the reduction in shear velocity representative of the LAB. Our observations and modeling of Sp receiver functions provide evidence that the lithosphere is deformed by magma injection and infiltration.
References
Ahmed, A., Tiberi, C., Leroy, S., Stuart, G. W., Keir, D., Sholan, J., et al. (2013). Crustal structure of the rifted volcanic margins and uplifted plateau of western Yemen from receiver function analysis. Geophysical Journal International, 193(3), 1673–1690. https://doi.org/10.1093/ gji/ggt072
Anderson, D. L., & Sammis, C. (1970). Partial melting in the upper mantle. Physics of the Earth and Planetary Interiors, 3, 41–50. https://doi.org/ 10.1016/0031-9201(70)90042-7
Armitage, J. J., Ferguson, D. J., Goes, S., Hammond, J. O. S., Calais, E., Rychert, C. A., & Harmon, N. (2015). Upper mantle temperature and the onset of extension and break-up in afar, Africa. Earth and Planetary Science Letters, 418, 78–90. https://doi.org/10.1016/ j.epsl.2015.02.039
Armitage, J. J., Collier, J. S., & Minshull, T. A. (2010). The importance of rift history for volcanic margin formation. Nature, 465(7300), 913–917. https://doi.org/10.1038/nature09063
Bastow, I. D., Nyblade, A. A., Stuart, G. W., Rooney, T. O., & Benoit, M. H. (2008). Upper mantle seismic structure beneath the Ethiopian hot spot: Rifting at the edge of the African low-velocity anomaly. Geochemistry, Geophysics, Geosystems, 9, Q12022. https://doi.org/10.1029/ 2008GC002107
Bastow, I. D., Stuart, G. W., Kendall, J. M., & Ebinger, C. J. (2005). Upper-mantle seismic structure in a region of incipient continental breakup: Northern Ethiopian rift. Geophysical Journal International, 162(2), 479–493. https://doi.org/10.1111/j.1365-246X.2005.02666.x
Belachew, M., Ebinger, C., Coté, D., Keir, D., Rowland, J. V., Hammond, J. O. S., & Ayele, A. (2011). Comparison of dike intrusions in an incipient seafloor-spreading segment in Afar, Ethiopia: Seismicity perspectives. Journal of Geophysical Research, 116(B6), B06405. https://doi.org/ 10.1029/2010JB007908
Bialas, R. W., Buck, W. R., & Qin, R. (2010). How much magma is required to rift a continent? Earth and Planetary Science Letters, 292(1–2), 68–78 . https://doi.org/10.1016/j.epsl.2010.01.021
Birhanu, Y., Bendick, R., Fisseha, S., Lewi, E., Floyd, M., King, R., & Reilinger, R. (2016). GPS constraints on broad scale extension in the Ethiopian highlands and main Ethiopian rift. Geophysical Research Letters, 43, 6844–6851. https://doi.org/10.1002/2016GL069890
Bostock, M. G. (1998). Mantle stratigraphy and evolution of the slave province. Journal of Geophysical Research, 103(B9), 21183–21200. https://doi.org/10.1029/98JB01069
Buck, W. R., Lavier, L., & Poliakov, A. N. B. (1999). How to make a rift wide. Philosophical Transactions of the Royal Society A: Mathematical,
Physical and Engineering Sciences, 357(1753), 671–693. https://doi.org/10.1098/rsta.1999.0348
Civiero, C., Goes, S., Hammond, J. O. S., Fishwick, S., Ahmed, A., Ayele, A., et al. (2016). Small-scale thermal upwellings under the northern East African Rift from S travel time tomography. Journal of Geophysical Research: Solid Earth, 121, 7395–7408. https://doi.org/10.1002/ 2016JB013070
Civiero, C., Hammond, J. O. S., Goes, S., Fishwick, S., Ahmed, A., Ayele, A., et al. (2015). Multiple mantle upwellings in the transition zone beneath the northern east-African rift system from relative P-wave travel-time tomography. Geochemistry, Geophysics, Geosystems, 16, 2949–2968. https://doi.org/10.1002/2015GC005948
Cornwell, D. G., Mackenzie, G. D., England, R. W., Maguire, P. K. H., Asfaw, L. M., & Oluma, B. (2006). Northern Main Ethiopian Rift crustal structure from new high-precision gravity data. Geological Society, London, Special Publications, 259(1), 307 LP-321. http://sp.lyellcollec-tion.org/content/259/1/307.abstract
Cornwell, D. G., Maguire, P. K. H., England, R. W., & Stuart, G. W. (2010). Imaging detailed crustal structure and magmatic intrusion across the Ethiopian Rift using a dense linear broadband array. Geochemistry, Geophysics, Geosystems, 11, Q0AB03. https://doi.org/10.1029/ 2009GC002637
10.1029/2018GC007463
Geochemistry, Geophysics, Geosystems
Acknowledgments
The majority of seismic data was downloaded from the IRIS-DMC. Many of the data from Ethiopia, Yemen, and Eritrea were collected using the facilities of SEIS-UK supported by the Natural Environment Research Council under agreement R8/H10/64. D.K. is supported by NERC grant NE/L013932/1. The instruments deployed in Djibouti belong to the French national pool of portable seismic instruments Sismob-RESIF. We acknowledge funding from the Natural Environment Research Council (NE/K000985/1 and NE/M003507/1) and the European Research Council (GA 638665). We acknowledge our primary in-country collaborators, Atalay Ayele, Berhe Goitom, and Abdulhakim Ahmed.
Corti, G. (2012). Evolution and characteristics of continental rifting: Analog modeling-inspired view and comparison with examples from the east African rift system. Tectonophysics, 522-523(1), 1–33. https://doi.org/10.1016/j.tecto.2011.06.010
Debayle, E., Lévêque, J. J., & Cara, M. (2001). Seismic evidence for a deeply rooted low-velocity anomaly in the upper mantle beneath the northeastern Afro/Arabian continent. Earth and Planetary Science Letters, 193(3–4), 423–436.
https://doi.org/10.1016/S0012-821X(01)00509-X
Doubre, C., Déprez, A., Masson, F., Socquet, A., Lewi, E., Grandin, R., et al. (2017). Current deformation in central afar and triple junction kinematics deduced from GPS and InSAR measurements. Geophysical Journal International, 208(2), 936–953. https://doi.org/10.1093/gji/ ggw434
Dugda, M. T. (2005). Crustal structure in Ethiopia and Kenya from receiver function analysis: Implications for rift development in eastern Africa. Journal of Geophysical Research, 110, B01303. https://doi.org/10.1029/2004JB003065
Dugda, M. T., Nyblade, A. A., & Julia, J. (2007). Thin lithosphere beneath the Ethiopian plateau revealed by a joint inversion of Rayleigh wave group velocities and receiver functions. Journal of Geophysical Research, 112, B08305. https://doi.org/10.1029/2006JB004918 Eagles, G., Gloaguen, R., & Ebinger, C. (2002). Kinematics of the Danakil microplate. Earth and Planetary Science Letters, 203(2), 607–620.
https://doi.org/10.1016/S0012-821X(02)00916-0
Ebinger, C. J., & Casey, M. (2001). Continental breakup in magmatic provinces: An Ethiopian example. Geology, 29(6), 527–530. https://doi. org/10.1130/0091-7613(2001)029<0527:CBIMPA>2.0.CO;2
Ebinger, C. J., & Sleep, N. H. (1998). Cenozoic magmatism throughout East Africa resulting from impact of a single plume. Nature, 395(6704), 788–791. https://doi.org/10.1038/27417
Faul, U. H., & Jackson, I. (2005). The seismological signature of temperature and grain size variations in the upper mantle. Earth and Planetary
Science Letters, 234(1–2), 119–134. https://doi.org/10.1016/j.epsl.2005.02.008
Ferguson, D. J., Maclennan, J., Bastow, I. D., Pyle, D. M., Jones, S. M., Keir, D., et al. (2013). Melting during late-stage rifting in afar is hot and deep. Nature, 499(7456), 70–73. https://doi.org/10.1038/nature12292
Fischer, K. M., Ford, H. A., Abt, D. L., & Rychert, C. A. (2010). The lithosphere-asthenosphere boundary. Annual Review of Earth and Planetary
Sciences, 38(1), 551–575. https://doi.org/10.1146/annurev-earth-040809-152438
Fishwick, S. (2010). Surface wave tomography: Imaging of the lithosphere–asthenosphere boundary beneath central and southern Africa?
Lithos, 120(1–2), 63–73. https://doi.org/10.1016/j.lithos.2010.05.011
Fishwick, S., & Bastow, I. D. (2011). Towards a better understanding of African topography: a review of passive-source seismic studies of the African crust and upper mantle. Geological Society of London, Special Publications, 357(1), 343–371. https://doi.org/10.1144/sp357.19 Furman, T. (2007). Geochemistry of east African rift basalts: An overview. Journal of African Earth Sciences, 48(2–3), 147–160. https://doi.org/
10.1016/j.jafrearsci.2006.06.009
Furman, T., Bryce, J., Rooney, T. O., Hanan, B., Yirgu, G., & Ayalew, D. (2006). Heads and tails: 30 million years of the afar plume. In G. Yirgu, C. Ebinger, & P. K. H. Maguire (Eds.), The Afar Volcanic Province within the East African Rift System, Geol. Soc. Spec. Publ, (Vol. 259, pp. 95–119).
Gallacher, R. J., Keir, D., Harmon, N., Stuart, G., Leroy, S., Hammond, J. O. S., et al. (2016). The initiation of segmented buoyancy-driven melting during continental breakup. Nature Communications, 7, 13,110. https://doi.org/10.1038/ncomms13110
Goitom, B., Oppenheimer, C., Hammond, J., Grandin, R., Barnie, T., & Donovan, A. (2015). First recorded eruption of Nabro volcano, Eritrea, 2011. Bulletin of Volcanology, 77(10), 85. https://doi.org/10.1007/s00445-015-0966-3
Hammond, J. O. S., Kendall, J. M., Stuart, G. W., Ebinger, C. J., Bastow, I. D., Keir, D., et al. (2013). Mantle upwelling and initiation of rift segmentation beneath the afar depression. Geology, 41(6), 635–638. https://doi.org/10.1130/G33925.1
Hammond, J. O. S., Kendall, J.-M., Stuart, G. W., Keir, D., Ebinger, C., Ayele, A., & Belachew, M. (2011). The nature of the crust beneath the Afar triple junction: Evidence from receiver functions. Geochemistry, Geophysics, Geosystems, 12, Q12004. https://doi.org/10.1029/ 2011GC003738
Hammond, J. O. S., Kendall, J.-M., Wookey, J., Stuart, G. W., Keir, D., & Ayele, A. (2014). Differentiatingflow, melt, or fossil seismic anisotropy beneath Ethiopia. Geochemistry, Geophysics, Geosystems, 15, 1878–1894. https://doi.org/10.1002/2013GC005185
Hammond, W. C., & Humphreys, E. D. (2000). Upper mantle seismic wave attenuation: Effects of realistic partial melt distribution. Journal of
Geophysical Research, 105(B5), 10987–10999. https://doi.org/10.1029/2000JB900042
Hansen, S. E., Rodgers, A. J., Schwartz, S. Y., & Al-Amri, A. M. S. (2007). Imaging ruptured lithosphere beneath the Red Sea and Arabian peninsula. Earth and Planetary Science Letters, 259(3–4), 256–265. https://doi.org/10.1016/j.epsl.2007.04.035
Helffrich, G. (2006). Extended-time multitaper frequency domain cross-correlation receiver-function estimation. Bulletin of the Seismological
Society of America, 96(1), 344–347. https://doi.org/10.1785/0120050098
Hirth, G., & Kohlstedt, D. L. (1996). Water in the oceanic upper mantle: Implications for rheology, melt extraction and the evolution of the lithosphere. Earth and Planetary Science Letters, 144(1–2), 93–108. https://doi.org/10.1016/0012-821X(96)00154-9
Holtzman, B. K., & Kendall, J.-M. (2010). Organized melt, seismic anisotropy, and plate boundary lubrication. Geochemistry, Geophysics,
Geosystems, 11, Q0AB06. https://doi.org/10.1029/2010GC003296
Hopper, E., Ford, H. A., Fischer, K. M., Lekic, V., & Fouch, M. J. (2014). The lithosphere-asthenosphere boundary and the tectonic and magmatic history of the northwestern United States. Earth and Planetary Science Letters, 402(C), 69–81. https://doi.org/10.1016/j.epsl.2013.12.016 Huismans, R., & Beaumont, C. (2011). Depth-dependent extension, two-stage breakup and cratonic underplating at rifted margins. Nature,
473(7345), 74–78. https://doi.org/10.1038/nature09988
Huismans, R. S., & Beaumont, C. (2007). Roles of lithospheric strain softening and heterogeneity in determining the geometry of rifts and continental margins. Geological Society, London, Special Publications, 282(1), 111–138. https://doi.org/10.1144/SP282.6
Jackson, I., Faul, U. H., Gerald, J. D. F., & Morris, S. J. S. (2006). Contrasting viscoelastic behavior of melt-free and melt-bearing olivine: Implications for the nature of grain-boundary sliding. Materials Science and Engineering A, 442(1–2), 170–174. https://doi.org/10.1016/j. msea.2006.01.136
Karato, S. I., & Jung, H. (1998). Water, partial melting and the origin of the seismic low velocity and high attenuation zone in the upper mantle.
Earth and Planetary Science Letters, 157(3–4), 193–207. https://doi.org/10.1016/S0012-821X(98)00034-X
Kawakatsu, H., Kumar, P., Takei, Y., Shinohara, M., Kanazawa, T., Araki, E., & Suyehiro, K. (2009). Seismic evidence for sharp lithosphere-asthenosphere boundaries of oceanic plates. Science, 324(5926), 499–502. https://doi.org/10.1126/science.1169499
Keir, D., Stuart, G. W., Jackson, A., & Ayele, A. (2006). Local Earthquake Magnitude Scale and Seismicity Rate for the Ethiopian Rift. Bulletin of
the Seismological Society of America, 96(6), 2221–2230. https://doi.org/10.1785/0120060051
Keir, D., Bastow, I. D., Whaler, K. A., Daly, E., Cornwell, D. G., & Hautot, S. (2009). Lower crustal earthquakes near the Ethiopian rift induced by magmatic processes. Geochemistry, Geophysics, Geosystems, 10, Q0AB02. https://doi.org/10.1029/2009GC002382
Kendall, J.-M., Stuart, G. W., Ebinger, C. J., Bastow, I. D., & Keir, D. (2005). Magma-assisted rifting in Ethiopia. Nature, 433(7022), 146–148. https://doi.org/10.1038/nature03161
Korostelev, F., Basuyau, C., Leroy, S., Tiberi, C., Ahmed, A., Stuart, G. W., et al. (2014). Crustal and upper mantle structure beneath south-western margin of the Arabian peninsula from teleseismic tomography. Geochemistry, Geophysics, Geosystems, 2, 4692–4711. https://doi. org/10.1002/2014GC005316
Korostelev, F., Leroy, S., Keir, D., Ahmed, A., Boschi, L., Rolandone, F., et al. (2015). Upper mantle structure of the southern Arabian margin: Insights from teleseismic tomography. Geosphere, 11(5), 1262–1278. https://doi.org/10.1130/GES01159.1
Lekić, V., & Fischer, K. M. (2017). Interpreting spatially stacked Sp receiver functions. Geophysical Journal International, 210(2), 874–886. https://doi.org/10.1093/gji/ggx206
Lekić, V., French, S. W., & Fischer, K. M. (2011). Lithospheric Thinning Beneath Rifted Regions of Southern California. Science, 334(6057), 783–787. https://doi.org/10.1126/science.1208898
Lenoir, X., Garrido, C. J., Bodinier, J. L., Dautria, J. M., & Gervilla, F. (2001). The recrystallization front of the Ronda peridotite: Evidence for melting and thermal erosion of subcontinental lithospheric mantle beneath the Alboran basin. Journal of Petrology, 42(1), 141–158. https://doi.org/10.1093/petrology/42.1.141
Leroy, S., d’Acremont, E., Tiberi, C., Basuyau, C., Autin, J., Lucazeau, F., & Sloan, H. (2010). Recent off-axis volcanism in the eastern gulf of Aden: Implications for plume-ridge interaction. Earth and Planetary Science Letters, 293(1–2), 140–153. https://doi.org/10.1016/j.epsl.2010.02.036 Mackenzie, G. D., Thybo, H., & Maguire, P. K. H. (2005). Crustal velocity structure across the main Ethiopian rift: Results from two-dimensional
wide-angle seismic modelling. Geophysical Journal International, 162(3), 994–1006. https://doi.org/10.1111/j.1365-246X.2005.02710.x Maguire, P. K. H., Keller, G. R., Klemperer, S. L., Mackenzie, G. D., Keranen, K., Harder, S., et al. (2006). Crustal structure of the northern main
Ethiopian rift from the EAGLE controlled-source survey; a snapshot of incipient lithospheric break-up. Geological Society, London, Special
Publications, 259(1), 269–292. https://doi.org/10.1144/GSL.SP.2006.259.01.21
Makris, J., & Ginzburg, A. (1987). The afar depression: Transition between continental rifting and sea-floor spreading. Tectonophysics,
141(1–3), 199–214. https://doi.org/10.1016/0040-1951(87)90186-7
Mancinelli, N. J., Fischer, K. M., & Dalton, C. A. (2017). How sharp is the cratonic lithosphere-asthenosphere transition? Geophysical Research
Letters, 44, 10,189–10,197. https://doi.org/10.1002/2017GL074518
McKenzie, D. (1978). Some remarks on the development of sedimentary basins. Earth and Planetary Science Letters, 40(1), 25–32. https://doi. org/10.1016/0012-821X(78)90071-7
Monnereau, M., Rabinowicz, M., & Arquis, E. (1993). Mechanical erosion and reheating of the lithosphere: A numerical model for hotspot swells. Journal of Geophysical Research, 98(B1), 809–823. https://doi.org/10.1029/92JB01677
Priestley, K., & McKenzie, D. (2006). The thermal structure of the lithosphere from shear wave velocities. Earth and Planetary Science Letters,
244(1–2), 285–301. https://doi.org/10.1016/j.epsl.2006.01.008
Redfield, T. F., Wheeler, W. H., & Often, M. (2003). A kinematic model for the development of the afar depression and its paleogeographic implications. Earth and Planetary Science Letters, 216(3), 383–398. https://doi.org/10.1016/S0012-821X(03)00488-6
Reed, C. A., Liu, K. H., Chindandali, P. R. N., Massingue, B., Mdala, H., Mutamina, D., et al. (2016). Passive rifting of thick lithosphere in the southern East African Rift: Evidence from mantle transition zone discontinuity topography. Journal of Geophysical Research: Solid Earth,
121, 8068–8079. https://doi.org/10.1002/2016JB013131
Rooney, T. O., Furman, T., Yirgu, G., & Ayalew, D. (2005). Structure of the Ethiopian lithosphere: Xenolith evidence in the main Ethiopian rift.
Geochimica et Cosmochimica Acta, 69(15), 3889–3910. https://doi.org/10.1016/j.gca.2005.03.043
Rooney, T. O., Herzberg, C., & Bastow, I. D. (2012). Elevated mantle temperature beneath East Africa. Geology, 40(1), 27–30. https://doi.org/ 10.1130/G32382.1
Rychert, C. A., Fischer, K. M., & Rondenay, S. (2005). A sharp lithosphere–asthenosphere boundary imaged beneath eastern North America.
Nature, 436(7050), 542–545. https://doi.org/10.1038/nature03904
Rychert, C. A., Hammond, J. O. S., Harmon, N., Michael Kendall, J., Keir, D., Ebinger, C., et al. (2012). Volcanism in the afar rift sustained by decompression melting with minimal plume influence. Nature Geoscience, 5(6), 406–409. https://doi.org/10.1038/ngeo1455
Rychert, C. A., Harmon, N., & Armitage, J. J. (2018). Seismic imaging of thickened lithosphere resulting from plume pulsing beneath Iceland.
Geochemistry, Geophysics, Geosystems, 19, 1789–1799. https://doi.org/10.1029/2018GC007501
Rychert, C. A., Harmon, N., & Ebinger, C. (2014). Receiver function imaging of lithospheric structure and the onset of melting beneath the Galápagos archipelago. Earth and Planetary Science Letters, 388, 156–165. https://doi.org/10.1016/j.epsl.2013.11.027
Rychert, C. A., Laske, G., Harmon, N., & Shearer, P. M. (2013). Seismic imaging of melt in a displaced Hawaiian plume. Nature Geoscience, 6(8), 657–660. https://doi.org/10.1038/ngeo1878
Rychert, C. A., Rondenay, S., & Fischer, K. M. (2007). P-to-S and S-to-P imaging of a sharp lithosphere-asthenosphere boundary beneath eastern North America. Journal of Geophysical Research, 112, B08314. https://doi.org/10.1029/2006JB004619
Rychert, C. A., & Shearer, P. M. (2009). A global view of the lithosphere-asthenosphere boundary. Science, 324(5926), 495–498. https://doi.org/ 10.1126/science.1169754
Rychert, C. A., Shearer, P. M., & Fischer, K. M. (2010). Scattered wave imaging of the lithosphere–asthenosphere boundary. Lithos, 120(1–2), 173–185. https://doi.org/10.1016/j.lithos.2009.12.006
Saunders, A. D., Storey, M., Kent, R. W., & Norry, M. J. (1992). Consequences of plume-lithosphere interactions. Geological Society, London,
Special Publications, 68(1), 41–60. https://doi.org/10.1144/GSL.SP.1992.068.01.04
Schmeling, H. (2010). Dynamic models of continental rifting with melt generation. Tectonophysics, 480(1–4), 33–47. https://doi.org/10.1016/j. tecto.2009.09.005
Schmerr, N. (2012). The Gutenberg discontinuity: Melt at the lithosphere-asthenosphere boundary. Science, 335(6075), 1480–1483. https:// doi.org/10.1126/science.1215433
Shearer, P. M., & Orcutt, J. A. (1987). Surface and near-surface effects on seismic waves—Theory and borehole seismometer results. Bulletin of
the Seismological Society of America, 77(4), 1168–1196.
Shillington, D. J., Scott, C. L., Minshull, T. A., Edwards, R. A., Brown, P. J., & White, N. (2009). Abrupt transition from starved to magma-rich rifting in the eastern Black Sea. Geology, 37(1), 7–10. https://doi.org/10.1130/G25302A.1
Sicilia, D., Montagner, J. P., Cara, M., Stutzmann, E., Debayle, E., Lépine, J. C., et al. (2008). Upper mantle structure of shear-waves velocities and stratification of anisotropy in the Afar Hotspot region. Tectonophysics, 462(1–2), 164–177. https://doi.org/10.1016/j.tecto.2008.02.016 Sleep, N. H. (2005). Evolution of the continental lithosphere. Annual Review of Earth and Planetary Sciences, 33(1), 369–393. https://doi.org/
10.1146/annurev.earth.33.092203.122643
Stab, M., Bellahsen, N., Pik, R., Quidelleur, X., Ayalew, D., & Leroy, S. (2016). Modes of rifting in magma-rich settings: Tectono-magmatic evolution of central afar. Tectonics, 35, 2–38. https://doi.org/10.1002/2015TC003893
10.1029/2018GC007463
Stuart, G. W., Bastow, I. D., & Ebinger, C. J. (2006). Crustal structure of the northern Main Ethiopian Rift from receiver function studies.
Geological Society, London, Special Publications, 253–267.
Tharimena, S., Rychert, C., & Harmon, N. (2017). A unified continental thickness from seismology and diamonds suggests a melt-defined plate. Science, 357(6351), 580–583. https://doi.org/10.1126/science.aan0741
Thybo, H., & Artemieva, I. M. (2013). Tectonophysics Moho and magmatic underplating in continental lithosphere. Tectonophysics, 609, 605–619. https://doi.org/10.1016/j.tecto.2013.05.032
Thybo, H., & Nielsen, C. A. (2009). Magma-compensated crustal thinning in continental rift zones. Nature, 457(7231), 873–876. https://doi.org/ 10.1038/nature07688
Tiberi, C., Ebinger, C., Ballu, V., Stuart, G., & Oluma, B. (2005). Inverse models of gravity data from the Red Sea-Aden-east African rifts triple junction zone. Geophysical Journal International, 163(2), 775–787. https://doi.org/10.1111/j.1365-246X.2005.02736.x
Watchorn, F., Nichols, G. J., & Bosence, D. W. J. (1998). Rift-related sedimentation and stratigraphy, southern Yemen (gulf of Aden). In B. H. Purser, & D. W. J. Bosence (Eds.), Sedimentation and Tectonics in Rift Basins Red Sea: Gulf of Aden (pp. 165–189). Dordrecht, Netherlands: Springer. https://doi.org/10.1007/978-94-011-4930-3_11
Whaler, K. A., & Hautot, S. (2006). The electrical resistivity structure of the crust beneath the northern Main Ethiopian Rift. Geological Society of
London, Special Publications, 259, 293–305.
White, R., & McKenzie, D. (1989). Magmatism at rift zones: The generation of volcanic continental margins andflood basalts. Journal of
Geophysical Research, 94(B6), 7685. https://doi.org/10.1029/JB094iB06p07685
Wolfenden, E., Ebinger, C., Yirgu, G., Deino, A., & Ayalew, D. (2004). Evolution of the northern main Ethiopian rift: Birth of a triple junction.
Earth and Planetary Science Letters, 224(1–2), 213–228. https://doi.org/10.1016/j.epsl.2004.04.022
Yamauchi, H., & Takei, Y. (2016). Polycrystal anelasticity at near-solidus temperatures. Journal of Geophysical Research: Solid Earth, 121, 7790–7820. https://doi.org/10.1002/2016JB013316
Ziegler, P. A., & Cloetingh, S. (2004). Dynamic processes controlling evolution of rifted basins. Earth-Science Reviews, 64(1–2), 1–50. https://doi. org/10.1016/S0012-8252(03)00041-2