HAL Id: hal-00317167
https://hal.archives-ouvertes.fr/hal-00317167
Submitted on 1 Jan 2002
HAL is a multi-disciplinary open access
archive for the deposit and dissemination of
sci-entific research documents, whether they are
pub-lished or not. The documents may come from
teaching and research institutions in France or
abroad, or from public or private research centers.
L’archive ouverte pluridisciplinaire HAL, est
destinée au dépôt et à la diffusion de documents
scientifiques de niveau recherche, publiés ou non,
émanant des établissements d’enseignement et de
recherche français ou étrangers, des laboratoires
publics ou privés.
Evolution of geomagnetic aa index near sunspot
minimum
R. P. Kane
To cite this version:
R. P. Kane. Evolution of geomagnetic aa index near sunspot minimum. Annales Geophysicae,
Euro-pean Geosciences Union, 2002, 20 (10), pp.1519-1527. �hal-00317167�
Annales Geophysicae (2002) 20: 1519–1527 c European Geosciences Union 2002
Annales
Geophysicae
Evolution of geomagnetic aa index near sunspot minimum
R. P. Kane
Instituto Nacional de Pesquisas Espacias, C. P. 515, S˜ao Jose dos Campos, 12201-970, SP, Brazil Received: 11 September 2001 – Revised: 5 February 2002 – Accepted: 12 February 2002
Abstract. The smoothed values of the minima of sunspot number Rz and the geomagnetic index aa were compared for sunspot cycles 12–23. In one cycle, aa(min) occurred earlier than Rz(min), but remained at that low from a few months before Rz(min) to a few months after Rz(min). In two cycles, Rz(min) and aa(min) coincided within a month or two. In nine cycles, aa(min) occurred more than three months later than Rz(min). The aa(min) coincided with the minima of some solar radio emission indices originating in the solar corona. For sunspot cycles 21, 22, 23, the minimum of solar wind velocity V occurred 0–9 months later than the
aa(min). The minimum of solar wind total magnetic field B occurred near Rz(min). The solar wind ion density N had maxima (instead of minima) near Rz(min), and again near
Rz(max), indicating a ∼5-year periodicity, instead of an 11-year periodicity. The maxima of aa, V and B occurred near
Rz(max) and/or later in the declining phase of Rz. The aa index was very well correlated with the functions BV and
BV2.
Key words. Geomagnetism and paleomagnetism (time vari-ations, diurnal to secular – time varivari-ations, secular and long term) Interplanetary physics (interplanetary magnetic field)
1 Introduction
The geomagnetic index aa has proved very useful for pre-diction of maxima of smoothed sunspot numbers. For ex-ample, using the precursor methods (Ohl, 1966; Brown and Williams, 1969), where the precursor is the geomagnetic ac-tivity in the declining phase of the previous cycle, reasonably good predictions could be made for solar cycles 20 (1964– 1975), 21 (1976–1985), and 22 (1986–1995) (Ohl, 1966, 1976; Ohl and Ohl, 1979; Sargent, 1978; Kane, 1978, 1987; Wilson, 1988, 1990). A review of the observed and predicted values of the maximum sunspot number for cycle 22 was made by Kane (1992). For solar cycle 23, many predictions were made. The cycle 23 started in 1996 and seems to have already peaked in 2000, with a maximum smoothed sunspot number of ∼122.
Correspondence to: R. P. Kane ([email protected])
In the precursor method, the smoothed value aa(min) is used in a regression equation. This value occurs generally near the smoothed sunspot Rz(min). However, the exact month when aa(min) occurs is not important. The corre-lation between the smoothed values (12-month moving aver-ages) of aa(min) and the succeeding smoothed sunspot num-ber Rz(max) is very high (∼ +0.95), no matter when the
aa(min) occurred. However, it is noticed that the months of
aa(min) and Rz(min) do not always coincide. In the present communication, it has been investigated whether the month of aa(min) coincides with the month of minimum of any other solar index, if not with Rz(min).
2 Data
All the data were obtained from the NOAA websites ftp://ftp. ngdc.noaa.gov/STP/SOLAR\ DATA/ and http://www.ngdc. noaa.gov/stp/, but some were obtained from other websites given by the various authors. The sunspot numbers used are the Wolf (Z¨urich) sunspot number Rz, available since 1700 and published by Wolf in the various issues of Astron. Mitt. (1858–1893) (also in Waldmeir, 1961; McKinnon, 1987), presently generated by the Solar Index Data Center, Brus-sels. The aa index data are originally from Mayaud (1973). Many data appear in the Solar Geophysical Data (SGD) Re-ports of NOAA. The data were available as monthly means, or daily values, from which monthly values were calculated. Furthermore, smoothed values (12-month moving averages) were calculated and used. Thus, short-term variations, such as a 27-day variation, are obliterated and only intermediate-term variations are studied.
3 Plots
3.1 Plots of Rz and aa indices in cycles 12–23
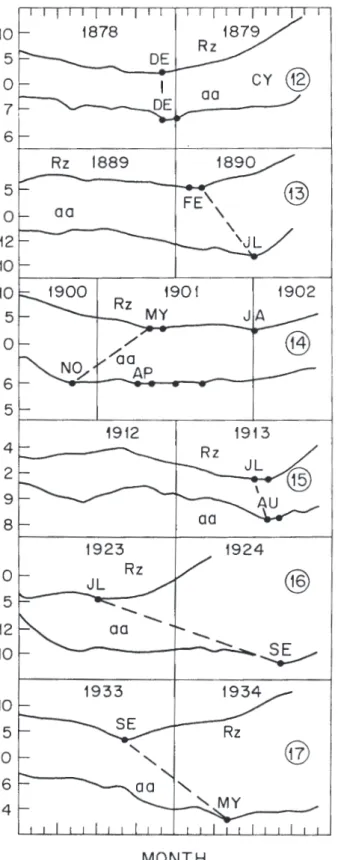
The aa index data are available from 1868 (cycle 12) on-ward (the cycles are numbered since 1750, cycle 1 = 1755 minimum to 1766 minimum). Figure 1a shows the plots of smoothed sunspot numbers Rz and smoothed aa for sunspot cycles 12–17 and Fig. 1b for cycles 18–23. The months of minima (JA, FE, MA, AP, MY, JN, JL, AU, SE, OC, NO,
1520 R. P. Kane: Evolution of geomagnetic aa index near sunspot minimum
Fig. 1. Plots of the 12-month moving averages of sunspot number Rz and geomagnetic index aa during years of minima of sunspot cycles, (a) cycles 12–17, (b) cycles 18–23. The dashed line connects Rz(min) to aa(min).
DE) are indicated and the minima of Rz and aa are con-nected by a dashed line. In cycle 14, aa(min) occurred in November 1900, several months before Rz(min), which
oc-curred in May 1901. However, the aa values were almost flat for several months, so that the aa(min) could be considered as during November 1900 – September 1901. In cycles 12
R. P. Kane: Evolution of geomagnetic aa index near sunspot minimum 1521
and 15, the minima of aa and Rz were almost coincident. In the other nine cycles, aa(min) occurred three or more months later than Rz(min). A very unusual thing occurred in cycle 21 when aa had two minima, one in November 1976 (five months after the Rz(min) of June 1976), and another several years later, in March 1980.
Regarding sunspot minimum for cycles 22–23, Harvey and White (1999) made an interesting investigation. They concluded that cycle minimum is not defined solely on the basis of the occurrence of the minimum in the smoothed sunspot number, but rather by several additional parame-ters, including the monthly (or rotationally) averaged sunspot number, the number of regions (total, new- and old-cycle), and the number of spotless days, and they recommended that minimum between cycles 22 and 23 should be considered as having occurred in September 1996 and not in May 1996. In Fig. 1b, we have considered the sunspot minimum to be in April 1996, as well as in September 1996. (The dicrep-ancy of whether or not sunspot minimum should be in April or May 1996 is appearing due to the consideration of cen-tering. We have considered 12-month moving averages as centered on the sixth month, e.g. January to December mean centered at June. Others may consider it as at July. The double-smoothed means, as given in McKinnon, 1987, will be centered at July). The smoothed sunspot numbers had a minimum value of 7.6 in April 1996, but then followed a flat minimum until September 1996, when the value was only 8.4, almost the same as for April 1996.
3.2 Plots of months of minima for several indices in cycles 18–23
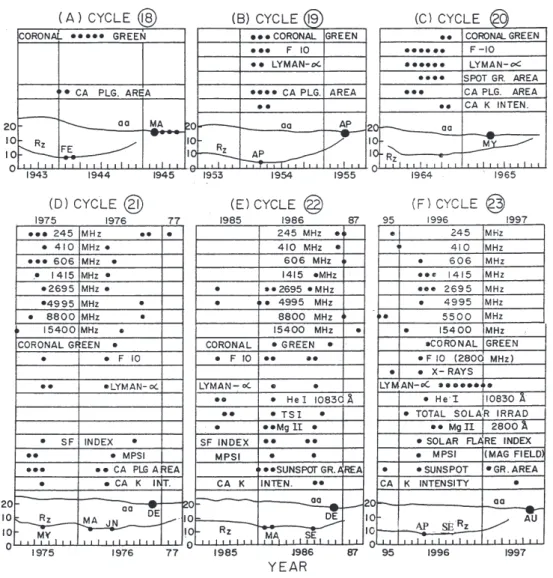
Among solar indices, sunspot number data are available for more than three centuries, but other indices are of recent ori-gin. The Calcium plage areas are available since 1915 (cycle 15), the coronal green line emission index since 1939 (cycle 17), and the 10.7 cm 2800 MHz flux (called F10) since 1947. Figure 2 shows the months when the minima of the smoothed values of various indices occurred during cycles (A) 18, (B) 19, (C) 20, (D) 21, (E) 22, (F) 23. In each frame, the bottom plot is of smoothed Rz values and the next plot above it is of smoothed aa values. The minima are indicated by full dots. If values adjacent to the minima are within 5%, these are also shown by dots. Only the months of minima of the smoothed values are indicated by dots. The month of aa(min) is shown by a bigger dot, for easy comparison with months of minima of other indices.
– Cycle 18: The months of minima of Rz, Calcium plage area and Coronal green line emission index were all in the first half of 1944, but the aa(min) was much later, in March 1945. Thus, aa(min) did not match with any of the other three solar indices (including Rz), and oc-curred much later.
– Cycle 19: Minima of six solar indices occurred in the first half of 1954, but aa(min) occurred almost a year later, in April 1955.
– Cycle 20: Minima of seven solar indices occurred in the latter half of 1964, but aa(min) occurred a few months later, in April 1965.
– Cycle 21: Here, Rz had a minor minimum in May 1975 and many solar indices (more than a dozen) had min-ima in nearby months. Major minmin-ima of Rz were in March–June 1976 and minima of many solar indices curred in this interval as well. In contrast, aa(min) oc-curred much later, in December 1976. The solar indices with minima nearest to this month were the coronal 245, 4995 and 8800 MHz solar radio emissions, and the solar flare index. Thus, some relationship with solar corona was indicated. Incidentally, the aa index had another minimum several years later, in March 1980 (discussed further).
– Cycle 22: Here, Rz had minima in February–March and September 1986 and many solar indices had sim-ilar minima. The aa(min) occurred later in December 1986, when some coronal indices had minima, again in-dicating a coronal connection.
– Cycle 23: This cycle is not yet complete (only halfway through). The Rz had a minimum (7.6) in April 1996, but the values remained low until September 1996 (8.4). Many other solar indices had minima near April 1996. The aa(min) occurred much later, in August 1997, and no other solar index had a minimum anywhere near it, except Calcium K line intensity (June 1997). Thus, there was no coronal connection in this cycle.
Thus, the aa(min) was always later than Rz(min) in cy-cles 18–23, and a few solar radio emissions accompanied the
aa(min).
4 Relationship with solar wind parameters
Geomagnetic indices are basically related to the Earth, though a possible relationship with solar phenomena was suspected long ago. Chapman and Bartels (1940) observed that geomagnetic activity often increased several hours after some solar events and speculated that solar corpuscular emis-sions from M regions were responsible for these increases. Chapman firmly believed that the solar atmosphere was ba-sically static, like the Earth’s atmosphere, only much more extensive, with the upper corona sometimes extending right up to the Earth. Parker (1958, 1963) noticed that the so-lar atmosphere was not only not static, but was highly dy-namic and the Sun was emitting corpuscular radiation (so-lar wind) all the time, much more so during so(so-lar events. The solar wind occupied the interplanetary space and Inter-planetary Magnetic Fields (IMF) were formed. A southward component (Bz) of IMF was particularly effective in caus-ing a reconnection with the geomagnetic field through the magnetotail, resulting in increased geomagnetic activity. The present view is that around solar maximum, the dominant in-terplanetary phenomena causing intense magnetic storms are
1522 R. P. Kane: Evolution of geomagnetic aa index near sunspot minimum
Fig. 2. Plots of the 12-month moving averages of Rz and aa during years of sunspot minima of (A) cycle 18, 1943–1945, (B) cycle 19, 1953–1955, (C) cycle 20, 1964–1965, (D) cycle 21, 1975–1977, (E) cycle 22, 1985–1987, (F) cycle 23, 1995–1997. For other solar indices, only the months of minima are indicated by full dots. The aa(min) is indicated by a bigger full dot.
the interplanetary manifestations of fast coronal mass ejec-tions (CMEs; Gonzalez et al., 1999). The parameters of solar wind for which data are available are (i) solar wind velocity
V, (ii) ion density N , and (iii) magnetic field B (components
Bx, By, Bz). The data set is a composite of multispacecraft observations obtained over different time periods, beginning with 27 November 1963 (details in King, 1976), but the cov-erage is very uneven in the early years. Here, only data for cycles 21–23 (1975 onward) are used. Daily values are of-ten intermitof-tent, but monthly values may be reliable. Moving averages over 12 months should be fairly reliable, though the effects of individual events lasting for a few days are obliter-ated and only intermediate-time scale effects would be seen.
4.1 Plots for cycles 21, 22, 23
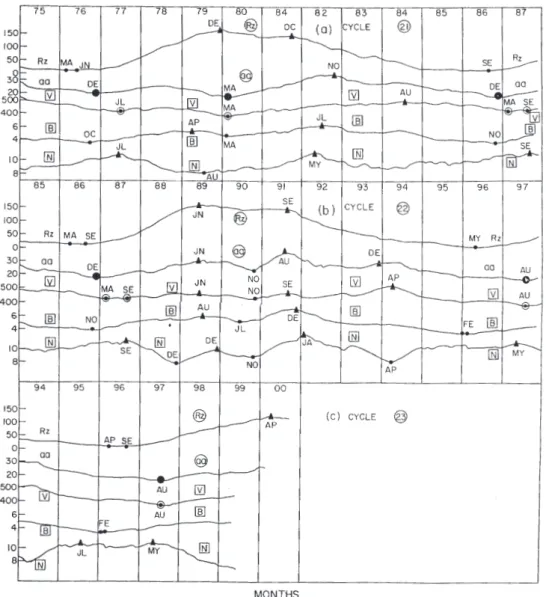
Figure 3 shows a plot of smoothed monthly values of Rz, aa index, and solar wind parameters V , B, N , for (a) cycle 21, (b) cycle 22, and (c) cycle 23. For each cycle, data for
thir-teen years are plotted so that two minima and one maximum of Rz are seen in the same plot. The phase relationship of
Rz(min), aa(min), etc. was as follows:
– Cycle 21: The Rz(min) occurred in March–June of 1976, while aa(min) occurred a few months later, in December 1976 (big dot), almost coinciding with the October 1976 minima of some solar radio emissions (Fig. 2D). The total magnetic field B of solar wind had a minimum in October 1976, almost coinciding with
aa(min), but the solar wind velocity V had a minimum much later, in July 1977 (big open circle). Thus, even though solar wind velocity V and aa index are reported to be highly correlated, their first minima did not oc-cur simultaneously in the beginning of cycle 21. There was another minimum much later in March 1980, coin-cident for V (min), aa(min) and B(min), though the Rz had attained a maximum at this time. A curious feature was that the ion density N did not have a minimum in
R. P. Kane: Evolution of geomagnetic aa index near sunspot minimum 1523
Fig. 3. Plots of the 12-month moving averages of Rz, aa, and solar wind parameters V , B, N , for (a) cycle 21 (1975–1987), (b) cycle 22 (1985–1997), (c) cycle 23 (1994–2000). The minima are indicated by full dots (big full dot for aa(min), open circle for V (min)) and maxima by full triangles.
1976–1977 at all. Instead, there was a maximum (tri-angle) in July 1977, though later, there was a minimum in August 1979. The maxima of aa, V , B and N for this cycle 21 occurred much later than the maximum of
Rz(rather a flat maximum during December 1979 to October 1981), confirming that solar wind and geomag-netic activity strengthen during the declining phase of the sunspot cycle. However, the maxima of aa and V did not coincide and were several months apart, with
V(max) occurring later.
– Cycle 22: Here, Rz(min) was in March–September 1986, aa(min) a few months later, in December 1986, and V (min) still later, in March–September, 1987. The
B(min) was in November 1986, almost coinciding with
aa(min). The ion density N did not have a minimum and instead, showed a maximum in September 1987,
followed by a minimum in December 1988. Rz had a flat maximum during June 1989 and September 1991. Let us term these as two maxima, one in June 1989 and another in September 1991, though there is no valley in between. The maxima of aa, V , B and N all oc-curred almost simultaneously, but there were two max-ima in each, one coinciding with the first maximum of
Rz(June 1989) and another with the second maximum of Rz (September 1991). However, aa and V had a third maximum in the end of 1993, in the declining phase of
Rz.
– Cycle 23: Rz(min) was during April–September, 1996, while aa(min) was much later, in August 1997, and
V(min) coincided with aa(min). The B(min) was much earlier, in February 1996, earlier than even Rz(min). Again, ion density N did not have a minimum at all;
1524 R. P. Kane: Evolution of geomagnetic aa index near sunspot minimum
instead, two maxima were seen, one in July 1996 and another in May 1997. The Rz(max) occurred in April 2000 and there are no data available as of yet for the other indices.
Data for only three sunspot cycles are certainly not enough for drawing any statistical conclusions, but the following is noteworthy:
1. In cycles 21 and 22, Rz had a flat plateau at the maxi-mum. Let us term the beginning of this plateau as the first maximum and the end of the plateau as the sec-ond maximum, though there is virtually no valley in be-tween. In cycle 23, the Rz(max) occurred only recently and further evolution is unknown.
2. The aa(min) occurred later than Rz(min) in all the three cycles, by 3–15 months. The aa had more than one maxima, one occurring coincident with Rz(max) and others later, in the declining phase of Rz.
3. The V (min) occurred 0–9 months later than aa(min), indicating that the geomagnetic activity lowered first. The V (max) occurred coincident with aa(max), or later. 4. The B(min) occurred earlier than aa(min) and in cycle 23, earlier than even Rz(min), indicating that the mag-netic field in solar wind weakened earliest. The B(max) occurred within a few months of aa(max).
5. N had a very strange behavior. N (max) occurred soon after Rz(min) as well as soon after Rz(max). Thus, a 5-year (rather than an 11-year) cycle is indicated.
4.2 Correlations
Soon after data for solar wind parameters were available, Snyder et al. (1963) reported a good correlation between so-lar wind velocity V and the geomagnetic index Ap. For indi-vidual magnetic storms lasting for a few to tens of hours, magnetic field reconnection between the southwardly di-rected IMF and the geomagnetic field is the most widely ac-cepted mechanism for magnetospheric energization. Several coupling functions that correlate well between solar wind pa-rameters and magnetospheric dissipation papa-rameters are used and these can be derived as particular cases of general ex-pressions for the momentum and energy transfer at the mag-netopause due to large-scale reconnection (Gonzalez, 1990; Gonzalez et al., 1994). Possible interplanetary mechanisms for the creation of very intense magnetic storms are dis-cussed in detail by Gonzalez et al. (1999). However, for long-term averages of solar wind, the effects of individual storms are obliterated and only steady-state characteristics prevail. Crooker et al. (1993) reported a high correlation between so-lar wind speed and geomagnetic activity, but earlier, Crooker and Gringauz (1977) had reported a low correlation for data after 1976. For cycles 20, 21, 22 (1964–1995), Kane (1997) reported that the correlation between solar wind velocity and
aaindex was +0.91±0.02 for cycle 20, +0.77±0.04 for cy-cle 21, and +0.73 ± 0.04 for cycy-cle 22, indicating that factors
other than the wind velocity were involved. For the same pe-riod, Ahluwalia (2000) used annual mean values of Ap and IMF, and reported a long-term trend in the B data for 1963– 1998. He found good correlations between the variations of
Apand BV or BV2. In Fig. 3, the variations in the values of
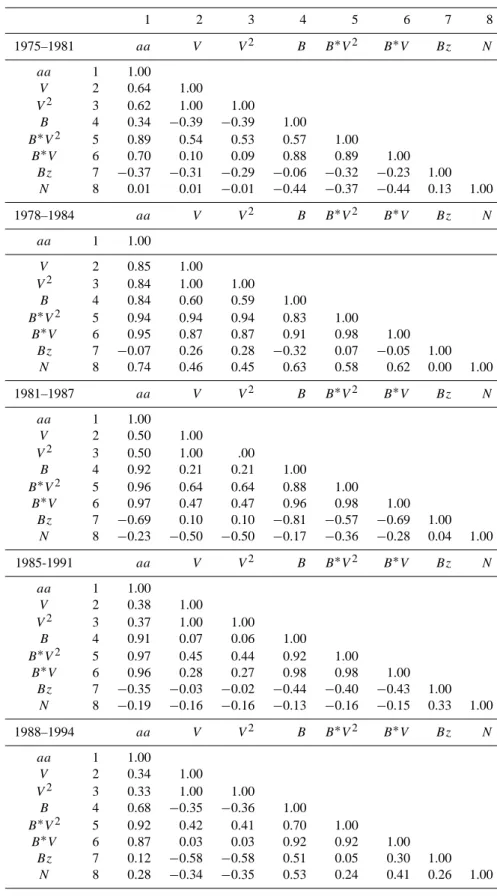
V and aa do not seem to match all the time. Hence, a cor-relation analysis was done for successive intervals of seven years (84 smoothed monthly values) at a time, with overlaps of a few years. The correlations were as given in Table 1.
In Table 1, the following may be noted:
1. The correlations of aa with solar wind velocity V in the seven successive intervals were (all positive): 0.64, 0.85, 0.50, 0.38, 0.34, 0.78, 0.98, indicating that this simple relationship was highly variable.
2. The correlations between aa and BV , and aa and (BV2) for the seven intervals were (all positive): 0.70 (0.89), 0.95 (0.94), 0.97 (0.96), 0.96 (0.97), 0.87 (0.92), 0.96 (0.98), 0.82 (0.93). Thus, a very large variance is explained by the parameters BV as well as BV2, as observed by Ahluwalia (2000). The parameter VB represents the induced electric field E = BV in the dawn to dusk direction, through which the solar wind-magnetosphere coupling occurs (Dungey, 1961). The dimensions of BV correspond to force per unit charge, while those of BV2correspond to power per unit charge (transferred from the solar wind to the magnetosphere).
3. The correlations between aa and B were (all positive): 0.34, 0.84, 0.92, 0.91, 0.68, 0.85, 0.41. However, these were lower than the correlations with BV or BV2, indi-cating that just V or just B was not enough. Both were needed for a better relationship with the aa index.
4. The correlations of aa with the southward IMF com-ponent Bz were: −0.37, −0.07, −0.69, −0.35, +0.12,
+0.67, +0.10. Thus, the relationship is highly variable, even in sign. This is probably because even though Bz has a very high significance for individual storms (large negative Bz associated with high Kp), the long-term average over monthly and yearly values is of dubious significance. If the sign is ignored, the scaler magnitude
|Bz |was reported to be varying in concert with B for cycles 20 and 21 (Hapgood et al., 1991).
5. The correlations of aa with ion density N were: +0.01,
+0.74, −0.23, −0.19, +0.28, −0.03, −0.54, indicating a poor, uncertain relationship. This is probably because
N shows a 5-year cycle, not shown by aa or any other index. The correlation of aa with BV or BV2is high (exceeding +0.90), except in the first interval (1975– 1981), when it was slightly lower (BV , +0.70). How-ever, the correlation of aa with N was negligibly small (+0.01) in this interval. Hence, inclusion of N as a pa-rameter in a multiple regression does not increase the variance explained.
R. P. Kane: Evolution of geomagnetic aa index near sunspot minimum 1525
Table 1. Correlations between the aa index and various solar wind parameters
1 2 3 4 5 6 7 8 1975–1981 aa V V2 B B∗V2 B∗V Bz N aa 1 1.00 V 2 0.64 1.00 V2 3 0.62 1.00 1.00 B 4 0.34 −0.39 −0.39 1.00 B∗V2 5 0.89 0.54 0.53 0.57 1.00 B∗V 6 0.70 0.10 0.09 0.88 0.89 1.00 Bz 7 −0.37 −0.31 −0.29 −0.06 −0.32 −0.23 1.00 N 8 0.01 0.01 −0.01 −0.44 −0.37 −0.44 0.13 1.00 1978–1984 aa V V2 B B∗V2 B∗V Bz N aa 1 1.00 V 2 0.85 1.00 V2 3 0.84 1.00 1.00 B 4 0.84 0.60 0.59 1.00 B∗V2 5 0.94 0.94 0.94 0.83 1.00 B∗V 6 0.95 0.87 0.87 0.91 0.98 1.00 Bz 7 −0.07 0.26 0.28 −0.32 0.07 −0.05 1.00 N 8 0.74 0.46 0.45 0.63 0.58 0.62 0.00 1.00 1981–1987 aa V V2 B B∗V2 B∗V Bz N aa 1 1.00 V 2 0.50 1.00 V2 3 0.50 1.00 .00 B 4 0.92 0.21 0.21 1.00 B∗V2 5 0.96 0.64 0.64 0.88 1.00 B∗V 6 0.97 0.47 0.47 0.96 0.98 1.00 Bz 7 −0.69 0.10 0.10 −0.81 −0.57 −0.69 1.00 N 8 −0.23 −0.50 −0.50 −0.17 −0.36 −0.28 0.04 1.00 1985-1991 aa V V2 B B∗V2 B∗V Bz N aa 1 1.00 V 2 0.38 1.00 V2 3 0.37 1.00 1.00 B 4 0.91 0.07 0.06 1.00 B∗V2 5 0.97 0.45 0.44 0.92 1.00 B∗V 6 0.96 0.28 0.27 0.98 0.98 1.00 Bz 7 −0.35 −0.03 −0.02 −0.44 −0.40 −0.43 1.00 N 8 −0.19 −0.16 −0.16 −0.13 −0.16 −0.15 0.33 1.00 1988–1994 aa V V2 B B∗V2 B∗V Bz N aa 1 1.00 V 2 0.34 1.00 V2 3 0.33 1.00 1.00 B 4 0.68 −0.35 −0.36 1.00 B∗V2 5 0.92 0.42 0.41 0.70 1.00 B∗V 6 0.87 0.03 0.03 0.92 0.92 1.00 Bz 7 0.12 −0.58 −0.58 0.51 0.05 0.30 1.00 N 8 0.28 −0.34 −0.35 0.53 0.24 0.41 0.26 1.00
1526 R. P. Kane: Evolution of geomagnetic aa index near sunspot minimum Table 1. (continued) 1991–1997 aa V V2 B B∗V2 B∗V Bz N aa 1 1.00 V 2 0.78 1.00 V2 3 0.77 1.00 1.00 B 4 0.85 0.41 0.40 1.00 B∗V2 5 0.98 0.79 0.78 0.88 1.00 B∗V 6 0.96 0.65 0.64 0.96 0.98 1.00 Bz 7 0.67 0.34 0.32 0.81 0.71 0.77 1.00 N 8 −0.03 −0.54 −0.57 0.31 −0.08 0.09 0.18 1.00 1994–1999 aa V V2 B B∗V2 B∗V Bz N aa 1 1.00 V 2 0.98 1.00 V2 3 0.97 1.00 1.00 B 4 0.41 0.31 0.32 1.00 B∗V2 5 0.93 0.91 0.91 0.68 1.00 B∗V 6 0.82 0.77 0.78 0.85 0.97 1.00 Bz 7 0.10 0.10 0.11 0.59 0.34 0.45 1.00 N 8 −0.54 −0.50 −0.50 −0.76 −0.72 −0.80 −0.55 1.00
6. Some large correlations in Table 1 are due to obvious interdependences (V with BV , etc.) and are of little consequence.
5 Conclusions
The results of the present analysis may be summarized as follows:
1. The smoothed values of the minima of sunspot num-ber Rz and the geomagnetic index aa were compared for sunspot cycles 12–23. In one cycle (cycle 14),
aa(min) occurred earlier than Rz(min), but the broad, flat aa(min) continued until after Rz(min). In two cy-cles (12, 15), Rz(min) and aa(min) coincided within a month or two. In nine cycles, aa(min) occurred more than three months later than Rz(min).
2. A comparison with the plots of other solar indices showed that the aa(min) coincided with the minima of some solar radio emission indices originating in the so-lar corona.
3. Since aa is reported to be correlated with solar wind, a comparison was made for sunspot cycles 21, 22, 23. Solar wind velocity V (min) occurred 0–9 months later than the aa(min). Solar wind total magnetic field
B(min) occurred near the Rz(min). The solar wind ion density N had maxima (instead of minima) near
Rz(min), and again near Rz(max), indicating a 5-year periodicity, instead of an 11-year periodicity.
4. The maxima of aa, V and B occurred near Rz(max) and/or later in the declining phase of Rz.
5. The aa index was very well correlated with the func-tions BV and BV2.
Acknowledgements. Thanks are due to H. Coffey and E. Erwin for
guiding through the NOAA website and indicating websites for other data. This work was partially supported by FNDCT, Brazil under contract FINEP-537/CT.
Topical Editor E. Antonucci thanks J. Joselyn and G. Godoli for their help in evaluating this paper.
References
Ahluwalia, H. S.: Ap time variations and interplanetary magnetic field intensity, J. Geophys. Res., 105, 27,481–27,487, 2000. Brown, G. M. and Williams, W. R.: Some properties of the
day-to-day variability of Sq(H), Planet. Space Sci., 17, 455–469, 1969. Chapman, S. and Bartels, J.: Geomagnetism, Oxford Univ. Press,
New York, 1940.
Crooker, N. U. and Gringauz, K. I.: On the low correlation between long term changes of solar wind speed and geomagnetic activity, J. Geophys. Res., 82, 1933–1937, 1977.
Crooker, N. U., Feynman, J., and Gosling, J. T.: On high correlation between long term changes of solar wind speed and geomagnetic activity, J. Geophys. Res., 98, 59–62, 1993.
Dungey, J. W.: IMF and the auroral zones, Phys. Rev. Lett., 6, 47– 48, 1961.
Gonzalez, W. D.: A unified view of solar wind-magnetosphere cou-pling functions, Planet. Space Sci., 38, 627–632, 1990.
Gonzalez, W. D., Joselyn, J. A., Kamide, Y., Kroehl, H. W., Ros-toker, G., Tsurutani, B. T., and Vasyliuas, V. M.: What is a geo-magnetic storm? J. Geophys. Res., 99, 5771–5792, 1994. Gonzalez, W. D., Gonzalez, A. L. C., and Tsurutani, B. T.:
Inter-lanetary origin of geomagnetic storms, Space Sci. Rev., 88, 529– 562, 1999.
Hapgood, M. A., Lockwood, M., Bowe, G. A., Willis, D. M., and Tulunay, Y. K.: Variability of the interplanetary medium at 1
R. P. Kane: Evolution of geomagnetic aa index near sunspot minimum 1527
a.u. over 24 years: 1963–1986, Planet. Space Sci., 39, 411–423, 1991.
Harvey, K. L. and White, O. R.: What is solar cycle minimum?, J. Geophys. Res., 104, 19759–19764, 1999.
Kane, R. P.: Predicted intensity of the solar maximum, Nature, 274, 139–140, 1978.
Kane, R. P.: Prediction of the maximum annual mean sunspot num-bers in the coming solar maximum epoch, Solar Phys. 108, 415– 416, 1987.
Kane, R. P.: Did predictions of the maximum sunspot number for the solar cycle No. 22 come true?, Solar. Phys. 140, 171–180, 1992.
Kane, R. P.: Quasi-biennial and quasi-triennial oscillations in ge-omagnetic activity indices, Ann. Geophysicae, 15, 1581–1594, 1997.
King, J. H.: A survey of long term interplanetary magnetic field variations, J. Geophys. Res., 81, 653–660, 1976.
Mayaud, P. N.: A hundred year series of geomagnetic data 1868– 1967, indices aa, storm sudden commencements, IAGA Bull. 33, 262, 1973.
McKinnon, J. A.: Sunspot numbers 1610–1985, UAG Report 95, 112, NOAA Boulder, Colorado, USA, 1987.
Ohl, A. I.: Forecast of sunspot maximum number of cycle 20, Sol-nice Danie 12, 84–85, 1966.
Ohl, A. I.: A preliminary forecast of some parameters of cycle No. 21 of the solar activity, Solnechnye Dannye 9, 73–75, 1976. Ohl, A. I. and Ohl, G. I.: A new method of very long-term
predic-tion of solar activity. In: Solar-Terrestrial Predicpredic-tions Proceed-ings, (Ed) Donnely, R. F., 258–263, NOAA/Space Environmen-tal Laboratories, Boulder, Colorado, 1979.
Parker, E. N.: Interaction of solar wind with the geomagnetic field, Phys. Fluids, 1, 171–187, 1958.
Parker, E. N.: Interplanetary Dynamical Processes, Interscience, New York, 1963.
Sargent, H. H. III.: A prediction for the next sunspot cycle, Proc. 28th IEEE Vehicular Technical Conf., Denver, 490–496, 1978. Snyder, C. W., Neugebauer, M., and Rao, U. R.: The solar wind
velocity and its correlation with cosmic ray variations and with solar and geomagnetic activity, J. Geophys. Res., 68, 6361–6370, 1963.
Waldmeier, M.: The sunspot activity in the years 1610–1960, Schulthess & Company AG, Z¨urich, 1961.
Wilson, R. M.: A prediction of the size of sunspot cycle 2, Geophys. Res. Lett. 15, 125–127, 1988.
Wilson, R. M.: On the level of skill in predicting maximum sunspot number: A comparative study of single variate and bivariate pre-cursor techniques, Solar Phys. 125, 143–158, 1990.