Designing an Interactive Local and Global Decision
Support System for Aircraft Carrier Deck Scheduling
The MIT Faculty has made this article openly available.
Please share
how this access benefits you. Your story matters.
Citation
Ryan, Jason, Mary Cummings, Nick Roy, Ashis Banerjee, and
Axel Schulte. “Designing an Interactive Local and Global Decision
Support System for Aircraft Carrier Deck Scheduling.” In
Infotech@Aerospace 2011. American Institute of Aeronautics and
Astronautics, 2011. http://dx.doi.org/10.2514/6.2011-1516.
As Published
http://dx.doi.org/10.2514/6.2011-1516
Publisher
American Institute of Aeronautics and Astronautics
Version
Author's final manuscript
Citable link
http://hdl.handle.net/1721.1/81169
Terms of Use
Creative Commons Attribution-Noncommercial-Share Alike 3.0
Designing an Interactive Local and Global Decision
Support System for Aircraft Carrier Deck Scheduling
Jason C. Ryana, M. L. Cummingsb, Nick Royc, Ashis Banerjeed
Massachusetts Institute of Technology, Cambridge, MA, 02139 and
Axel Schultee
Universität der Bundeswehr München, Munich, GERMANY
In the near future, unmanned aerial vehicles will become part of the naval aircraft carrier operating environment. This will add significant complexity to an already highly constrained and dangerous environment. The move towards a shared manned-unmanned environment with an increasing operational tempo in a reduced manning environment will mean more automation is needed in the planning and scheduling of aircraft, ground vehicles, and crew in these complex environments. However, while automated planning algorithms are fast and able to handle large quantities of information in a short period of time, they are often brittle, unable to cope with changing conditions in highly dynamic environments. Recent research has shown that by allowing high-level interaction between human operators and automated planners, significant increases in overall mission performance can achieved. To this end, a user interface has been developed that allows a human decision maker managing aircraft carrier deck operations the ability to interact directly with a centralized planning algorithm for scheduling aircraft in flight and on the deck (both manned and unmanned), as well as ground vehicles and personnel. This Deck operations Course of Action Planner (DCAP) system leverages the experience and high-level, goal-directed behavior of the human decision maker in conjunction with a powerful automated planning algorithm to develop feasible, robust schedules. This article highlights the design features of DCAP and presents preliminary results from an evaluation designed to quantify the value added by layering in planning and scheduling algorithms into this complex decision process.
I. Introduction
The inclusion UAVs into the aircraft carrier operating environment will further increase the already high level of complexity of operations. In the current operational paradigm, all planning tasks are handled by human operators with few, if any, decision support tools. Even though current methods are effective, due to the efficiency of human satisficing and recognition-primed decision-making 1, 2, the reliance on human operators ultimately limits the performance of re-planning operations. The limited human ability to process information, to understand probability and stochasticity, and to create detailed plans quickly are often inferior to the capabilities of automated systems 3.
However, human operators retain superiority in their ability to develop higher-level goals and apply personal judgment and prior experience. Automated algorithms also have a variety limitations, particularly in terms of brittleness and the inability to easily recognize patterns within the environment 4.
a Graduate Research Assistant, Dept. of Aeronautics and Astronautics, 77 Massachusetts Ave. Rm 35-220,
Cambridge, MA 02139, AIAA Student Member.
b Associate Professor, Dept. of Aeronautics and Astronautics, 77 Massachusetts Ave. Rm 33-311, Cambridge, MA
02139, AIAA Associate Fellow.
c Associate Professor, Dept. of Aeronautics and Astronautics, 77 Massachusetts Ave. Rm 33-315, Cambridge, MA,
AIAA Member.
d Post-doctoral Research, Computer Science and Artificial Intelligence Laboratory, 32 Vassar St. Rm 33-332. e Full Professor, Dept. of Aerospace Engineering, Werner-Heisenberg-Weg 39, 85577 Neubiberg.
Recent research 5 has shown that by allowing high-level interaction between human operators and automated planning systems, overall increases in system performance can be seen. The key in this phenomenon is the appropriate allocation of tasks between human and automation. Human operators are given high-level planning tasks and the ability to set goals, while the automation handles the creation of the detailed planning assignments. However, offloading tasks to the automation creates new dangers to the system. Operator loss of situational awareness (SA) and automation opacity are two significant issues that must be mitigated during the system design process 6-8. As such, the system must support operator awareness while simultaneously providing adequate insight into automated processes.
To this end, we have created a decision support system for aircraft carrier re-planning. The Deck operations Course of Action Planner (DCAP) is designed as a collaborative system, utilizing both a human operator and an automated planning algorithm in the creation of new operating schedules. In order to facilitate operator situational awareness and communication between operator and automation, a visual display interface has been created. To address loss of situational awareness, the system includes several tools to support the operator’s understanding of the current and future state of the schedule. To address automation opacity, these same tools attempt to detail the schedule proposed by the automated system. The system has also been designed to support a range of operator decision heuristics, providing the operator with several viewpoints of system performance. This article highlights the design of this system, identifying the features designed to improve operator situational awareness and elements that allow operators to communicate with the planning algorithm in a meaningful manner. Although an in-depth usability-testing program with subject matter experts has not been possible thus far, numerous assessments with Naval personnel have occurred. Additionally, a testing and validation program for the automated planner is in progress, and preliminary results from this study are presented.
II. The Deck operations Course of Action Planner (DCAP)
The Deck operations Course of Action Planner (DCAP) is comprised of a display interface and an embedded automated planning algorithm integrated with a simulation of aircraft carrier deck operations. The system has been designed as a collaborative planning system in which the human operator specifies high-level goals for the automated planning algorithm, which then performs the task of creating the new schedule. Before implementing the new schedule, the human operator must first provide approval for the schedule. In order to fulfill this functionality, the display interface must serve three functions. First, the interface must provide sufficient information to the operator to support the decision to re-plan. Second, the interface must facilitate the exchange of inputs from the operator to the automation. Third, the interface must support the proposal review and approval process, aiding the operator in judging the effectiveness and desirability of the proposed plan. The interface elements supporting these three main functions are detailed in the following sections.
A. Information Display
The default configuration of the DCAP system is the information display configuration, intended to address operator situational awareness of the system. Endsley’s definition of situational awareness (SA) includes three levels of perception, comprehension, and prediction 9. The DCAP displays supports each of these levels as it presents the
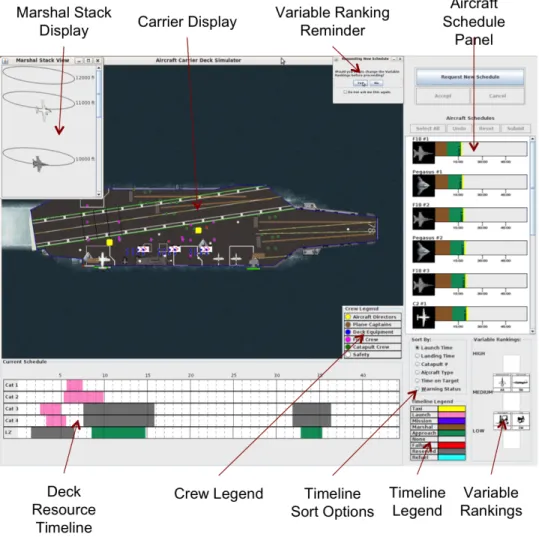
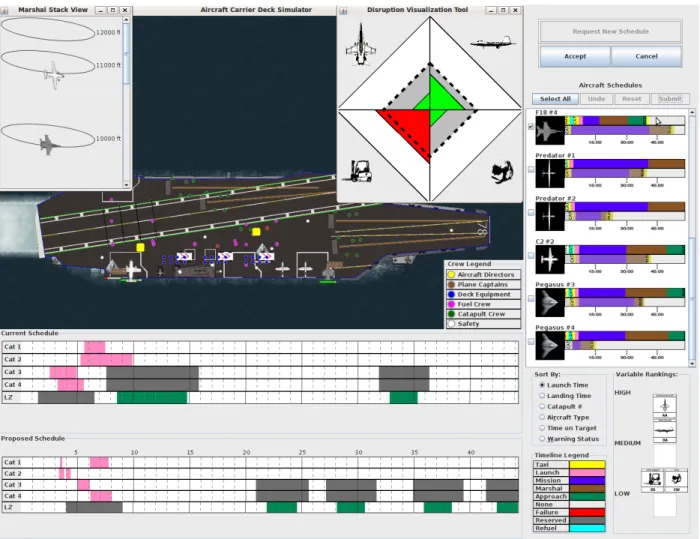
state of operations to the user. The ultimate goal of this part of the interface is to provide the operator with sufficient information to determine when to re-plan. An overview of the main system interface is shown in Figure 1.
The Carrier Display and Marshal Stack Display windows serve as the primary status windows, providing the current location, orientation, and motion of all entities in the system. This addresses the perception and comprehension levels of SA. The Carrier Display was designed as the largest window in the display, providing the operator with a two dimensional view of current operations. In this frame, users are able to observe the actions of all aircraft, crewmembers, and ground vehicles in real-time (assuming the futuristic use of RFID tracking, or something similar). Some flexibility is allowed in the display of information in this window. Aircraft may be depicted by either MILSTD icons or realistic outlines. Also, the view may change between a close-up view of the deck (shown in Figure 1) or a larger perspective displaying the local airspace. The latter view shows aircraft currently in holding patterns or on approach trajectories towards the deck. For either display view, fuel bars are included beneath each vehicle icon. In the close-up Deck View, crewmembers are shown as circles in their corresponding jersey color (i.e. purple for fuel crew, red for ordnance, etc.), a listing of which is found in the Crew Legend. Ground vehicles are shown by a rectangular figure with two carats (>>) overlaid. The color of the carats corresponds to the task of that vehicle (again, purple for fuel, red for ordnance, etc.). Using colors common to domain experts should reduce the mental effort required to decode the symbols.
Figure 1. Overview of DCAP in the Information Display configuration.
The Marshal Stack Display supports operator awareness of incoming aircraft, depicting all aircraft currently waiting to land and their landing order. The aircraft at the lowest altitude will be the first to land, and subsequent aircraft are added at higher altitudes. Regardless of the view perspective of the Carrier Display, this list is always available to the operator and continues to update as aircraft begin to land. In several demonstrations for Naval personnel, the display of the Marshal Stack has been particularly well received.
The remaining features of the interface focus on depicting the current operational state in terms of “local” or “global” perspectives. The “global” perspective gives the operator insight to the cost function of the automated algorithm, which attempts to create an optimal schedule. Within DCAP, this includes display elements and controls related to the allocation of system resources and the prioritization of groups of crew and vehicles. The “local” perspective corresponds to the human satisficing, where only a small portion of the overall problem is solved. This perspective considers the individual aircraft as the point of emphasis. These local and global perspectives are supported by two sets of timelines in Figure 1, the Aircraft Schedule Panel (ASP) and the Deck Resource Timeline (DRT), respectively. Timelines were used, rather than text-based schedule displays, in order to ease the cognitive processing required to assimilate schedule information. This aids in the comprehension level of SA. Within each timeline, different segments are color-coded to highlight different tasks or conditions, and colors are consistent between the two timelines, easing the cognitive burden on the operator.
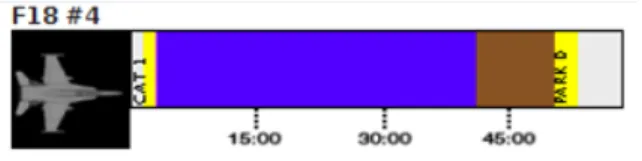
The Aircraft Schedule Panel displays information on the local level, depicting the schedule of tasks for each aircraft independently. Aircraft Boxes, each corresponding to a different individual aircraft and depicting its name and icon, populate the ASP. Each timeline shows upcoming schedule information for the next hour, with tasks differentiated by color as listed in the Timeline Legend. Figure 2 gives an enlarged view of one aircraft box, showing
aircraft F18 #4 in the midst of deck operations. The timeline here shows that F18 #4 is currently in a “wait” state (no color), will then taxi to catapult 1, takeoff, perform a mission, then return to land and taxi to a parking location.
The ASP also displays information on aircraft failure states, which will typically influence operator planning priorities. In this case, the operator may simply seek a schedule that compensates for individual aircraft failures. When an aircraft failure occurs, the corresponding box in the ASP is shaded red (Figure 3) and immediately moved to the top of the panel. This ensures that failure messages at the bottom of the list are become visible to the operator, addressing level 1 SA (perception). A small text descriptor appears at the top of the box to identify the failure that has occurred (in this case, a fuel leak), allowing the operator to use his/her own experience in judging the relative priority of the failure.
The Deck Resource Timeline (DRT) (Figure 4) supports the global perspective, integrating information from the individual aircraft schedules into a representation of resource usage on the deck. This allows the user to quickly assess how well system resources are allocated and what the expected system workload will be in the immediate future. The DRT depicts tasks for the four catapults and the landing strip (LZ). Within the DRT, regions in pink and green represent the expected periods of usage of each resource. For consistency, colors within this bar were coded to match the colors used in the ASP, i.e., green for landing tasks and pink for launch tasks. Note also that the DRT includes gray areas, visible in Figure 4 for Catapults 3 and 4 and the LZ. This is an important limitation of aircraft carrier operations – because the landing strip and the port side catapults are collocated, these resources cannot be active at the same time. Also, a switching cost exists when shifting from launch operations to landing operations. To reinforce these limitations to the operator, while one operation (launching or landing) is occurring, the resource for the alternate activity is grayed out.
The DRT also displays failure information to the operator. As the DRT is the main source of information concerning deck resources, resource failure notifications for the deck resources appear here. In the case of a catapult failure (as shown for Catapult 1 in Figure 4), the corresponding line within the DRT flashes red. This continues until the resource is repaired. Aircraft failures that are time-sensitive are also shown in the DRT. For a fuel leak, a certain point in the future corresponds to the predicted complete loss of fuel. To signify this “point of no return” to the operator, a vertical red line appears within the DRT – the operator must replan before this time. Within Figure 4, it can be seen that the operator has slightly over 10 minutes to re-plan for F18 #1 before the scheduler can no longer find a feasible solution. Note that this display is only for a certain subset of failures. Conditional failures, such as a mechanical failure without leak, will appear only in the ASP.
Figure 4. Deck Resource Timeline displaying three failures.
The emphasis of this display configuration is the presentation of timely and complete information to the operator. It is up to the operator to make the judgment as to whether a new schedule of operations is needed. It is the
Figure 3. Example of Aircraft Box failure display Figure 2. Enlarged view of an Aircraft Box.
responsibility of the operator to make this decision and initiate the re-planning process. This is done by pressing the Request Schedule button at the upper right hand corner of the screen.
B. Plan Creation Display
Given the dynamic nature of carrier operations, DCAP allows the operator to convey his/her goals to the planning algorithm by indicating global priorities and local constraints for the system. These are then submitted to the automated planning algorithm, which creates a new schedule of operations. The definition of these priorities and constraints is accomplished through two different elements within the interface. These two elements again address the local and global perspectives of functionality.
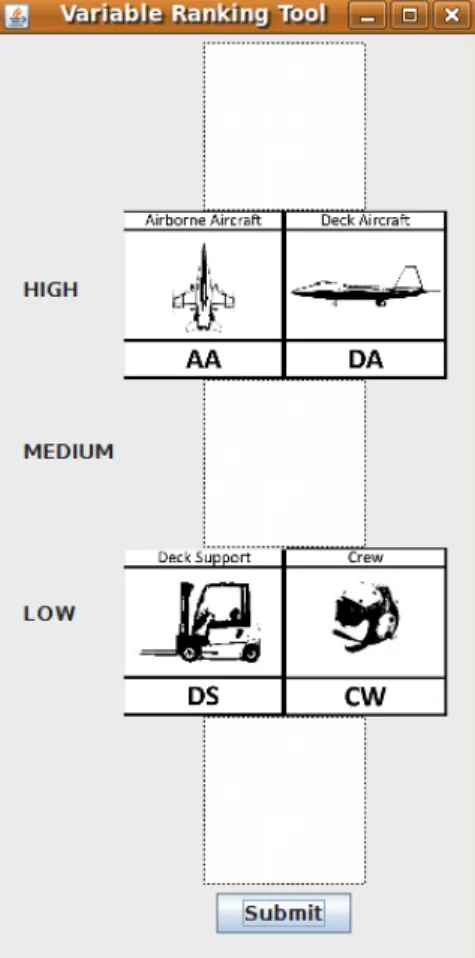
Upon schedule request, the Variable Ranking Tool (VRT) in Figure 1 enlarges, moves to the interior of the screen, and becomes actionable (Figure 5 provides an enlarged view of the VRT, Figure 6 shows how the full display is rearranged). The VRT addresses global properties through the handling of groups of entities in the system. Globally, functional groups of entities can be correlated to weights for the objective function of the scheduling algorithm. In the case of DCAP, these groups are defined as Airborne Aircraft (AA), Deck Aircraft (DA), Crew Working on deck (CW), and Desk Support vehicles (DS). Conditions may exist during operations that require a prioritization of one group over another. If a mission requires many aircraft launched immediately, the Deck Aircraft group may become a priority. Conversely, if a large number of aircraft need to land quickly, the Airborne Aircraft group may be prioritized.
Prior research has indicated that decision-makers are more proficient with relative judgments than absolute ones 10, and the VRT addresses this through the use of a five-level drag-and-drop interface. This format provides minimally intensive interaction while allowing the user to quickly establish the relative importance of variable groups. The ranking system is also flexible. Operators may choose to rank all items on a single level or on different levels, in any order they choose. The final rankings define the weights for the objective function of the automated planning algorithm, removing a layer of opacity between user and automation. Even though the user may be entirely unfamiliar with the concept of objective functions, the VRT allows them to directly specify the relative weights for
this function in an easily understandable format. Note that the exact specification of the objective function weights is dependent on the architecture of the automated algorithm, which is currently in development.
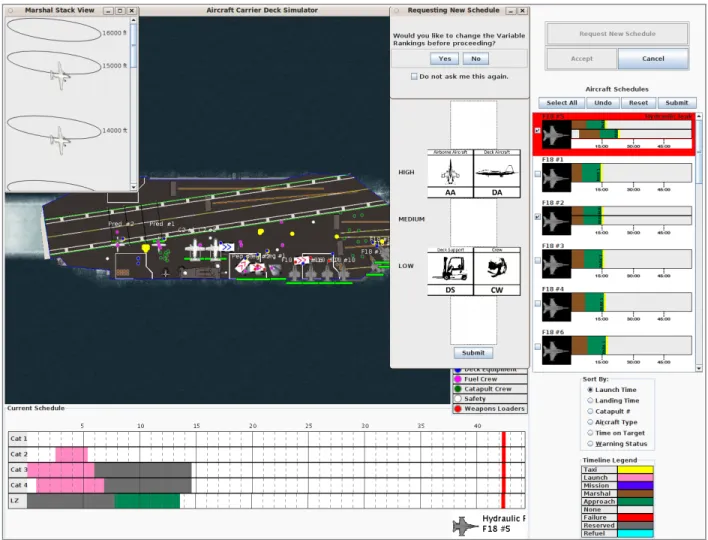
Engaging the scheduling algorithm also involves the definition of localized schedule constraints. Recall that the individual aircraft is the point of local emphasis. Localized constraints consist of priority designations for individual aircraft and desired schedule properties for these aircraft. These two specifications are considered within the ASP in a two-step process. As noted earlier, within the ASP, each aircraft is presented in an Aircraft Box along with a depiction of its schedule. When the scheduling process is initiated, a series of checkboxes appear next to each Aircraft Box (Figure 6). By checking a box, the operator designates the aircraft as a priority vehicle (note the first and third vehicles in the ASP in Figure 6). This priority designation is carried over to the scheduling algorithm, constraining the schedule of this vehicle. The specific mechanics of this designation depends on the architecture of the algorithm, but can be conceptualized as a higher weight placed on that aircraft and its tasks. Selecting this check box also splits the timeline into halves lengthwise. The upper half of the schedule continues to show the current schedule of the aircraft, while the lower half is actionable. The operator uses this bar to suggest an operating schedule for the aircraft. Operators may move the schedule forward (perform tasks earlier), backwards (perform tasks later), or lengthen or shorten the duration of certain tasks. In Figure 6, a suggestion to delay tasks is given for the first failed aircraft (F18 #5). During this process, the user may change priority levels and schedules of one, none, or all aircraft. When finished, the user submits this information to the scheduling algorithm. When the algorithm is finished with its computations, the algorithm’s proposed schedule is relayed to the operator through the same interface elements used in this step.
Figure 5. Enlarged view of the Variable Ranking Tool.
Figure 6. DCAP Interface for the Plan Creation configuration. C. Plan Review Display
When the automated planning algorithm has completed its computations, the human operator must still give his/her approval for schedule adoption. This new schedule information is provided in three ways. First, changes in deck resource allocation are relayed through a modification to the Deck Resource Timeline. Second, changes to individual aircraft schedules are relayed through modifications to the Aircraft Schedule Panel. Third, a new window appears, describing the relative quality of the schedule with respect to the four variable groups ranked previously. This window, the Disruption Visualization Tool (DVT), links to the rankings specified in the Variable Ranking Tool. The goal of this configuration is to enhance operator comprehension and prediction of the performance of the proposed schedule and the impact of their selected rankings.
While in the Plan Creation configuration, the Aircraft Schedule Panel was used in defining local aircraft priorities and suggesting schedules for these aircraft. Operators made schedule suggestions by dragging the bottom half of the aircraft timeline in either direction, while the upper half was preserved as a depiction of the current timeline. During Plan Review, this same convention is used – the upper half of the timeline shows the current schedule, but the bottom half is now populated with the proposed schedule (Figure 7, below). This allows the operator to perform a rapid, one-to-one comparison of the current and suggested timelines for each aircraft. This comparative display allows users to quickly comprehend the changes the schedule has made, while the nature of the timeline allows user to extract the future performance of the aircraft.
A similar convention is used in the Deck Resource Timeline. During plan proposal review, a second instance of the DRT appears beneath the current DRT and depicts the proposed resource allocation (Figure 7). Again, the operator can quickly scan and compare the differences in resource allocation between the current and proposed schedule.
Figure 7. DCAP Interface for the Plan Review configuration.
The third aspect of schedule comparison occurs in the Disruption Visualization Tool (DVT), shown again in Figure 8. The DVT is a configural display, in which a set of data is mapped using geometric shapes and colors. The goal of a configural display is to enable the comparison of complex data in an intuitive manner 11-13. In the case of DCAP, this tool is used for comparing the relative performance of the proposed schedule to the current schedule with regards to the four variable groupings ranked earlier. The diamond that appears in this window is divided into four quadrants, one for each variable group. Each of these quadrants will contain a colored triangle of some size, shaded either red or green. The size and hue of each triangle reflects the relative performance of this entity group in the proposed schedule. If the proposed schedule predicts higher performance for a group than the current schedule, the corresponding quadrant will contain a smaller, green triangle. Lower performance is denoted by a larger, red triangle. The relative size of the triangle denotes the magnitude of this change, and the dashed black line denotes no change in performance. For the DVT shown in Figure 8, Airborne and Deck Aircraft (upper left and upper right, respectively) are predicted to have better performance in the proposed schedule. For Crew and Deck Support vehicles, the opposite is true.
The goal of this interface is to remove a layer of opacity from the algorithm and allow the operator to understand the actions of the scheduling algorithm. Ultimately, the determination as to whether the schedule should be
Figure 8. The Disruption Visualization Tool (Clockwise from
implemented is the responsibility of the operator. It is not the purpose of the interface to bias the operator towards a certain decision, but instead to present information in order to make an informed and accurate decision. When the operator is satisfied with the schedule, clicking the Accept button submits the new schedule to the system, schedules are refreshed, and the system reverts to the Information Display configuration. This action also clears the notice of certain failures within the DRT. Failure notices remain in the ASP, but in a less salient hue, as they have been compensated for by the new schedule. This resets the system so that the operator can be apprised of new updates without being confused by older, previously solved issues.
III. Limitations
To this date, a comprehensive usability study involving stakeholders has not been performed. Although several interviews have taken place with Naval personnel in order to improve the fidelity of the simulation environment and to explore current planning strategies of operators, a coordinated testing effort has not been possible due to limited subject accessibility. This topic will be addressed in future research.
Also, an underlying assumption of the DCAP system is that a great deal of information is readily available to the system. While this may not yet be possible in the aircraft carrier environment, it is outside the scope of this research to provide details on the required hardware architecture.
IV. Current and Future Work
Currently, a test program designed to test and validate the performance of the system using realistic scenarios is underway. This testing program involves the use of both an automated planner and a set of Subject Matter Expert heuristics across varying levels of scenario complexity. The automated planning algorithm currently in use is an Integer Linear Program (ILP) 14. In the case of DCAP, the ILP minimizes a cost function based on total time of activity. The weights of the objective function are established from the rankings in the Variable Ranking Tool (Airborne Aircraft, Deck Aircraft, etc.). The planning algorithm additionally considers both “hard” constraints, such as fuel constraints and the appropriate task ordering, and “soft” constraints taken from the operator input in the Aircraft Schedule Panel. The planner will ensure that hard constraints are not violated,and for the soft constraints, the planner will attempt to minimize the difference between the operator-suggested schedules and the proposed plan. Currently, design changes are underway that will allow the system interface to highlight to the operator when these soft constraints are violated (that the planner was unable to satisfy their requests as specified).
Preliminary results are shown in Figure 10 and Figure 11. For each scenario, three planner variations were applied, each beginning with the same initial schedule. In the figures below, column 1 on the x-axis is a No-failure Baseline case. In this case, no failure occurs in the system, and the schedule is allowed to execute as originally specified. This provides a comparison point for the remaining two planning conditions. Column 2 is the manual, Only planning case and column 3 is the combined Algorithm planning. The combined Human-Algorithm planning uses the DCAP system as designed. The Human-Only case uses a modified version of the DCAP interface that allows users to manually input schedules into the system. For each scenario and planner combination, 30 trials were performed. Independent Mann-Whitney U Tests were performed to determine the similarity of the distributions across the three planning conditions.
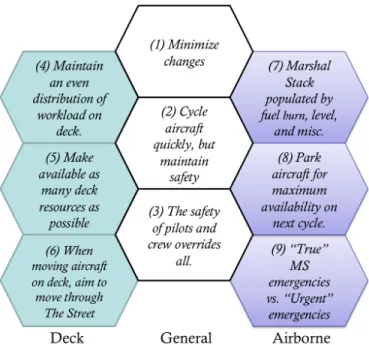
Figure 10 gives results from a launch scenario, a case where aircraft began parked on the deck and proceeded to launch. In this case, a catapult was failed in the midst of operations. Re-planning the schedule involved the reassignment of aircraft to other available catapults. This scenario was termed the “Simple” scenario based on the required number of Subject Matter Expert planning heuristics (four out of nine) that were required to replan for this failure. These heuristics were developed and validated through the course of several interviews with Naval personnel and are shown in Figure 9. Figure 10a shows the variations in mission duration across the three planner variations. Figure 10b shows a measure of collision avoidance for the deck vehicles (termed Primary Halo Violations, PHV). Statistical testing was performed in order to determine the similarity of distributions between conditions. Independent Mann-Whitney U Tests were performed between pairs of conditions. The results of these tests appear in Table 1, where p-values below 0.004 imply statistical significancef and that the data was indeed
different across planning conditions. The results of this testing show that, for this simple scenario, the manual, human-only planning actions (condition 2) performed significantly better than the combined human-algorithm planning (condition 3) for both the Mission Duration and Primary Halo Violation measures.
Figure 9. Subject Matter Expert Planning Heuristics.
Figure 10a. Mission Duration results from the Simple launch scenario (1 – No-failure baseline; 2
– Human-Only manual planning; 3 – combined Human-Algorithm planning).
Figure 10b. Primary Halo Violations results from the Simple launch scenario (1 – No-failure baseline; 2 – Human-Only manual planning; 3 –
combined Human-Algorithm planning).
Table 1.Results of statistical testing for the Simple scenario (* implies significant results for α = .004).
Comparison
MD p value
PHV p value
1-2
< 0.001*
< 0.001*
1-3
< 0.001*
< 0.001*
Mann-Whitney
U Test
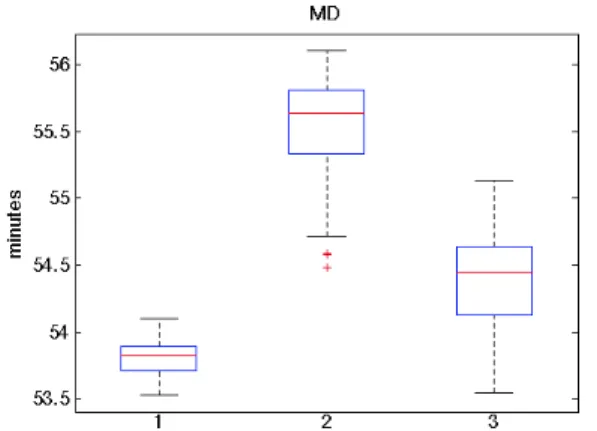
Figure 11 gives results from the “Moderate” recovery scenario. Here, all aircraft began in flight, returning from mission to a holding pattern, from which aircraft would then begin an approach trajectory to the deck in set time intervals. In this scenario, two aircraft encountered failures – one experienced a fuel leak, the other a hydraulic failure. Re-planning the system required changing the landing order to ensure that both aircraft landed without violating the safety margins for fuel or hydraulic fluid. This scenario was termed the “Moderate” scenario, as it required five of the nine Subject Matter Expert planning heuristics (a third, “Complex” scenario required seven of nine). Figure 11a gives the final Mission Duration values while Figure 11b gives Primary Halo Violation values. Columns 1-3 correspond to the No-failure baseline, Human-Only planning, and Human-Algorithm planning conditions, respectively. Statistical testing was again performed in order to determine the similarity of distributions between conditions. Independent Mann-Whitney U Tests were again performed between pairs of conditions. The results of these tests appear in Table 2, and again, p-values below 0.004 imply statistical significance and that the data was indeed different across planning conditions. In this scenario, the combined human-algorithm planner outperformed the manual-only condition in regards to Mission Duration, but expectedly, neither the human-only or human-algorithm case performed as well as the original schedule with no failures. In terms of the collision avoidance value PHV, there was no difference between the original schedule (condition 1) and the manual (condition 2) or between the original and the combined human-algorithm (condition 3). However, marginally significant results were shown between the human-only and the human-algorithm cases, with the human-algorithm cases having a lower mean value and a tighter variance.
Figure 11a. Results from the Moderate scenario – Mission Duration (left) and Primary Halo Violations (right). (1 – No-failure baseline; 2 –
Human-Only manual planning; 3 – combined Human-Algorithm planning)
Figure 11b. Results from the Moderate scenario – Mission Duration (left) and Primary Halo Violations (right). (1 – No-failure baseline; 2 – Human-Only manual planning; 3 – combined
Human-Algorithm planning)
Table 2. Results of statistical testing for the Moderate scenario (* implies significant results).
Comparison MD p value
PHV p value
1-2
< 0.001*
0.778
1-3
< 0.001*
0.022
Mann-Whitney U
Test
2-3
< 0.001*
0.004*
As can be seen, results are mixed for the two planning systems. In the launch scenario, the manual user-created schedule out-performed the automated planning system in terms of both total mission time and collision avoidance. In the recovery (Moderate) scenario, which was more highly constrained, the manual schedule was out-performed by the automated planning system in regards to both metrics.
crew member (or other entity) crosses certain warning boundaries around the catapult, that resource is deactivated while the crew member is within the boundary. In these cases, the planning algorithm was unable to recognize that this is a transient condition – the crew member is either moving through the area or is stationary and will move momentarily. The planner instead considered this resource to be permanently disabled, and the new schedule proposal ignored the existence of this resource. The human planning heuristics implicitly assume that this is a transient condition and does not consider it.
In the Moderate case, which is more highly constrained (in that only one landing strip exists), the planner was able to perform better than the human in terms of Mission Duration. Although the overall magnitude of difference is modest, the system was able to optimize the schedule more efficiently than the human planner. Primary Halo Violations, in this case, vary only between the Human-Only and Human-Algorithm cases, with the latter showing a much smaller deviation. This was a surprising result, given the minimal number of aircraft on deck during landing. This is likely an artifact of how the algorithm was ordering aircraft on landing, resulting in cleaner and less chaotic deck movement.
These results show that for relatively simple cases – when the number of applicable operator heuristics is low – the Subject Matter Expert planning heuristics work very well, and automated planning algorithms may not be needed. However, as the system becomes more complex, planning algorithms may be able to achieve performance gains beyond the state-of-the-art heuristic approach. This is of particular importance for military operations as increasing numbers of types of UAVs are included in the deck environment, further increasing its complexity.
Additional future work involves the inclusion of the third, “Complex” scenario in the data analysis, as well as a review of additional measurement metrics not discussed here. Furthermore, the creation of two additional planners and preparation for a live demonstration of the system using miniature Unmanned Vehicles (UxVs) is underway. The live demonstration will involve a human operator using the DCAP interface to control and replan several UxVs on a miniaturized aircraft carrier deck. These objectives are expected to be completed by early Summer 2011.
Acknowledgments
This work was performed by members of the Aerospace Controls Lab (ACL), Computer Science and Artificial Intelligence Lab (CSAIL), the Humans and Automations Lab (HAL), and the Laboratory for Information and Decision Systems (LIDS) at MIT under the Office of Naval Research Science of Autonomy program, Contract #N000140910625. Many thanks are owed to the numerous students and professors that aided in the development of this system.
References
1.Simon, H. A. Models of Bounded Rationality. Cambridge, MA: MIT Press, 1982.
2.Lipshitz, R., Klein, G., Orasanu, J., and Salas, E. "Taking Stock of Naturalistic Decision Making," Journal of
Behavioral Decision Making Vol. 14, No. 5, 2001, pp. 331-352.
3.Fitts, P. M., ed. Human Engineering for an Effective Air Navigation and Traffic Control system. Washington, DC:
National Research Council, 1951.
4.Smith, P., McCoy, E., and C. Layton. "Brittleness in the design of cooperative problem-solving systems: The
effects on user performance," IEEE Transactions on Systems, Man, and Cybernetics-Part A: Systems and Humans Vol. 27, 1997, pp. 360-371.
5.Cummings, M. L., and Thornburg, K. T. "Paying Attention to the Man Behind the Curtain," IEEE Pervasive
Computing Vol. 10, No. 1, 2011, pp. 58-62.
6.Ruff, H. A., Narayanan, S., and Draper, M. H. "Human Interaction with Levels of Automation and Decision-Aid
Fidelity in the Supervisory Control of Multiple Simulated Unmanned Air Vehicles," Presence Vol. 11, No. 4, 2002, pp. 335-351.
7.Parasuraman, R., Sheridan, T. B., and Wickens, C. D. "A Model for Types and Levels of Human Interaction with
Automation," IEEE Transactions on Systems, Man, and Cybernetics - Part A: Systems and Humans Vol. 30, No. 3, 2000, pp. 286-297.
8.Billings, C. E. Aviation Automation: The Search for a Human-Centred Approach. Mahwah, NJ: Lawrence Erlbaum
Associates, 1997.
9.Endsley, M. R. "Toward a Theory of Situation Awareness in Dynamic Systems," Human Factors Vol. 37, No. 1,
10.Sanders, M. S., and McCormick, E. J. Human Factors In Engineering and Design. New York: McGraw-Hill,
1993.
11.Bennett, K. B., and Flach, J. M. "Graphical Displays: Implications for Divided Attention, Focused Attention, and
Problem Solving," Human Factors Vol. 34, No. 5, 1992, pp. 513-533.
12.Wickens, C. D., and Carswell, C. M. "The Proximity Compatibility Principle: Its Psychological Foundation and
Relevance to Display Design," Human Factors Vol. 37, No. 3, 1995, pp. 473-494.
13.Gibson, J. J. The Ecological Approach to Visual Perception. Boston, MA: Houghton Mifflin, 1979.
14.Banerjee, A. G., Ono, M., Roy, N., and Williams, B. "Regression-based LP Solver for Chance Constrained Finite
Horizon Optimal Control with Nonconvex Constraints," Proceedings of the American Control Conference. San Francisco, CA, USA, 2011.