HAL Id: hal-00317670
https://hal.archives-ouvertes.fr/hal-00317670
Submitted on 3 Jun 2005
HAL is a multi-disciplinary open access
archive for the deposit and dissemination of
sci-entific research documents, whether they are
pub-lished or not. The documents may come from
teaching and research institutions in France or
abroad, or from public or private research centers.
L’archive ouverte pluridisciplinaire HAL, est
destinée au dépôt et à la diffusion de documents
scientifiques de niveau recherche, publiés ou non,
émanant des établissements d’enseignement et de
recherche français ou étrangers, des laboratoires
publics ou privés.
Comparison of MODIS and AERONET derived aerosol
optical depth over the Ganga Basin, India
S. N. Tripathi, Sagnik Dey, A. Chandel, S. Srivastava, Ramesh P. Singh, B. N.
Holben
To cite this version:
S. N. Tripathi, Sagnik Dey, A. Chandel, S. Srivastava, Ramesh P. Singh, et al.. Comparison of MODIS
and AERONET derived aerosol optical depth over the Ganga Basin, India. Annales Geophysicae,
European Geosciences Union, 2005, 23 (4), pp.1093-1101. �hal-00317670�
Annales Geophysicae, 23, 1093–1101, 2005 SRef-ID: 1432-0576/ag/2005-23-1093 © European Geosciences Union 2005
Annales
Geophysicae
Comparison of MODIS and AERONET derived aerosol optical
depth over the Ganga Basin, India
S. N. Tripathi1, Sagnik Dey1, A. Chandel1, S. Srivastava1, Ramesh P. Singh1,2, and B. N. Holben3
1Department of Civil Engineering, Indian Institute of Technology, Kanpur-208016, India 2School of Computational Sciences, George Mason University, Fairfax, Virginia 22030, USA 3NASA Goddard Space Flight Center, Greenbelt, MD, USA
Received: 2 August 2004 – Revised: 16 March 2005 – Accepted: 22 March 2005 – Published: 3 June 2005
Abstract. The Moderate Resolution Imaging Spectrora-diometer (MODIS) onboard EOS Terra measures global aerosol optical depth and optical properties since 2000. MODIS aerosol products are freely available and are be-ing used for numerous studies. In this paper, we present a comparison of aerosol optical depth (AOD) retrieved from MODIS with Aerosol Robotic Network (AERONET) data for the year 2004 over Kanpur, an industrial city lying in the Ganga Basin in the northern part of India. AOD retrieved from MODIS (τaMODI S)at 0.55µm
wave-length has been compared with the AERONET derived AOD (τaAERON ET), within an optimum space-time window.
Al-though the correlation between τaMODI S and τaAERON ET
during the post-monsoon and winter seasons (R2∼ 0.71)
is almost equal to that during the pre-monsoon and mon-soon seasons (R2∼0.72), MODIS is found to overestimate AOD during the pre-monsoon and monsoon period (char-acterized by severe dust loading) and underestimate during the post-monsoon and winter seasons. The absolute differ-ence between τaMODI Sand τaAERON ET is found to be low
(0.12±0.11) during the non-dust loading season and much higher (0.4±0.2) during dust-loading seasons. The absolute error in τaMODI Sis found to be about ∼25% of the absolute
values of τaMODI S. Our comparison shows the importance
of modifying the existing MODIS algorithm during the dust-loading seasons, especially in the Ganga Basin in northern part of India.
Keywords. Atmospheric composition and structure (Pollution-urban and arid region; Aerosols and particles) – Radio science (Remote sensing)
1 Introduction
Estimation of the radiative forcing of the aerosol is uncer-tain due to the incomplete knowledge of the microphysical
Correspondence to: Ramesh P. Singh
and optical properties of aerosols and their extreme hetero-geneous spatial distribution (Charlson et al., 1992; Tegen et al., 1996; Hansen et al., 1997; Haywood and Boucher, 2000; Satheesh and Ramanathan, 2000; Boucher and Haywood, 2001). The knowledge of spatial and temporal distributions of aerosols on a global scale is important to understand the dynamics of aerosol and the associated influence on global climatic conditions. Satellite remote sensing is an essential tool for monitoring the global aerosol budget and their radia-tive effects on climate (Charlson, 1992; Penner et al., 1992; Andreae, 1995; Kaufman et al., 1997a, 2002a). A single ground-based aerosol monitoring station is not very useful in assessing global aerosol distribution due to the strong spa-tial and temporal variability of aerosol particles in the atmo-sphere. However, the network of ground-based stations are essential in estimating the microphysical and optical prop-erties of the ambient aerosol column in a particular region (Kaufman et al., 1994; Holben et al., 1996, 1998), which is required to validate the satellite measurements and to in-crease the accuracy of the retrieval techniques of the satel-lites in a regional scale. Most of the aerosol properties have been derived over the ocean from remote sensing data be-cause of the minimum spatial variability of the ocean surface reflectance. The first instrument designed for aerosol mea-surements over land was the Polarization and Directionality of Earth’s Reflectance (POLDER), which was only opera-tional for nine months (Boucher and Tanr´e, 2000; Deuz´e et al., 2000). The launch of Earth Probe Total Ozone Measuring Spectrometer (EP-TOMS) in 1996, which can detect absorb-ing aerosols from the backscatterabsorb-ing in the ultraviolet spectra (0.34 and 0.38µm) both over the land and ocean (Hsu et al., 1996; Herman et al., 1997), added new insight into investiga-tions of elevated dust and smoke layers above the scattering atmosphere.
The launch of MODIS on board the Earth Observing Sys-tem (EOS) Terra and Aqua satellites (King et al., 1999) provides a unique opportunity in deriving spectral informa-tion of aerosol parameters over land in the visible wave-length region. MODIS-derived aerosol properties over land
1094 S. N. Tripathi et al.: Comparison of MODIS and AERONET derived aerosol optical depth over the Ganga Basin, India
18
Aerosol monitoring stations in India
Regional air mass during pre-monsoon and monsoon seasons
Regional air mass during post-monsoon and winter seasons
Regional air mass during monsoon season
Dharwar Goa
Fig. 1
Industrial area
Desert area
18 Aerosol monitoring stations in IndiaRegional air mass during pre-monsoon and monsoon seasons Regional air mass during post-monsoon and winter seasons Regional air mass during monsoon season
Dharwar Goa
Fig. 1
Industrial area Desert area
Fig. 1. Study area with regional air mass during different seasons. The industrial areas near Kanpur are marked by solid boxes and the
western Thar Desert is shown by ellipsoid.
(Kaufman et al., 1997b; Chu et al., 1998, 2002; Ichoku et al., 2002) and over the ocean (Tanr´e et al., 1997; Remer et al., 2002) have been validated by more than 30 Aerosol Robotic Network (AERONET) stations worldwide. Recently, Vinoj et al. (2004) have used MODIS data to study aerosol prop-erties over the Bay of Bengal and compared them with ship-borne measurements. But discrepancies still remain in under-standing the aerosol properties in many parts of the world, especially over the Indian sub-continent due to the absence of ground-based aerosol monitoring stations.
Currently, 192 AERONET stations are operational world-wide. In the Indian sub-continent, three stations were
originally deployed at Kanpur (26◦N, 80◦E), Goa (15◦N, 73◦E) and Dharwar (15◦N, 74◦E), out of which only the Kanpur station is still functional (Fig. 1). Besides AERONET, the Indian Space research Organization (ISRO) has established a few ground-based aerosol monitoring sta-tions across the country (Krishna Moorthy et al., 1999), where multi-wavelength radiometers are operational (Fig. 1). But in view of the strong spatial and temporal variability of aerosols, the existing ground-based aerosol-monitoring net-works in India are not sufficient to establish an aerosol clima-tology of the whole country. Therefore, the need for satellite measurements and validation has grown manifold in India,
S. N. Tripathi et al.: Comparison of MODIS and AERONET derived aerosol optical depth over the Ganga Basin, India 1095 especially over the Ganga Basin in the northern part of
In-dia, where currently only one station (Kanpur) is monitoring aerosols continuously. In this paper, comparison of MODIS-derived aerosol optical depth (AOD, τa) with AERONET
measurements over Kanpur city has been made for the year 2004 which shows significant differences during dust events in pre-monsoon season.
2 Study area
Ganga Basin, one of the largest drainage basins in the world, is bordered by the Himalayas to the north and Vindhyan– Satpura ranges to the south (Fig. 1). The Ganga Basin is tra-versed by the two main rivers, Ganga and Yamuna, and their tributaries. More than 45 million people live in the Ganga Basin, where, due to urbanization and industrialization, the population burden is continuously increasing; as a result the pollution level is increasing over the region as mapped by ADEOS POLDER 1 data (Goloub et al., 2001). Due to the mixing of aerosols loaded by natural and anthropogenic sources, the aerosol parameters over the Ganga Basin show strong seasonal variability (Singh et al., 2004). The Ganga Basin experiences four seasons annually, winter (December– February), pre-monsoon (March–May), monsoon (June– August) and post-monsoon (September–November). During the post-monsoon and winter seasons, the whole region is dominated by aerosols of anthropogenic sources loaded by local and northerly winds (Singh et al., 2004), whereas dur-ing the pre-monsoon and monsoon seasons, dust is the dom-inant component (Dey et al., 2004). The loading of different types of aerosols over the Ganga Basin in different seasons makes the retrieval of aerosol parameters from satellite mea-surements more problematic.
3 Data
MODIS data are available at different processing levels, level 1.0 (geolocated radiance and brightness temperatures), level 2.0 (retrieved geophysical data products) and level 3.0 (King et al., 2003). AERONET data are also available at three levels, level 1.0 (unscreened), level 1.5 (cloud-screened) and level 2.0 (quality assured) (Holben et al., 1998). In the present study, level 2.0 MODIS data have been used to retrieve AOD and compared with level 2.0 AOD data of AERONET during January–November 2004. Level 2.0 AERONET data for December 2004 has not been released, hence it is excluded from the comparison.
Version 4.2.2 (collection 4) of MOD04 L2 (data collected from Terra platform) and MYD04 L2 (data collected from Aqua platform) data products have been used in this study. This new version is released during 2004, where modifica-tion has been made in the algorithm to improve the aerosol data product. During the monsoon season, due to the non availability of cloud free MODIS data over the northern part of India, it was not possible to make any comparison for the month of August.
3.1 MODIS
The radiant energy reflected and emitted by the Earth carries a signature of the atmospheric properties as it passes through the atmosphere. Satellites sensors can quantify several atmo-spheric properties by measuring the wavelength, angular and polarization of this reflected and emitted energy (Kaufman et al., 2002a). MODIS has 36 bands ranging from 0.4- to
14.4-µm wavelengths with three different spatial resolutions (250, 500 and 1000 m).
MODIS measures AOD with an estimated error of
±0.05±0.20τa over the land (Chu et al., 2002) at 0.47 and
0.66 wavelengths at 550-m resolution and extrapolated to a 0.55-µm wavelength (Ichoku et al., 2002). Except for dust, effect of the aerosols on the radiance measured by satel-lite decreases with wavelength (Kaufman, 1993), therefore the effect is much smaller in the mid-infrared compared to those of a visible wavelength. The dark pixels have been identified and their surface reflectance has been measured in blue (0.47 µm) and red (0.6 µm) channels from the re-motely sensed reflectance in the mid-infrared channels (2.1 and 3.8 µm). Kaufman et al. (1997b) have developed empir-ical relationships over the vegetated surfaces to deduce sur-face reflectance (ρs)at 0.47- and 0.66-µm wavelengths from
the observed ρs at 2.1-µm wavelength. MODIS aerosol
re-trieval over land is limited to pixels of ρs2.1 µm<0.2 to
mini-mize the errors. The aerosol type has been determined from the information on the global aerosol distribution and a suit-able aerosol dynamic model has been chosen to invert the measured radiance by satellites to produce aerosol data prod-ucts. The detailed methodology of the retrieval of AOD has been discussed by Kaufman et al. (1997b).
3.2 AERONET (AErosol RObotic NETwork)
The AERONET (Aerosol Robotic NETwork) program is an inclusive federation of ground-based remote-sensing aerosol networks established by NASA and greatly expanded upon by other agencies, institutes and university partners through-out the world (Holben et al., 1998). The goal of this program is to assess aerosol optical properties and to validate satellite retrievals of aerosol optical properties. The network imposes standardization of instruments, calibration, and processing. Data from this collaboration provides globally distributed ob-servations of spectral aerosol optical depths, inversion prod-ucts, and precipitable water in geographically diverse aerosol regimes. A CIMEL sun/sky radiometer takes measurements of the direct Sun and diffuse sky radiances at eight spectral channels within the range from 0.34 to 1.02 µm. Sky mea-surements are performed at 0.44-, 0.67-, 0.87- and 1.02-µm wavelengths through a large range of scattering angles from the Sun, using a constant aerosol profile to retrieve size distri-bution, phase function, and AOD (Holben et al., 1998). The uncertainty in retrieval of AOD under cloud free conditions is
<±0.01 for λ>440 nm and <±0.02 for shorter wavelengths. Under the AERONET program, a CIMEL sun/sky radiome-ter was deployed on the campus of the Indian Institute of
1096 S. N. Tripathi et al.: Comparison of MODIS and AERONET derived aerosol optical depth over the Ganga Basin, India
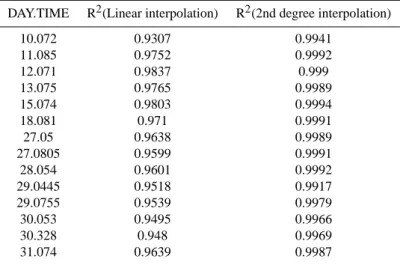
Table 1. R2value obtained by linear and 2nd degree interpolation for fourteen points τaAERON ET of January 2004.
DAY.TIME R2(Linear interpolation) R2(2nd degree interpolation)
10.072 0.9307 0.9941 11.085 0.9752 0.9992 12.071 0.9837 0.999 13.075 0.9765 0.9989 15.074 0.9803 0.9994 18.081 0.971 0.9991 27.05 0.9638 0.9989 27.0805 0.9599 0.9991 28.054 0.9601 0.9992 29.0445 0.9518 0.9917 29.0755 0.9539 0.9979 30.053 0.9495 0.9966 30.328 0.948 0.9969 31.074 0.9639 0.9987
Technology (IIT) Kanpur, which is continuously operational since January 2001.
4 Methodology
We generated spatial statistics of the MODIS derived AOD (τaMODI S) over Kanpur and corresponding statistics from temporal subsets of AERONET derived AOD (τaAERON ET).
The means and standard deviations of identical MODIS and AERONET parameters are compared. It would be inap-propriate to compare single MODIS pixel values directly to AERONET point measurement for many reasons. Firstly, the parameter value derived from MODIS is the spatial average over the pixel surface, while the value from AERONET is of a point in space. Secondly, the probability of overlap of the center of a pixel and the point observed by the Sun pho-tometer is very low. Another problem is that there is a time difference between the points (in temporal space) of acqui-sition of data by the two instruments. Air masses are con-stantly in motion, therefore, an air mass captured by MODIS across a certain horizontal span over a Sun-photometer site, is sampled by the Sun photometer during a certain time pe-riod (Ichoku et al., 2002).
To calculate the MODIS value at the AERONET station (Pa), we have extracted the parameter value of pixels lying in
±1/4◦of 26.45◦N latitude and 80.346◦E longitude (Kanpur
AERONET station) using HDFLook (Gonzalez and Deroo, 2003). A table of AOD along with the corresponding lat-itude and longlat-itude for these pixels was prepared and the mean (µ) and standard deviation (σ ) have been calculated. From these extracted values, the five nearest values lying within µ± σ have been chosen to reduce the error. A scatter plot of these five points has been drawn having independent variables, latitude and longitude, on the X and Y-axes and
dependent variable AOD on the Z-axis. A multiple regres-sion plane has been fitted to these points of the form:
Z = aX + bY + c . (1) Using Eq. (1), we have calculated the MODIS derived AOD for the Kanpur AERONET station (Pa).
The linear and quadratic interpolation techniques have been used to derive AOD at 0.55 µm from ARONET and the statistical parameters and correlation coefficient (R2)are compared. The correlation coefficients obtained from both the interpolation techniques for the month of January 2004 are shown in Table 1. The R2 values for the 2nd degree interpolation are found to be better than that of the linear interpolation, so the 2nd degree interpolation is chosen to calculate the AOD value at 0.55 µm, from available wave-lengths. To determine τaAERON ET value at the time of the
overpass of MODIS over Kanpur, two points have been se-lected within ±15 min of the MODIS overpass time (Tm)and used to interpolate the value at Tm. The τaAERON ET and τaMODI S values are merged to form a common data set for
further analysis. In 2004, we have found 19 data of Terra and 46 data of Aqua matching AERONET in the specified time-space window. Using this merged data set, τaMODI S and τaAERON ET have been compared and statistical parameters
have been studied.
5 Results and discussion
Figure 2 shows the monthly averaged AOD values at
0.55-µm wavelength retrieved from MODIS and AERONET over Kanpur during 2004, with the number of days considered for each month (days are mentioned above the MODIS-derived AOD bar plots). AOD is found to show strong seasonal variations with maximum value (τaMODI S>1 and τaAERON ET>0.75) during the summer months. τaMODI S
S. N. Tripathi et al.: Comparison of MODIS and AERONET derived aerosol optical depth over the Ganga Basin, India 1097
Fig. 2. Monthly averaged AOD at 0.55 µm wavelength over Kanpur during the year 2004 retrieved from MODIS and AERONET. The error
bars represent the standard deviation of AOD for that month. Numbers above the histogram of MODIS derived AOD represent the number of data points for the respective month.
y = 0.69x + 0.12 R2 = 0.71 0 0.4 0.8 1.2 1.6 2 0 0.4 0.8 1.2 1.6 2 AERONETAOD MODIS AOD
3a
1:1 line y = 2.46x - 0.63 R2 = 0.72 0 0.4 0.8 1.2 1.6 2 0 0.4 0.8 1.2 1.6 2 AERONETAOD MODIS AOD3b
1:1 lineFigure 2
14
17
10
1
2
1
3
6
11
0
0.5
1
1.5
2
J
F
M
A
M
J
J
A
S
O
N
Months
AOD (0.55 um)
MODIS
AERONET
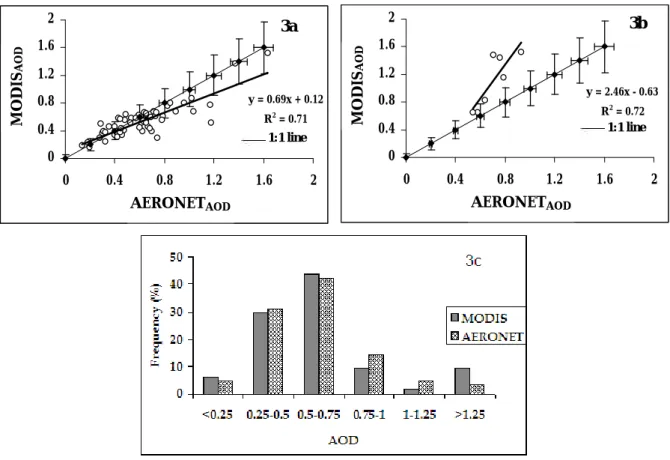
Fig. 3. Scatter plot between AOD derived from MODIS and AERONET in 2004 during (a) non-dust loading period and (b) dust-loading
period and (c) frequency distribution of AOD derived from AERONET and MODIS. The error bars in Figs. 3a and b indicate the range of MODIS expected accuracy (±0.05±0.2τa)from the 1:1 line (along Y-axis) and the uncertainty of AERONET measurements (along X-axis).
1098 S. N. Tripathi et al.: Comparison of MODIS and AERONET derived aerosol optical depth over the Ganga Basin, India
20
Figure 4
Figure 5
y = 0.27x - 0.01 R2 = 0.240
0.2
0.4
0.6
0.8
1
0
0.5
1
1.5
2
MODIS
AODAbsolute Error
4
5
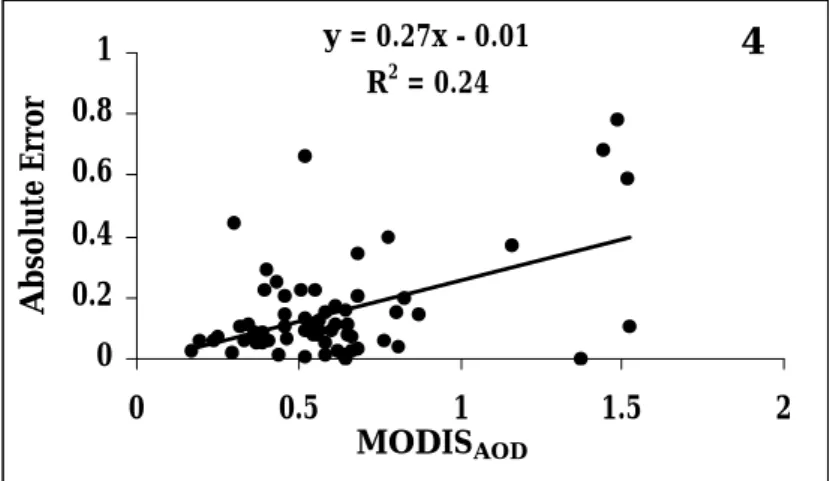
Fig. 4. Scatter plot of the absolute error in τaMODI Sretrievalvs τaMODI Sover Kanpur.τaAERON ET and statistically processed within an
opti-mum space-time window from which a scatter diagram of
τaMODI S vs. τaAERON ET has been produced during
non-dust loading (January–March and September–December) and dust-loading (April–July) periods (Figs. 3a and b). Lin-ear regression analysis was performed between the MODIS-retrieved AOD values and AERONET observations (Figs. 3a and b) in the form:
τaMODI S= A + B * τaAERON ET . (2)
Retrieval algorithm performance is validated from the re-sulting statistical parameters of the linear regression: A (in-tercept), B (slope) and R2(square of correlation coefficient). Here non zero intercepts (A=+0.12 and –0.63 during non-dust and non-dust loading periods, respectively) show that the re-trieval algorithm is biased at low AOD values, which may be associated with a sensor calibration error or an improper as-sumption about ground surface reflection (Zhao et al., 2002); in addition, large errors in surface reflectance lead to large intercepts (Chu et al., 2002). A slope that is different from unity indicates that there may be some inconsistency be-tween aerosol microphysical and optical properties used in the retrieval algorithm and that in the real situation (Zhao et al., 2002). Slope lower than unity (∼0.69) during the non-dust loading period (Fig. 3a) indicates an underestimation of AOD by MODIS with respect to AERONET retrieval, whereas a very high slope (∼2.46) during the dust load-ing period (Fig. 3b) indicates an overestimation of AOD by MODIS with respect to AERONET retrieval. The effect of the combination of slope and the intercepts on the correla-tion of MODIS and AERONET derived AOD in the scatter plots (Figs. 3a and b) is better represented in the frequency distributions (Fig. 3c). The histograms of the frequencies in the observed range of AOD have been compared between MODIS and AERONET retrievals for all the data points. The histograms are well matched (maximum difference of 2%) for AOD <0.75, whereas τaAERON ET is found to be higher
for AOD in the range of 0.75–1.25 compared to τaMODI S
(difference of ∼4%). However, for AOD >1.25, the differ-ence is found to be maximum (6%).
From our analysis, it is seen that the absolute error (magni-tude of error without considering the sign of error) is higher for higher AOD (Fig. 4), whereas the error in retrieving AOD from MODIS (1τa)is calculated as τaMODI S−τaAERON ET
with respect to AERONET retrieval. The absolute error in retrieval of τaMODI S shows a linear relationship with the τaMODI S, although the correlation is poor (0.24). The error in the intercept (∼–0.01) and the slope (∼0.27) is found to be about 25% in the retrieval of MODIS AOD. This is crucial in terms of quantification of the difference of MODIS AOD products with the ground-based measurements over Kanpur which is representative of the Ganga Basin.
The absolute difference between τaMODI S and τaAERON ET is found to be less than 0.2 during the
other months, whereas during May–July (prime time for the dust loading), the difference is abnormally high (>0.35). Over Kanpur, τaAERON ET is found to be the highest during
summer months (Dey et al., 2004; Singh et al., 2004) when the maximum absolute error in MODISAOD has been
found. MODIS is found to overestimate AOD values (1τa
is positive) during the pre-monsoon season. During the post-monsoon season, τaMODI Sand τaAERON ET are found
to show a good match. Although the correlation between
τaMODI S and τaAERON ET during the non-dust loading
pe-riod (R2=0.72) (Fig. 3a) and dust-loading period (R2=0.71) (Fig. 3b) are almost equal, the regression equations show an overestimation of MODIS AOD during the dust-loading period and an underestimation during the non-dust loading period with respect to AERONET. During the non-dust load-ing period, very few points (for τaAERON ET>1) are found
to lie outside the accuracy limit of MODIS (±0.05±0.2τa)
from the 1:1 line, whereas for the dust-loading period, the points representing AOD >0.8 lie outside the accuracy range from 1:1 line. The deviation is found to be higher for higher values of AOD during the dust-loading period. Ichoku et al. (2002) have shown that the correlation between
S. N. Tripathi et al.: Comparison of MODIS and AERONET derived aerosol optical depth over the Ganga Basin, India 1099
20
Figure 4
Figure 5
y = 0.27x - 0.01 R2 = 0.24 0 0.2 0.4 0.6 0.8 1 0 0.5 1 1.5 2 MODISAOD Absolute Error4
5
Fig. 5. Aerosol volume size distribution over Kanpur retrieved by AERONET during the winter, pre-monsoon, monsoon and post-monsoon
seasons and the annual average in 2004. Enhanced volume concentration at the coarse mode is evident during the pre-monsoon season, whereas the fine mode volume concentration is found to be similar to the annual average. In the other seasons, volume concentration of the coarse mode is far less compared to that in the pre-monsoon season.
Table 2. Optical properties in the year 2004 during the non-dust loading and dust-loading seasons over Kanpur retrieved by AERONET.
Optical property (0.55 µm) Non-dust loading period Dust-loading period (Mean ±Standard Deviation) (Mean ±Standard Deviation)
SSA 0.88 ±0.03 0.93 ±0.03
Real refractive index 1.46 ±0.08 1.53 ±0.07 Imaginary refractive index 0.012 ±0.005 0.003 ±0.001
AODMODI S and AODAERON ET is moderate over land
(R2∼0.73) compared to that over the ocean (R2=0.936). Not much improvement in correlation is found, when cloud-screened level 1.5 AOD data (R2=0.74) and level 1.0 unscreened AOD data (R2=0.75) of AERONET have been compared with MODIS derived AOD (not shown). The cloud-screening algorithm of the AERONET database does not set any criterion on the ˚Angstr¨om parameter, otherwise it would be difficult to detect unusual events (dust storms) using AERONET data (Smirnov et al., 2000).
The aerosol type considered in the MODIS algorithm for the Ganga Basin is smoke. Kanpur is a major industrial city and the aerosols are dominantly sulfates, nitrates and other industrial pollutants (Sharma et al., 2003). During the pre-monsoon and pre-monsoon seasons, dust is the main contributor to the observed AOD over Kanpur (Dey et al., 2004). During the pre-monsoon and monsoon seasons, aerosol size distri-bution shows more than 50% increase in the volume con-centration in the coarse mode compared to the yearly av-erage (Fig. 5), whereas during the post-monsoon and win-ter seasons, fine mode aerosols are found to be dominant.
The increase in the volume concentration at the accumu-lation mode during the winter season is due to the hygro-scopic growth of the ambient particles (Singh et al., 2004). The refractive indices (both real and imaginary parts at 0.55 µm wavelength) of the aerosols over Kanpur retrieved by AERONET in the year 2004 during the non-dust loading and dust-loading periods are given in Table 2. High real and low imaginary parts of the refractive index during the dust-loading period prove that in this region dust particles have a significant impact on the aerosol optical properties, which may cause uncertainties in the satellite retrieval. The uncer-tainty in the aerosol model has a greater impact at high AOD values (Chu et al., 2002). From the MODIS airborne simu-lator data acquired over Brazil, during the SCAR-B (Smoke Carbon Aerosol and Radiation-Brazil) it was found that the value of single scattering albedo (SSA) is very sensitive to the retrieved AOD (Chu et al., 1998). SSA over Kanpur has been found to be strongly wavelength dependant dur-ing the winter season and vary in the range 0.75 to 0.98 throughout the year (Singh et al., 2004), which makes the correct assumption of SSA more difficult. SSA at 0.55-µm
1100 S. N. Tripathi et al.: Comparison of MODIS and AERONET derived aerosol optical depth over the Ganga Basin, India wavelength over Kanpur is found to be 0.88±0.03 and 0.93
±0.03 (5.7 % higher) during the non-dust loading and dust-loading periods, respectively (Table 2). The dust particles are non-spherical, hence the phase function due to these par-ticles will be different from the phase functions considered for spherical particles. The SAFARI 2000 campaign dur-ing August–September 2000 in Southern Africa also shows strong dependence of uncertainty in AOD on SSA at high aerosol loading (Ichoku et al., 2003), where the discrepancy arises due to a higher SSA value (0.9) assumed for biomass burning aerosols compared to an SSA value of 0.86 measured by ground-based instruments.
During the summer months, the surface is dry because
ρs is high which may be a cause of the overestimation of AOD. The empirical relationships, ρs0.47 µm=0.25 ρ
2.1 µm
s
and ρs0.66 µm=0.5 ρs2.1 µm, established from series of
mea-surements, are used in the MODIS aerosol retrieval algo-rithm (Kaufman et al., 1997b,c), but this does not hold for all surface types. The ratio ρs0.66 µm:ρs2.1 µm varies from
slightly less than1/2for dense and dark vegetation, to slightly
more than1/2for situations involving vegetation mixed with
bright soils (Kaufman et al., 2002b). This aberration in the
ρs0.66 µm:ρ2.1 µms ratio can result in uncertainties in AOD
val-ues. Moreover, an error in order of magnitude of 0.006 in measuring the surface reflectance yields an error of ±0.06 in retrieval of AOD (Kaufman et al., 1997b). The presence of the dust particles in the atmosphere reduces the trans-parency of the atmosphere at the 2.1-µm wavelength. This means that the estimation of the surface reflectance is under-estimated; or in other words, the atmospheric contributions are overestimated, resulting in an overestimation of AOD. During pre-monsoon and monsoon seasons the dust events over the Ganga Basin (Dey et al., 2004) are very high, when maximum discrepancy has been observed between τaMODI S
and τaAERON ET. The dust storms are seasonal and continue
from April to August every year in the Ganga Basin. The regional air mass during the pre-monsoon season in northern India flows predominantly in a southwesterly direction which transports dust particles in the basin. The frequency of the in-tense dust events is found to be maximum during May–June which originates from the far distance Arabia peninsula and the Thar Desert (Fig. 1). These events are found to change the aerosol optical properties significantly (Dey et al., 2004). During the pre-monsoon season, even during the absence of dust events, the particle volume concentration at the coarse mode has been found to be significantly high (2–3 times) compared to the other seasons (Singh et al., 2004). The aver-age ˚Angstr¨om parameter during the dust-loading season in 2004 is found to be 0.36±0.26 and 1.15±0.36 during the non-dust season, which shows the dominance of coarse par-ticles.
The MODIS algorithm considers the aerosol type to be smoke over Kanpur; the SSA and the refractive indices mea-sured by AERONET during the post-monsoon and winter seasons are found to give good comparison. The main differ-ence in the retrieval of AOD from MODIS is attributed to the
presence of dust in the atmosphere when SSA is found to be very high (∼0.93), which could be due to the non-sphericity of the dust particles. Hence, the existing retrieval algorithm needs to be modified in view of the changing aerosol optical properties during the dust-loading periods.
6 Conclusions
Comparison between AOD derived from MODIS and AERONET over the Ganga Basin shows good comparison (average absolute difference is 0.12±0.11) during the post-monsoon and winter seasons (September–March) when dust loading is not present. During the pmonsoon, the re-gion suffers from dust loading due to the southwesterly winds; the average absolute difference between τaMODI S
and τaAERON ET is found to be quite high (0.4±0.2) with
the absolute error of τaMODI S about ∼25% of the absolute τaMODI S values. The difference in model and the real value
of SSA, and the real and imaginary parts of the refractive indices due to the dominance of the non-spherical dust parti-cles, is likely to be the main reason for the observed discrep-ancy. Our analysis shows the need for modification of the existing MODIS algorithm over the Ganga Basin, especially during the dust loading period.
Acknowledgements. We are thankful to DAAC NASA team for
pro-viding us MODIS data to carry out the research. The work is sup-ported through financial support from ICRP-Department of Science and Technology, New Delhi and ISRO-GBP program. We are also thankful to the anonymous referees for their valuable comments that have helped us to improve the original version of the manuscript.
Topical Editor O. Boucher thanks Y. Kaufman and another ref-eree for their help in evaluating this paper.
References
Andreae, M. O.: Climatic effects of changing atmospheric aerosol levels, in: World Survey of Climatology, edited by: Henderson-Sellers, A., , Vol. 16, Future Climates of the World. Elsevier, Amsterdam, 341–392, 1995.
Boucher, O. and Tanr´e, D.: Estimation of the aerosol perturbation to the Earth’s radiative budget over oceans using POLDER satellite aerosol retrievals, Geophys. Res. Lett., 27(8), 1103–1106, 2000. Boucher, O. and Haywood, J.: On summing the components of radiative forcing of climate change, Clim. Dyn., 18, 297–302, 2001.
Charlson, R. J., Schwartz, S. E., Hales, J. M., Cess, R. D., Coakley Jr., J. A., Hansen, J. E., and Hofmann, D. J.: Climate forcing by anthropogenic aerosol, Science, 255, 423–430, 1992.
Chu, D. A., Kaufman, Y. J., Remer, L. A., and Holben, B. N.: Re-mote sensing of smoke from MODIS airborne simulator during the SCAR-B experiment, J. Geophys. Res., 103, 31 979–31 987, 1998.
Chu, D. A., Kaufman, Y. J., Ichoku, C., Remer, L. A., Tanr´e, D., and Holben, B. N.: Validation of MODIS aerosol optical depth retrieval over land, Geophys. Res. Lett., 29(12), MOD2, 1–4, 2002.
Deuz´e J. L., Goloub, P., Herman, M., Marchand, A., Perry, G., Su-sana, S., and Tanr´e, D.: Estimate of the aerosol properties over
S. N. Tripathi et al.: Comparison of MODIS and AERONET derived aerosol optical depth over the Ganga Basin, India 1101 the ocean with POLDER on ADEOS-1, J. Geophys. Res., 105
(D12), 15 32–15 346, 2000.
Dey, S., Tripathi, S. N., Singh, R. P., and Holben, B. N.: Influence of dust stroms on aerosol optical properties over the Indo-Gangetic basin, J. Geophys. Res., 109, doi:10.1029/2004JD004924, 2004. Goloub, P., Deuze, J. L., Herman, M., Tanr´e, D., Chiapello, I., Roger, B., and Singh, R. P.: Aerosol remote sensing over land using the spaceborne polarimeter POLDER, in: Current prob-lems in Atmospheric Radiation, edited by: Smith, W. L. and Timofeyev, Yu. M., A. Deepak Publishing, Hampton, Virginia, 113–116, 2001.
Gonzalez L., and Deroo, C.: HDFLook/HDFLook MODIS Hand-book, http://www-loa.univ-lille1.fr/Hdflook/E HDF.html, 2003. Hansen, J., Sato, M., and Ruedy, R.: Radiative forcing and climate
response, J. Geophys. Res., 102, 6831–6864. 1997.
Haywood, J. and Boucher, O.: Estimates of the direct and indi-rect radiative forcing due to tropospheric aerosols: a review, Rev. Geophys., 38(4), 513–543, 2000.
Herman, J. R., Bhartia, P. K., Torres, O., Hsu, C., Seftor, C., and Celarier, E.: Global distribution of UV-absorbing aerosol from Nimbus-7/TOMS data, J.Geophys. Res., 102, 16 911–16 922, 1997.
Holben, B. N., Setzer, A., Eck, T. F., Pereira, A., and Slutsker, I.: Effect of dry-season biomass burning on Amazon basin aerosol concentrations and optical properties, 1992–1994, J. Geophys. Res., 101(D14), 19 465–19 482, 1996.
Holben, B. N., Eck, T. F., Slutsker, I., Tanr´e, D., Buis, J. P., Set-zer, A., Vermote, E., Reagan, J. A., Kaufman, Y. J., Nakajima, T., Lavenu, F., Jankowiak, I., and Smirnov, A.: AERONET – A federated instrument network and data archive for aerosol char-acterization, Remote Sensing of Environment, 66, 1–16, 1998. Hsu, N. C., Herman, J. R., Bhartia, P. K., Seftor, C. J., Torres, O.,
Thompson, A. M., Gleason, J. F., Eck, T. F., and Holben, B. N.: Detection of biomass burning smoke from TOMS measurements, Geophys. Res. Lett., 23, 745–748, 1996.
Ichoku, C., Chu, D. A., Mattoo, S., Kaufman, Y. J., Remer, L. A., Tanr´e, D., Slutsker, I., and Holben, B. N.: A spatio-temporal approach for global validation and analysis of MODIS aerosol products, Geophys. Res. Lett., 29(12), Art. No. 1616, 1–4, 2002. Ichoku, C., Remer, L. A., Kaufman, Y. J., Levy, R., Chu, D. A., Tanr´e, D., and Holben, B. N.: MODIS observation of aerosols and estimation of aerosol radiative forcing over south-ern Africa during SAFARI 2000, J. Geophys. Res., 108(D13), doi:10.1029/2002JD002366, 2003.
Kaufman Y. J.: Measurements of the aerosol optical thickness and the path radiance implications on aerosol remote sensing and at-mospheric corrections, J. Geophys. Res., 98, 2677–2692, 1993. Kaufman, Y. J., Gitelson, A., Karnieli, A., Ganor, E., Fraser, R. S.,
Nakajima, T., Mattoo, S., and Holben, B. N.: Size distribution and scattering phase function of aerosol particles retrieved from sky brightness measurements, J. Geophys. Res., 99(D5), 10 341– 10 356, 1994.
Kaufman, Y. J., Tanr´e, D., Gordon, H. R., Nakajima, T., Lenoble, J., Frouin, R., Grassl, H., Herman, B. M., King, M. D., and Teillet, P. M.: Passive remote sensing of tropospheric aerosol and atmo-spheric correction for the aerosol effect, J. Geophys. Res., 102, 16 815–16 830, 1997a.
Kaufman, Y. J., Tanr´e, D., Remer, L. A., Vermote, E. F., Chu, A., and Holben, B. N.: Operational remote sensing of tropospheric aerosol over land from EOS moderate resolution imaging spec-troradiometer, J. Geophys. Res., 102, 17 051–17 068, 1997b.
Kaufman, Y. J., Wald, A. E., Remer, L. A., Gao, B-C., Li, R-R., and Flynn, L.: The MODIS 2.1-µm channel- correlation with visible reflectance for use in remote sensing of aerosol, IEEE Trans. Geosci. Rem. Sens., 35(5), 1286–1298, 1997c.
Kaufman, Y. J., Tanr´e, D., and Boucher, O.: A satellite view of aerosols in climate system, Nature, 419, 215–223, 2002a. Kaufman Y. J., Gobron, N., Pinty, B., Widlowski, J., and Verstraete,
M. M.: Relationship between surface reflectance in the visible and mid-IR used in MODIS aerosol algorithm– theory, Geophys. Res. Lett., 29(23), doi:10.1029/2001GL014492, 2002b. King, M. D., Kaufman, Y. J., Tanr´e, D., and Nakajima, T.: Remote
Sensing of Tropospheric Aerosols from Space: Past, Present, and Future, Bull. Am. Meteorol. Soc., 80, 2229–2259, 1999. King, M. D., Menzel, W. P., Kaufman, Y. J., Tanr´e, D., Gao, B.
C., Platnick, S., Ackerman, S. A., Remer, L. A., Pincus, R., and Hubanks, P. A.: Cloud and Aerosol Properties, Precipitable Water, and Profiles of Temperature and Humidity from MODIS, IEEE Trans. Geosci. Rem. Sens., 41, 442–458, 2003.
Krishna Moorthy, K., Niranjan, K., Narasimhamurthy, B., Agashe, V. V., and Krishna Murthy, B. V.: ISRO-GBP Scientific Report 03-99, Space Physics Laboratory, Vikram Sarabhai Space Cen-ter, Trivendrum, 1999.
Penner, J. E., Dickinson, R. E., and O’Neill, C. A.: Effects of aerosols from biomass burning on the global radiation budget, Science, 256, 1432–1434, 1992.
Remer, L. A., Tanr´e, D., Kaufman, Y. J., Ichoku, C., Mattoo, S., Levy, R., Chu, D. A., Holben, B. N., Dubovik, O., Smirnov, A., Martins, J. V., Li, R. R., and Ahmad, Z.: Validation of MODIS aerosol retrieval over ocean, Geophys. Res. Lett., 29, doi:10.1029/2001GL013204, 2002.
Satheesh, S. K. and Ramanathan, V.: Large differences in tropical aerosol forcing at the top of the atmosphere and Earth’s surface, Nature, 405, 60–63, 2000.
Sharma, M., Kiran, Y. N. V. M., and Shandilya, K. K.: Investi-gations into formation of atmospheric sulfate under high PM10 concentration, Atmos. Environ., 37, 2005–2013, 2003.
Singh, R. P., Dey, S., Tripathi, S. N., Tare, V., and Holben, B. N.: Variability of aerosol parameters over Kanpur city, northern In-dia, J. Geophys. Res., doi:10.1029/2004JD004966, 2004. Smirnov, A., Holben, B. N., Eck, T. F., Dubovik, O., and Slutsker,
I.: Cloud-screening and quality control algorithms for the AERONET database, Remote Sensing of Environment, 73, 337– 349, 2000.
Tanr´e, D., Kaufman, Y. J., Herman, M., and Mattoo, S.: Remote sensing of aerosol properties over oceans using the MODIS/EOS spectral radiances, J. Geophys. Res., 102, 16 971–16 988, 1997. Tegen, I., Lacis, A. A., and Fung, I.: The influence on climate
forc-ing of mineral aerosols from disturbed soils, Nature, 380, 419– 422, 1996.
Vinoj, V., Babu, S. S., Satheesh, S. K., Moorthy, K. K., and Kaufman, Y. J.: Radiative forcing by aerosols over the Bay of Bengal region derived from shipborne, island-based and satel-lite (Moderate Imaging Spectroradiometer) observations, J. Geo-phys. Res., 109, doi:10.1029/2003JD004329, 2004.
Zhao, T. X.-P., Stowe, L. L., Smirnov, A., Corsby, D., Sapper, J., and McClain, C. R.: Development of a global validation package for satellite oceanic aerosol optical thickness retrieval based on AERONET observations and its application to NOAA/NESDIS operational aerosol retrievals, J. Atmos. Sci., 59, 294–312, 2002.