HAL Id: hal-02354931
https://hal.archives-ouvertes.fr/hal-02354931
Submitted on 8 Nov 2019
HAL is a multi-disciplinary open access
archive for the deposit and dissemination of
sci-entific research documents, whether they are
pub-lished or not. The documents may come from
teaching and research institutions in France or
abroad, or from public or private research centers.
L’archive ouverte pluridisciplinaire HAL, est
destinée au dépôt et à la diffusion de documents
scientifiques de niveau recherche, publiés ou non,
émanant des établissements d’enseignement et de
recherche français ou étrangers, des laboratoires
publics ou privés.
over Gobabeb, Namibia
Joseph A. Adesina, Stuart J. Piketh, Paola Formenti, G. Maggs-Kölling,
Brent N. Holben, And Mikhail G. Sorokin
To cite this version:
Joseph A. Adesina, Stuart J. Piketh, Paola Formenti, G. Maggs-Kölling, Brent N. Holben, et al..
Aerosol optical properties and direct radiative effect over Gobabeb, Namibia. The Clean Air Journal,
2019, �10.17159/caj/2019/29/2.7518�. �hal-02354931�
Aerosol optical properties and direct radiative effect
over Gobabeb, Namibia
Introduction
Atmospheric aerosol studies over the past years have yielded progress in unraveling their impacts on health and the climate system. These advances have been driven by extensive ground-based measurement networks, in situ-measurements during field campaigns, satellite-based instrument observations around the globe and finally modeling efforts that integrate and synthesize current scientific understanding. Their optical,
radiative and microphysical properties are as a result, not totally as evasive as they used to be in previous years. The uncertainties of these properties are mostly due to the spatial and temporal variability of aerosol emissions, loading, transport and the diversity of the mechanisms of transformation and formation in the atmosphere (Stocker et al., 2013).
There have been more than four decades of observation
Abstract
Atmospheric aerosols contribute significantly to the uncertainty in radiative forcing effects that influence the climate as well as posing a significant health risk to humans. The climatic implications of aerosols are dependent on many variables, including aerosol size, shape, chemical composition, and position in the atmospheric column. The radiative impact of aerosols transported over the west coast of southern Africa has been found, in particular, to be complicated by the aforementioned aerosol properties. This study investigated the columnar optical properties of aerosols over Gobabeb, Namibia (23.5621° S, 15.0409° E, 405 m asl) using sunphotometer data between December 2014 and November 2015. Aerosol mean optical depth AOD500 had its maximum and minimum values in 2015 August (0.37±0.30) and June (0.06±0.02), respectively. The Angström parameter was mostly above unity during the study period and indicated the prevalence of fine particles for the most part of the year with maximum and minimum values observed in August 2015 (1.44±0.19) and December 2014 (0.57±0.19), respectively. The columnar water vapor was highest in January (2.62±0.79) and lowest in June (0.76±0.27). The volume size distribution showed the fine particles having a mean radius of about 0.16 µm and the coarse mode had variation in sizes with a radius ranging between 3 µm and 7 µm. The single scattering albedo at visible wavelengths ranged between 0.83 and 0.91. The phase function was high at small angles but minimum at about 140° in all seasons. The radiative forcing showed a heating effect in all seasons with maximum and minimum in winter (9.41 Wm-2) and autumn (3.64 Wm-2), respectively.
Intercomparison of the sunphotometer data with the Moderate Resolution Imaging Spectroradiometer (MODIS) showed that the satellite sensor overestimates the aerosol loading compared to the ground-based sunphotometer measurements. Both sets of observations were better correlated during the spring and winter seasons than for the summer and autumn.
Keywords
Aerosol Optical Depth, Volume Size Distribution, Radiative Forcing, Single Scattering Albedo, MODIS
Joseph .A. Adesina
*1, Stuart J. Piketh
1, Paola Formenti
2, G. Maggs-Kölling
3,
Brent N. Holben
4, and Mikhail G. Sorokin
51School of Geo- and Spatial Science, Unit for Env. Sc. and Management, North-West University, Potchefstroom 2Laboratoire Interuniversitaire des Systèmes Atmosphériques, UMR-CNRS 7583, Universités Paris-Est- Créteil and
Paris Diderot, Institut Pierre Simon Laplace, Créteil, France
3Gobabeb Research and Training Centre, Walvis Bay, Namibia
4Laboratory for Terrestrial Physics, NASA Goddard Space Flight Center, Greenbelt, MD 5Science Systems and applications Inc. NASA Goddard Space Flight Center, Greenbelt, MD
*Email: [email protected]
Received: 15 February 2019 - Reviewed: 17 July 2019 - Accepted: 17 Sept 2019
and measurements of aerosols in southern Africa and their seasonality has been established (Chester et al., 1972; Diner et al., 2001; Laakso et al., 2012; Losno et al., 1992). Studies showed that much of the aerosols produced in southern Africa are being transported over the Atlantic through the south-west coast (Swap et al., 1996). While the aerosol concentration transported is very low during the transition from summer to autumn, the concentration escalates dramatically as the season goes from winter to spring (Losno et al., 1992). The sudden rise in aerosol concentration has been attributed to biomass burning, industrial emission, and aeolian erosion (Piketh et al., 1999; Swap et al., 1996). The period between July and September has the highest recorded occurrence of open biomass burning (Eck et al., 2013; Vakkari et al., 2018).
The complex interactions of the coastal stratocumulus cloud deck off Namibia and Angola are thought to have a potentially important radiative, biogeochemical and hydrological impact on the local, regional and global climate (Hegg et al., 2012; Platnick et al., 2001; Zhou et al., 2017). Several large-scale regional and land-atmosphere experiments conducted in the southern African region over the past decades, including the Transport and Atmospheric Chemistry near the Equator-Atlantic (TRACE-A); the Southern African Fire-Atmosphere Research Initiative (SAFARI-92) and the Southern African Atmospheric Research Initiative SAFARI-2000 have shown that: a) Southern Africa is an important region of the world in terms of global emissions to the atmosphere and a good natural laboratory to evaluate the earth, land and ocean-atmosphere interactions, and b) critical gaps remain in our understanding of the fate and impacts of the emissions on the functioning of the regional land-atmosphere-ocean systems. To partially fill these gaps, the international Sea-Earth-Air Linkages in southern Africa (SEALS-sA) program has recently been initiated in order to promote coordinated field experiments and long-term monitoring along the west coast of southern Africa. In this framework, the Gobabeb Research and Training Centre hosts an ongoing research program consisting of the long-term measurements of meteorological parameters, aerosols, and fog. In this paper, we discuss the preliminary results of observations of the columnar aerosol optical properties provided by the Aerosol Robotic Network (AERONET) sunphotometer located at the station and compared with satellite remote sensing observations from MODIS.
Site and instrumentation
Site
Gobabeb Research and Training Centre (Gobabeb; 23.5621° S, 15.0409° E, 405 m above sea level; https://deims.org/182ac129-f0b8-4808-9842-0c7c841802cc (accessed Aug 14, 2019)) is located in the Namib Desert on the southwestern African coast. This desert stretches nearly 2000 km from South Africa to Namibia and extends to Angola. Gobabeb is located along the ephemeral Kuiseb River, with gravel plains to the north and sand dunes to the south. Precipitation is mainly in the summer
and autumn months (December to May) with an average annual precipitation of 10 mm and a temperature of 21° C (Eckardt et al., 2013). Although the site is 70 km from the coast it is still influenced by cold coastal air from over the Benguela current. Consequently, clouds and fog are a fairly common occurrence at Gobabeb (average of 115 fog days/annum; SASSCAL, 2019). Precipitation over this region is triggered directly and indirectly by large circulation systems including easterly waves associated with tropical temperate troughs, the west coast low-pressure system, westerly temperate cold fronts and associated coastal low-pressure system and finally cut-off lows that develop over the subcontinent (Eckardt et al., 2013; Tyson and Preston-Whyte, 2000).
Instrumentation
Sunphotometer
The sun/sky photometer (CE-318 CIMEL Inc, Paris, France) is a radiometer capable of taking both direct sun and diffuse sky measurements (Holben et al., 1998). The instrument keeps track of the sun with the sensor head being within approximately 1° of the sun. The instrument takes direct sun measurements at eight spectral channels of 340, 380, 440, 500, 675, 870, 940 and 1020 nm with the 940 nm band used to measure columnar water vapor approximately every 15 minutes throughout the day. The diffuse radiance measurements in the solar almucantar or principal plane are taken at four spectral bands 440, 675, 870 and 1020 nm in the mornings and afternoon mostly at low solar elevation. From these measurements, the single scattering albedo (SSA), refractive index, volume size distribution, etc. are retrieved using an inversion algorithm. More details regarding the error estimation, uncertainties, and calibration protocols have been presented elsewhere (Dubovik et al., 2002; Dubovik and King, 2000).
Measurements are transmitted through the METEOSAT geostationary satellite being received and monitored from NASA Goddard Space Flight Center in the USA. AERONET observations are available at three levels; level 1.0 corresponding to raw data, level 1.5 corresponding to cloud-screened observations and level 2.0 corresponding to quality-assured data to which recent calibration has been applied. The uncertainty for AOD retrieval under cloud screened condition for wavelengths greater than 440 nm is < ± 0.01 and for shorter wavelengths < ± 0.02 or less than ± 5% uncertainty in the retrieval of the sky radiance measurements. Errors of retrieving particles in the size range (0.1 ≤ r ≤ 7µm) do not exceed 10% except for very small sizes less than 0.1 µm and higher than 7 µm. SSA has an uncertainty of about 0.03 – 0.05 depending on aerosol loading and aerosol types. Real and imaginary parts of the refractive index have uncertainties of about 0.3 – 0.5 and ± 0.04, respectively (Alam et al., 2012; Dubovik et al., 2002). In this paper, we present a preliminary analysis using level 2.0 for the direct sun measurement and level 1.5 for the inversion products for December 2014 to November 2015 due to scanty data for the inversion product. The problem of scanty data for inversion products in places of lower aerosol optical depth was studied in detail by Li et al. (2014) from 44
AERONET centers who then proposed some further screening to the level 1.5 that was adopted in this paper.
MODIS
MODIS has spatial resolutions of 250, 500 and 1000m with 36 spectral channels spanning 415 to 14235 nm capable of measuring radiances at the top of the atmosphere (TOA). It possesses two separate sensors employed in earth observation (King et al., 2003; Kumar et al., 2015). The two sensors Terra (1999) and Aqua (2002) orbit the earth crossing the equator at 10:30 Local Solar Time providing information about aerosols over land and ocean (Kaufman et al., 1997). The special algorithm involved in the retrieval of aerosol data is different for both land and ocean with accuracy over land lower than that of over the ocean (Levy et al., 2007; Remer et al., 2005; Sreekanth and Kulkarni, 2013; Tanré et al., 1997). The instrument with its cloud mask performs above twenty tests that incorporate
cirrus detection tests to denote clear or cloudy pixels at a 1 x 1 km resolution. To enhance accuracy, pixels of surface reflectance greater than 0.15 are not considered (Chung et al., 2002; Kumar et al., 2015). For the present study, MODIS Terra (MOD08_D3) level 3 daily data were downloaded from https:// giovanni.gsfc.nasa.gov/ (accessed October 5, 2017) and the data compared with that of AERONET. This dataset incorporates the aerosol models and polarization information for calculating the radiative transfer introduced by Remer et al. (2008). Ichoku et al. (2003) had earlier shown that MODIS can effectively monitor different types of aerosols. This ability to monitor was not just that of global but even regional. They carried out the validation of MODIS using AERONET during the SAFARI 2000 since southern Africa was dominated by smoke aerosols which stem from biomass burning particularly during August-September months. Here we did not limit our data to just these two months but we have extended this to a whole year.
Result and discussion
Major causes of variability in aerosol properties and air pollutant concentrations in southern Africa were extensively discussed by Laakso et al. (2012). The major causes were natural, anthropogenic and meteorological conditions existing in the region. During the winter and spring (June-November). there are common occurrences of wildfires in these months, this leads to a significant increase in the aerosol loading. In addition to these, there is lower boundary layer causing decrease in the mixing height and thereby aiding re-circulation of aerosols. Also there are higher industrial activities (electricity consumption becomes higher) and widespread domestic space heating. Whereas during the summer and autumn (December-May) months, mixing heights are higher, weather favoring advection of pollutants and precipitation during these seasons also causes wet deposition thereby leading to lower pollutant concentrations.
Monthly variability of AOD
500, α440-870, CWV
Monthly variability of aerosol optical depth at 500 nm (AOD500), Angström exponent (α440-870) and columnar water vapor (CWV)
at Gobabeb are shown in (Figure 1). The boxplot for each month revealed the median, the first and the third quartiles and cases of outliers. This helped to have a good representation of the measure of the central tendency of each month. AOD500 measured at Gobabeb had the highest loadings recorded between August and October 2015. This is consistent with previous measurements undertaken over the subcontinent in the past decades (Eck et al., 2003b; 2003a; Queface et al., 2011). The subcontinent experiences open biomass burning emissions during this period. The burning season injects a significant pulse of aerosols into the atmosphere that is transported across the entire region (Adesina et al., 2015; Eck et al., 2003a; Hersey et al., 2015; Kumar et al., 2013). The boxplot also indicated that the daily variability of aerosol optical depth within the month was moderate from December 2014 to July 2015 and afterward the daily variation became high from August to October 2015 due to the influence of open biomass burning that can be natural
Figure 1: (a) Aerosol optical depth at 500 nm, (b) Angström parameter at
440-870 wavelength and (c) Columnar water vapor content. The red line shows the median value of each month, the red crosses are the outliers, the vertical hinges represent data points from the lower to the upper quartile (i.e., 25th and 75th percentiles) and the whiskers represent data
points from the 5th to 95th percentiles for the period December 2014 to
or anthropogenic (Vakkari et al., 2018). There were few outliers during some of the months of low AOD500 that may be as a result of a meteorological effect, as discussed by Eckardt et al. (2013). The α440-870 is a qualitative factor determining aerosol size.
It can be used to determine the relative abundance of the accumulation to the coarse mode. Higher values represent the dominance of the accumulation mode and vice versa (Alam et al., 2012). Unlike the AOD500 it has greater daily variability almost every month of the year. Apart from a few months, i.e. January, February, November and December, Gobabeb experienced high values of α440-870. Pawar et al. (2015) associated high α440-870
with corresponding low AOD500 with the continental average type of aerosols. This is what seems to be prevalent between March and July. The CWV also showed high variability especially during the first quarter of the year. The sea surface temperature affects the moisture content of the atmosphere in this region. Factors such as El Niño Southern Oscillation, Benguela upwelling and the influence of the western Indian Ocean all contribute to this variability (Eckardt et al., 2013).
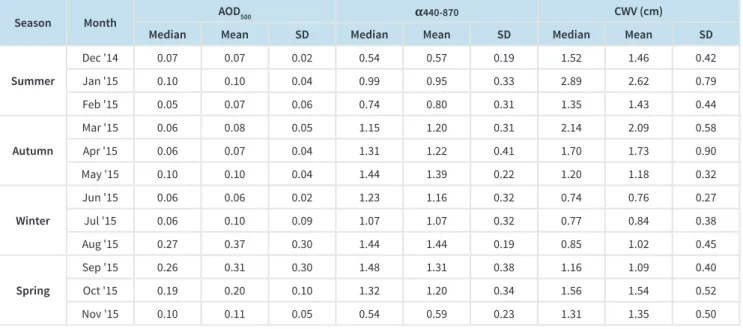
Table 1 gives the summary statistics of the aerosol properties. Where there are high standard deviations, the mean and the mode show a noticeable difference. The mean AOD500 (with the standard deviation) was highest in 2015 August with a value of 0.37±0.30 and lowest in June with a value of 0.06±0.02. September and October also had high values of 0.31±0.30 and 0.20±0.10, respectively. α440-870 value had a maximum of 1.44±0.19 in
August 2015 and a minimum of 0.57±0.19 in December 2014. It had values greater than 1.0 from March to October 2015. The high values show the prevalence of accumulation mode during this period. The Namib Desert, in general, receives little rainfall throughout the year, with an annual average of 25 mm (Eckardt et al., 2013). There was a relatively high amount of water vapor present in the atmosphere at the beginning of the year with the
maximum in January 2015 having a value of 2.62±0.79 (cm) and a minimum of 0.76±0.27 (cm) in June. Winter months receive less rainfall than other months of the year at Gobabeb (Eckardt et al., 2013). The seasonal correlation coefficients between AOD500 and CWV (not shown) were 0.58, 0.50, 0.55 and 0.62 for summer, autumn, winter, and spring, respectively and the p-value in each case was < 0.0001. Though the correlation coefficient was not very high, it is statistically significant at a 95% confidence level.
Seasonal variability of the aerosol
volume size distribution
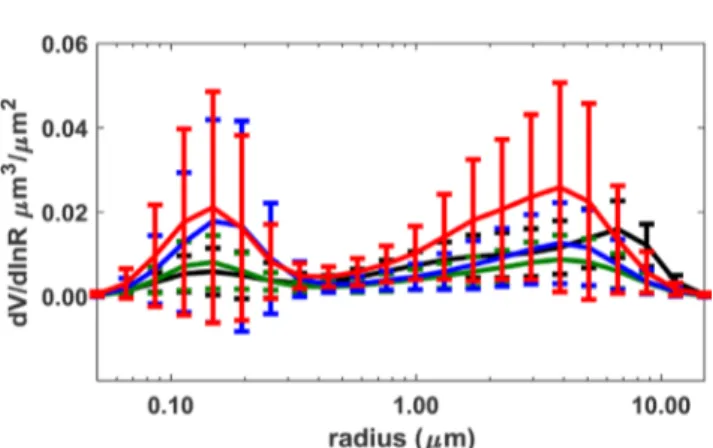
The volume size distribution (VSD) presented in Figure 2 accounted for the mixture of different types of aerosols present and advected into a location that is conditioned by scavenging processes and meteorological influences (Ali et al., 2014). In the AERONET retrievals, the volume size distribution is represented in a lognormal form as
(1) Where Ci is the particle volume concentration, Ri is the median or geometric mean radius, σi is the variance or width
of each mode, r is the particle radius, and n is the number of lognormal aerosol modes. In Figure 2 the VSD shows a bimodal lognormal distribution that varies according to seasons, i.e. summer (DJF), autumn (MAM), winter (JJA) and spring (SON). This distribution shows the ratio of the volume of the coarse and the accumulation particles present in each season. The spectral dependence and amplitude of the optical depth are normally responsible for the variations in the two modes (Bi et al., 2011). There were no significant changes in the size of the accumulation mode throughout the seasons as the radius centered around 0.16 µm. The volume in this mode was higher
Table 1: The monthly summary of the mean, mode and standard deviation (SD) of the AOD500, α440-870, and CWV at Gobabeb between December 2014 and
November 2015.
Season Month AOD500 α440-870 CWV (cm)
Median Mean SD Median Mean SD Median Mean SD
Summer Dec '14 0.07 0.07 0.02 0.54 0.57 0.19 1.52 1.46 0.42 Jan '15 0.10 0.10 0.04 0.99 0.95 0.33 2.89 2.62 0.79 Feb '15 0.05 0.07 0.06 0.74 0.80 0.31 1.35 1.43 0.44 Autumn Mar '15 0.06 0.08 0.05 1.15 1.20 0.31 2.14 2.09 0.58 Apr '15 0.06 0.07 0.04 1.31 1.22 0.41 1.70 1.73 0.90 May '15 0.10 0.10 0.04 1.44 1.39 0.22 1.20 1.18 0.32 Winter Jun '15 0.06 0.06 0.02 1.23 1.16 0.32 0.74 0.76 0.27 Jul '15 0.06 0.10 0.09 1.07 1.07 0.32 0.77 0.84 0.38 Aug '15 0.27 0.37 0.30 1.44 1.44 0.19 0.85 1.02 0.45 Spring Sep '15 0.26 0.31 0.30 1.48 1.31 0.38 1.16 1.09 0.40 Oct '15 0.19 0.20 0.10 1.32 1.20 0.34 1.56 1.54 0.52 Nov '15 0.10 0.11 0.05 0.54 0.59 0.23 1.31 1.35 0.50
for winter and spring and lower during summer and autumn. Spring had the highest volume concentration in both the accumulation and coarse modes. The size of the coarse particles had a noticeable variation with a radius ranging from 4 to 7 µm. The coarse particle distribution is lower in winter but slightly higher in summer when compared to accumulation mode. There seemed to be no difference in the distribution of both modes during autumn.
Seasonal variability of single scattering
albedo
The single scattering albedo (SSA) is an important property in understanding aerosol radiative forcing and relates the ratio of scattering to the extinction coefficient. It depends on the aerosol refractive index (that is on the composition) as well as the volume size distribution of the aerosol (Dubovik and King, 2000). SSA presents a distinct spectral behavior depending on the type of aerosol; increase with wavelength will indicate that aerosols absorb more in the UV part of the spectrum. Such aerosols are large in size representing UV-absorbing compounds such as iron oxides from desert dust while a decrease with wavelength is mostly characteristic of fine aerosols that absorb at longer wavelengths. Such small size particles are associated with black carbon from biomass or urban/industrial aerosol (Dubovik et al., 2002). The seasonal plot of the SSA is shown in Figure 3. In summer, there is a slight increase from the shorter to the longer wavelengths (values of 0.881, 0.883, 0.885 and 0.890 at (440, 675, 870 and 1020) nm, respectively). This indicates that a particle of larger sizes predominates during this season. These particles can be of the desert origin or formed from the hygroscopic growth of aerosols in the atmosphere.
The columnar water vapor content is high during this season especially as seen in January (Figure 1) and so can favor this growth. In autumn, the SSA decreased from 0.914 to 0.905 and 0.906 and later increased to 0.910 at the aforementioned wavelengths. This implies that the season is not particularly dominated by either fine or coarse particles as aerosols of different sizes make a comparable contribution to the columnar aerosol loading. In winter, the spectral line has a constant decrease with wavelength, it means a higher absorption at a longer wavelength. This relates more to the predominance of
biomass or urban/industrial aerosols with values of 0.837, 0.823, 0.808 and 0.799, respectively. Just like in the winter the spectral line in spring first increased in the lower but later decreased in the longer wavelength having values of 0.871, 0.878, 0.872 and 0.870, respectively.
Previous research found that the effect of the biomass season in southern Africa is more pronounced during the spring season than in the winter (Chiloane et al., 2017) and for Gobabeb this seems to be the same. The combined seasonal effect on SSA, is more pronounced in winter than spring. The effect started from mid-winter in July, culminating in a maximum in August and September, with October and November having a negligible effect. The combined seasonal effect, therefore, is more pronounced in winter than spring.
Figure 2: AERONET retrieved mean volume size distribution in different
seasons along with the standard deviations Figure 3: Seasonal AERONET mean retrieved single scattering albedo at four different wavelengths along with the standard deviations
Figure 4: Seasonal AERONET mean retrieved refractive index (a) real (b)
Ichoku et al. (2003) recorded 0.88 and 0.84 at visible wavelengths (440 – 675 nm) as the range of SSA in southern Africa, while Queface et al. (2011) showed that at Skukuza it is between 0.91 and 0.89 and for Mongu 0.87 and 0.83, respectively. For Gobabeb, it ranged between 0.88 and 0.87.
Seasonal variability of refractive Index
The refractive index is made of the real part (RR) and the imaginary part (RI). It reflects the ability of aerosols to scatter and absorb incoming radiation. The complex refractive indices for aerosol particles depend on the chemical composition. High values of the RR indicate scattering while high values of the RI indicate absorption. In Figure 4, the seasonal RR and RI for Gobabeb is shown. Comparing the RR and the RI, it can be observed that the RI exhibits larger dependence than the RR. The RR ranges between 1.47 and 1.49 in the shortest wavelength for all seasons but the RI show higher absorption for winter (0.027) followed by the spring (0.016). The high absorption during these seasons may be attributed to the influence of veld fires and open biomass burning.
Seasonal variability of the phase function
Phase function relates to the intensity and angular distribution of the scattering of the incident stream of light by the particles. It is influenced by the internal structure, size distribution, shape of particles and the refractive index (Bi et al., 2011; Bibi et al., 2016). The scattering angle depends on the non-sphericity of the particles. The phase function (Figure 5) is maximum at small angles for all seasons. The minimum value of the phase function occurs at 140° (see Figure 5b), while it is maximum at 0°. More backscatter occurs during the autumn
and the summer that shows the predominance of coarse particles during those seasons. Climate forcing estimation and resolution of atmospheric correction problems are linked with phase functions at angles greater than 90° (Bibi et al., 2016; Kokhanovsky, 1998).
Aerosol radiative forcing
Aerosol radiative forcing is defined as the difference between the downward TOA and the upward (surface) fluxes of the short wave radiation with and without aerosols. This quantity is made available through the AERONET inversion code (calculated in the solar spectrum (0.2 – 4.0 µm)) and the assumptions used in calculating it has been extensively discussed in earlier works (Dubovik and King, 2000; Dubovik et al., 2006; García et al., 2011). Earlier works showed that there is a good correlation between SBDART (Ricchiazzi et al., 1998), a software package usually employed in calculating aerosol radiative forcing and AERONET (Adesina et al., 2014; Alam et al., 2012; Ali et al., 2014). García et al. (2011) further suggested that the value recorded for the surface forcing by AERONET is overestimated and needed to be corrected by (1-SA) where SA is the surface albedo. In this paper, we have employed this method to make a correction to the surface forcing. Table 2 shows the seasonal radiative forcing over Gobabeb. The radiative forcing at the surface ranges from –6.46 Wm-2 in autumn to –4.00 Wm-2 in winter. The TOA ranges
from –0.87 Wm-2 in spring to 2.95 Wm-2 winter. The resultant
effect on the atmosphere was minimum in autumn with a value of 3.64 Wm-2 and 9.41 Wm-2 in winter being maximum. The
resultant is a warming effect throughout all the seasons.
Intercomparison of MODIS AOD and
AERONET AOD
Apart from establishing a long term database for climatological studies, intercomparison of satellite sensors with ground-based instruments can aid the improvement of coverage and accuracy deficiency involved in the use of a single sensor (Adesina et al., 2016; Alam et al., 2012; Kang et al., 2016). The datasets from MODIS (Dark target product) that matched the AERONET data for the period under consideration was used. Since both sensors retrieve at different wavelengths, i.e. 550 nm for MODIS and 500 nm for AERONET, both AODs were interpolated to a common wavelength (550 nm) using the power law
(2)
Figure 5: Seasonal averages of phase function from scattering angle (a)
0–180° and (b) 120–180° at 440 nm wavelength
Table 2: Seasonal mean of aerosol radiative forcing over Gobabeb for
December 2014 to November 2015
Season Surface (Wm-2) (WmTOA -2) Atmosphere (Wm-2)
Summer -4.89 0.16 5.05 Autumn -4.00 -0.36 3.64 Winter -6.46 2.95 9.41 Spring -4.91 -0.87 4.04
Where α is the α440-870 (Alam et al., 2014; Kang et al., 2016;
Kumar et al., 2015).
The AOD from both sensors (Figure 6) showed that the MODIS was able to reproduce similar features as that of AERONET despite the fact that it overestimates the ground measurement. Both sensors recorded the lowest values in June 0.05 and 0.11 for AERONET and MODIS, respectively while for both, maximum occurred in September with 0.29 and 0.36, respectively. There was a slight increase in AOD in May for both sensors and then a decrease before it started rising to the maximum in September.
The intercomparison between the two sensors (Figure 7) was carried out using linear regression of the scatter plots for each season. The slope and intercept of the regression lines are of high importance (Adesina et al., 2016; Alam et al., 2014; Levy et al., 2010; More et al., 2013). The slope shows the degree of the satellite retrieval bias as a result of aerosol model assumptions, pixel choice, instrument calibration or uncertainties associated with large AOD when it departs from unity (Adesina et al., 2016; More et al., 2013; Zhao et al., 2002). The deviation of the intercept from zero is attributed to either incorrect assumptions of the reflectance of the surface when AOD is small or as a result of the difference in terms of the spatial coverage of both sensors. The slopes of both the summer and the autumn indicate that MODIS overestimates AERONET for these seasons. The coefficient of determination for these two seasons was equally very low, i.e. 0.39 and 0.36, respectively. Clouds and fog that are prevalent during these seasons might have contributed to the wide disparity between the two sensors. The slope in winter and spring was similar although the coefficient of determination was much better for spring than in winter. In all seasons, the intercept was negligible showing a good retrieval of the AOD over the location. Ichoku et al. (2003) found that MODIS underestimates AERONET, particularly over Zambian locations, while Kumar et al. (2015) found a good correlation coefficient of 0.78 over Skukuza in South Africa. MODIS and AERONET were also found to have R2 = 0.72 over Lahore (Gupta et al., 2013), R2 =
0.76 over Jaipur (Tripathi et al., 2005), and R2 ranging from 0.61
to 0.76 over four locations on the Indo-Gangetic plains in India (Bibi et al., 2015). The correlation coefficient between MODIS and AERONET is also found to differ in terms of season. Alam et al. (2014) found R2 = (0.66 and 0.68) for pre-monsoon and
post-monsoon seasons over Lahore while Prasad et al. (2007) found R2 = (0.47 and 0.29) for the winter and summer respectively. A
correlation coefficient of 0.76-0.80 was equally found over the Mediterranean basin (Floutsi et al., 2016).
Figure 6: MODIS and AERONET AOD550 monthly variability during the study period
Figure 7: MODIS and AERONET AOD550 monthly variability during the study period
Conclusion
Gobabeb experienced low AOD500 from the beginning of the year to July followed by an increase from August to October. It subsequently decreased again until the end of the year. The increase in August to October can be attributed to long-range transport of biomass burning aerosols as a result of atmospheric circulation processes. The high AOD500 with corresponding high α440-870 during this period corroborates this. The VSD of aerosols
over the location showed various particle sizes of the coarse mode in the different seasons with the largest sizes during the summer. This may be due to the hygroscopic growth of aerosols because of the presence of high water vapor content. The spring season also had an almost equal presence of coarse and fine particles. The SSA showed a strong wavelength dependence (characteristic of biomass burning) during the winter season, while other seasons did not - perhaps due to a mixture of various types of aerosol particles. The imaginary refractive index showed a strong absorption property of aerosols in winter, followed by spring. The phase function showed that particles capable of backscattering are more present in autumn followed by summer, then spring and lowest in winter. This can also point to the prevalence in coarse particles present in these seasons. Aerosol radiative forcing had a heating effect in all seasons with the highest during the winter. An intercomparison between the sunphotometer and the MODIS sensor showed that though MODIS reproduced a similar trend as that of sunphotometer, it overvalues it in all the months. The two instruments correlate better during the spring than all other seasons.
Acknowledgments
Funding for this research is contributed by the Groupement de Recherche International “Atmospheric Research in Southern Africa and the Indian Ocean” (ARSAIO, CNRS/NRF) and the PHC PROTEA (contract n. 863243K) of the NRF and the French Ministries of National Education, of Research and of Foreign Affairs and International Development. The sunphotometer data are from AERONET and the MODIS data used in this paper were produced with the Giovanni online data system, developed and maintained by the NASA GES DISC.
References
Adesina, A. J., Kumar, K. R. and Sivakumar, V. (2015). Variability in aerosol optical properties and radiative forcing over Gorongosa (18.97 oS, 34.35 oE) in Mozambique. Meteorology and Atmospheric Physics, 127(2), 217-228. https://doi.org/10.1007/ s00703-014-0352-2
Adesina, A. J., Kumar, K. R., Sivakumar, V. and Griffith, D. (2014). Direct radiative forcing of urban aerosols over Pretoria (25.75 S, 28.28 E) using AERONET Sunphotometer data: First scientific results and environmental impact. Journal of Environmental Sciences, 26(12), 2459-2474. https://doi.org/10.1016/j. jes.2014.04.006
Adesina, A. J., Kumar, K. R., Sivakumar, V. and Piketh, S. J. (2016). Intercomparison and assessment of long-term (2004-2013) multiple satellite aerosol products over two contrasting sites in South Africa. Journal of Atmospheric and Solar-Terrestrial Physics, 148, 82-95. https://doi.org/10.1016/j.jastp.2016.09.001 Alam, K., Sahar, N. and Iqbal, Y. (2014). Aerosol characteristics and radiative forcing during pre-monsoon and post-monsoon seasons in an urban environment. Aerosol Air Qual. Res, 14(1), 99-107. https://doi.org/10.4209/aaqr.2013.05.0154
Alam, K., Trautmann, T., Blaschke, T. and Majid, H. (2012). Aerosol optical and radiative properties during summer and winter seasons over Lahore and Karachi. Atmospheric Environment, 50, 234e245. https://doi.org/10.1016/j.atmosenv.2011.12.027 Ali, M., Tariq, S., Mahmood, K., Daud, A. and Batool, A. (2014). A study of aerosol properties over Lahore (Pakistan) by using AERONET data. Asia-Pacific Journal of Atmospheric Sciences, 50(2), 153-162. https://doi.org/10.1007/s13143-014-0004-y Bi, J., Huang, J., Fu, Q., Wang, X., Shi, J., Zhang, W., Huang, Z. and Zhang, B. (2011). Toward characterization of the aerosol optical properties over Loess Plateau of Northwestern China. Journal of Quantitative Spectroscopy and Radiative Transfer, 112(2), 346-360. https://doi.org/10.1016/j.jqsrt.2010.09.006
Bibi, H., Alam, K., Blaschke, T., Bibi, S. and Iqbal, M. J. (2016). Long-term (2007-2013) analysis of aerosol optical properties over four locations in the Indo-Gangetic plains. Applied optics, 55(23), 6199-6211. https://doi.org/10.1364/AO.55.006199 Bibi, H., Alam, K., Chishtie, F., Bibi, S., Shahid, I. and Blaschke, T. (2015). Intercomparison of MODIS, MISR, OMI, and CALIPSO aerosol optical depth retrievals for four locations on the Indo-Gangetic plains and validation against AERONET data. Atmospheric Environment, 111, 113-126. https://doi. org/10.1016/j.atmosenv.2015.04.013
Chester, R., Elderfield, H., Griffin, J., Johnson, L. and Padgham, R. (1972). Eolian dust along the eastern margins of the Atlantic Ocean. Marine Geology, 13(2), 91-105. https://doi. org/10.1016/0025-3227(72)90048-5
Chiloane, K. E., Beukes, J. P., Van Zyl, P. G., Maritz, P., Vakkari, V., Josipovic, M., Venter, A. D., Jaars, K., Tiitta, P. and Kulmala, M. (2017). Spatial, temporal and source contribution assessments of black carbon over the northern interior of South Africa. Atmospheric Chemistry and Physics. https://doi.org/10.5194/ acp-17-6177-2017
Chung, C. E., Ramanathan, V. and Kiehl, J. T. (2002). Effects of the South Asian absorbing haze on the northeast monsoon and surface-air heat exchange. Journal of Climate, 15(17), 2462-2476. https://doi.org/10.1175/1520-0442(2002)015<2462:EOTSA A>2.0.CO;2
Diner, D., Abdou, W., Bruegge, C., Conel, J., Crean, K., Gaitley, B., Helmlinger, M., Kahn, R., Martonchik, J. and Pilorz, S. (2001). MISR aerosol optical depth retrievals over southern Africa during the SAFARI-2000 dry season campaign. Geophysical Research Letters, 28(16), 3127-3130. https://doi. org/10.1029/2001GL013188
Dubovik, O., Holben, B., Eck, T., Smirnov, A., Kaufman, Y., King, M., Tanre, D. and Slutsker, I. (2002). Climatology of aerosol absorption and optical properties in key worldwide locations. J. Atmos. Sci, 59, 590-608. https://doi.org/10.1175/1520-0469(2002)059<0590:VOAAOP>2.0.CO;2
Dubovik, O. and King, M. D. (2000). A flexible inversion algorithm for retrieval of aerosol optical properties from Sun and sky radiance measurements. Journal of Geophysical Research, 105(D16), 20673-20696. https://doi.org/10.1029/2000JD900282 Dubovik, O., Sinyuk, A., Lapyonok, T., Holben, B. N., Mishchenko, M., Yang, P., Eck, T. F., Volten, H., Muñoz, O. and Veihelmann, B. (2006). Application of spheroid models to account for aerosol particle nonsphericity in remote sensing of desert dust. Journal of Geophysical Research: Atmospheres, 111(D11). https://doi. org/10.1029/2005JD006619
Eck, T., Holben, B., Reid, J., Mukelabai, M., Piketh, S., Torres, O., Jethva, H., Hyer, E., Ward, D. and Dubovik, O. (2013). A seasonal trend of single scattering albedo in southern African biomass-burning particles: Implications for satellite products and estimates of emissions for the world’s largest biomass-burning source. Journal of Geophysical Research: Atmospheres, 118(12), 6414-6432. https://doi.org/10.1002/jgrd.50500
Eck, T., Holben, B., Reid, J., O’neill, N., Schafer, J., Dubovik, O., Smirnov, A., Yamasoe, M. and Artaxo, P. (2003b). High aerosol optical depth biomass burning events: A comparison of optical properties for different source regions. Geophysical Research Letters, 30(20). https://doi.org/10.1029/2003GL017861
Eck, T., Holben, B., Ward, D., Mukelabai, M., Dubovik, O., Smirnov, A., Schafer, J., Hsu, N., Piketh, S. and Queface, A. (2003a). Variability of biomass burning aerosol optical characteristics in southern Africa during the SAFARI 2000 dry season campaign and a comparison of single scattering albedo estimates from radiometric measurements. Journal of Geophysical Research: Atmospheres, 108(D13). https://doi.org/10.1029/2002JD002321 Eckardt, F., Soderberg, K., Coop, L., Muller, A., Vickery, K., Grandin, R., Jack, C., Kapalanga, T. and Henschel, J. (2013). The nature of moisture at Gobabeb, in the central Namib Desert. Journal of arid environments, 93, 7-19. https://doi.org/10.1016/j. jaridenv.2012.01.011
Floutsi, A., Korras-Carraca, M., Matsoukas, C., Hatzianastassiou, N. and Biskos, G. (2016). Climatology and trends of aerosol optical depth over the Mediterranean basin during the last 12 years (2002-2014) based on Collection 006 MODIS-Aqua data.
Science of the Total Environment, 551, 292-303. https://doi. org/10.1016/j.scitotenv.2016.01.192
García, O., Díaz, J., Expósito, F., Díaz, A., Dubovik, O., Derimian, Y., Dubuisson, P. and Roger, J.-C. (2011). Shortwave radiative forcing and efficiency of key aerosol types using AERONET data. Atmospheric Chemistry and Physics Discussions, 11(12), 32647-32684. https://doi.org/10.5194/acpd-11-32647-2011
Gupta, P., Khan, M. N., da Silva, A. and Patadia, F. (2013). MODIS aerosol optical depth observations over urban areas in Pakistan: quantity and quality of the data for air quality monitoring. Atmospheric pollution research, 4(1), 43-52. https:// doi.org/10.5094/APR.2013.005
Hegg, D., Covert, D., Jonsson, H. and Woods, R. (2012). A simple relationship between cloud drop number concentration and precursor aerosol concentration for the regions of Earth’s large marine stratocumulus decks. Atmospheric Chemistry and Physics, 12(3), 1229-1238. https://doi.org/10.5194/acp-12-1229-2012
Hersey, S., Garland, R. M., Crosbie, E., Shingler, T., Sorooshian, A., Piketh, S. and Burger, R. (2015). An overview of regional and local characteristics of aerosols in South Africa using satellite, ground, and modeling data. Atmospheric chemistry and physics (Print), 15, 4259. https://doi.org/10.5194/acp-15-4259-2015 Holben, B., Eck, T., Slutsker, I., Tanre, D., Buis, J., Setzer, A., Vermote, E., Reagan, J., Kaufman, Y. and Nakajima, T. (1998). AERONET-A federated instrument network and data archive for aerosol characterization. Remote sensing of environment, 66(1), 1-16. https://doi.org/10.1016/S0034-4257(98)00031-5
Ichoku, C., Remer, L. A., Kaufman, Y. J., Levy, R., Chu, D. A., Tanré, D. and Holben, B. N. (2003). MODIS observation of aerosols and estimation of aerosol radiative forcing over southern Africa during SAFARI 2000. Journal of Geophysical Research: Atmospheres, 108(D13). https://doi.org/10.1029/2002JD002366 Kang, N., Kumar, K. R., Hu, K., Yu, X. and Yin, Y. (2016). Long-term (2002-2014) evolution and trend in Collection 5.1 Level-2 aerosol products derived from the MODIS and MISR sensors over the Chinese Yangtze River Delta. Atmospheric Research, 181, 29-43. https://doi.org/10.1016/j.atmosres.2016.06.008
Kaufman, Y., Tanré, D., Remer, L. A., Vermote, E., Chu, A. and Holben, B. (1997). Operational remote sensing of tropospheric aerosol over land from EOS moderate resolution imaging spectroradiometer. Journal of Geophysical Research: Atmospheres, 102(D14), 17051-17067. https://doi. org/10.1029/96JD03988
King, M. D., Menzel, W. P., Kaufman, Y. J., Tanré, D., Gao, B.-C., Platnick, S., Ackerman, S. A., Remer, L. A., Pincus, R. and Hubanks, P. A. (2003). Cloud and aerosol properties, precipitable water, and profiles of temperature and water vapor from MODIS.
IEEE Transactions on Geoscience and Remote Sensing, 41(2), 442-458. https://doi.org/10.1109/TGRS.2002.808226
Kokhanovsky, A. (1998). Variability of the phase function of atmospheric aerosols at large scattering angles. Journal of the Atmospheric Sciences, 55(3), 314-320. https://doi. org/10.1175/1520-0469(1998)055<0314:VOTPFO>2.0.CO;2 Kumar, K. R., Sivakumar, V., Reddy, R., Gopal, K. R. and Adesina, A. J. (2013). Inferring wavelength dependence of AOD and Ångström exponent over a sub-tropical station in South Africa using AERONET data: Influence of meteorology, long-range transport and curvature effect. Science of the Total Environment, 461, 397-408. https://doi.org/10.1016/j.scitotenv.2013.04.095 Kumar, K. R., Yin, Y., Sivakumar, V., Kang, N., Yu, X., Diao, Y., Adesina, A. J. and Reddy, R. (2015). Aerosol climatology and discrimination of aerosol types retrieved from MODIS, MISR and OMI over Durban (29.88 S, 31.02 E), South Africa. Atmospheric Environment, 117, 9-18. https://doi.org/10.1016/j. atmosenv.2015.06.058
Laakso, L., Vakkari, V., Virkkula, A., Laakso, H., Backman, J., Kulmala, M., Beukes, J., Van Zyl, P., Tiitta, P. and Josipovic, M. (2012). South African EUCAARI measurements: seasonal variation of trace gases and aerosol optical properties. Atmospheric Chemistry and Physics, 12(4), 1847-1864. https:// doi.org/10.5194/acp-12-1847-2012
Levy, R., Remer, L., Kleidman, R., Mattoo, S., Ichoku, C., Kahn, R. and Eck, T. (2010). Global evaluation of the Collection 5 MODIS dark-target aerosol products over land. Atmospheric Chemistry and Physics, 10(21), 10399-10420. https://doi.org/10.5194/acp-10-10399-2010
Levy, R. C., Remer, L., Mattoo, S., Vermote, E. and Kaufman, Y. (2007). Second-generation algorithm for retrieving aerosol properties over land from MODIS spectral reflectance. J. Geophys. Res, 112(D13), D13. https://doi.org/10.1029/2006JD007815 Li, J., Carlson, B. E., Dubovik, O. and Lacis, A. A. (2014). Recent trends in aerosol optical properties derived from AERONET measurements. Atmospheric Chemistry and Physics, 14(22), 12271-12289. https://doi.org/10.5194/acp-14-12271-2014 Losno, R., Bergametti, G. and Carlier, P. (1992). Origins of atmospheric particulate matter over the North Sea and the Atlantic Ocean. Journal of atmospheric chemistry, 15(3-4), 333-352. https://doi.org/10.1007/BF00115403
More, S., Pradeep Kumar, P., Gupta, P., Devara, P. and Aher, G. (2013). Comparison of aerosol products retrieved from AERONET, MICROTOPS and MODIS over a tropical urban city, Pune, India. Aerosol and air quality research, 13(1), 107-121. https://doi.org/10.4209/aaqr.2012.04.0102
Pawar, G., Devara, P. and Aher, G. (2015). Identification of aerosol types over an urban site based on air-mass trajectory classification. Atmospheric Research, 164, 142-155. https://doi. org/10.1016/j.atmosres.2015.04.022
Piketh, S., Annegarn, H. and Tyson, P. (1999). Lower tropospheric aerosol loadings over South Africa: The relative contribution of aeolian dust, industrial emissions, and biomass burning. Journal of Geophysical Research: Atmospheres, 104(D1), 1597-1607. https://doi.org/10.1029/1998JD100014
Platnick, S., King, M., Hobbs, P., Osborne, S., Piketh, S. and Ruinjes, R. (2001). Cloud and Radiation Studies during SAFARI 2000. Paper presented at the AGU Fall Meeting Abstracts. Prasad, A. K., Singh, S., Chauhan, S., Srivastava, M. K., Singh, R. P. and Singh, R. (2007). Aerosol radiative forcing over the Indo-Gangetic plains during major dust storms. Atmospheric Environment, 41(29), 6289-6301. https://doi.org/10.1016/j. atmosenv.2007.03.060
Queface, A. J., Piketh, S. J., Eck, T. F., Tsay, S.-C. and Mavume, A. F. (2011). Climatology of aerosol optical properties in Southern Africa. Atmospheric Environment, 45(17), 2910-2921. https:// doi.org/10.1016/j.atmosenv.2011.01.056
Remer, L. A., Kaufman, Y., Tanré, D., Mattoo, S., Chu, D., Martins, J. V., Li, R.-R., Ichoku, C., Levy, R. and Kleidman, R. (2005). The MODIS aerosol algorithm, products, and validation. Journal of the Atmospheric Sciences, 62(4), 947-973. https://doi. org/10.1175/JAS3385.1
Remer, L. A., Kleidman, R. G., Levy, R. C., Kaufman, Y. J., Tanré, D., Mattoo, S., Martins, J. V., Ichoku, C., Koren, I. and Yu, H. (2008). Global aerosol climatology from the MODIS satellite sensors. Journal of Geophysical Research: Atmospheres, 113(D14). https://doi.org/10.1029/2007JD009661
Ricchiazzi, P., Yang, S., Gautier, C. and Sowle, D. (1998). SBDART: A research and teaching software tool for plane-parallel radiative transfer in the Earth’s atmosphere. Bulletin of the American Meteorological Society, 79(10), 2101-2114. https://doi. org/10.1175/1520-0477(1998)079<2101:SARATS>2.0.CO;2 Sreekanth, V. and Kulkarni, P. (2013). Spatio-temporal variations in columnar aerosol optical properties over Bay of Bengal: Signatures of elevated dust. Atmospheric Environment, 69, 249-257. https://doi.org/10.1016/j.atmosenv.2012.12.031
Stocker, T., Qin, D., Plattner, G., Tignor, M., Allen, S., Boschung, J., Nauels, A., Xia, Y., Bex, B. and Midgley, B. (2013). IPCC, 2013: climate change 2013: the physical science basis. Contribution of working group I to the fifth assessment report of the intergovernmental panel on climate change.
Swap, R., Garstang, M., Macko, S., Tyson, P., Maenhaut, W., Artaxo, P., Kållberg, P. and Talbot, R. (1996). The long-range transport of
southern African aerosols to the tropical South Atlantic. Journal of Geophysical Research: Atmospheres, 101(D19), 23777-23791. https://doi.org/10.1029/95JD01049
Tanré, D., Kaufman, Y., Herman, M. and Mattoo, S. (1997). Remote sensing of aerosol properties over oceans using the MODIS/EOS spectral radiances. Journal of Geophysical Research: Atmospheres, 102(D14), 16971-16988. https://doi. org/10.1029/96JD03437
Tripathi, S., Dey, S., Chandel, A., Srivastava, S., Singh, R. P. and Holben, B. (2005). Comparison of MODIS and AERONET derived aerosol optical depth over the Ganga Basin, India. Paper presented at the Annales Geophysicae. https://doi.org/10.5194/ angeo-23-1093-2005
Tyson, P. D. and Preston-Whyte, R. A. (2000). weather and climate of southern Africa: Oxford University Press.
Vakkari, V., Beukes, J. P., Dal Maso, M., Aurela, M., Josipovic, M. and van Zyl, P. G. (2018). Major secondary aerosol formation in southern African open biomass burning plumes. Nature Geoscience, 11(8), 580. https://doi.org/10.1038/s41561-018-0170-0
Zhao, T. X., Stowe, L. L., Smirnov, A., Crosby, D., Sapper, J. and McClain, C. R. (2002). Development of a global validation package for satellite oceanic aerosol optical thickness retrieval based on AERONET observations and its application to NOAA/NESDIS operational aerosol retrievals. Journal of the Atmospheric Sciences, 59(3), 294-312. https://doi.org/10.1175/1520-0469(2002)059<0294:DOAGVP>2.0.CO;2
Zhou, X., Ackerman, A. S., Fridlind, A. M., Wood, R. and Kollias, P. (2017). Impacts of solar-absorbing aerosol layers on the transition of stratocumulus to trade cumulus clouds. Atmospheric Chemistry and Physics, 17(20), 12725-12742. https://doi.org/10.5194/acp-17-12725-2017