HAL Id: hal-00302417
https://hal.archives-ouvertes.fr/hal-00302417
Submitted on 15 Jan 2007HAL is a multi-disciplinary open access
archive for the deposit and dissemination of sci-entific research documents, whether they are pub-lished or not. The documents may come from teaching and research institutions in France or abroad, or from public or private research centers.
L’archive ouverte pluridisciplinaire HAL, est destinée au dépôt et à la diffusion de documents scientifiques de niveau recherche, publiés ou non, émanant des établissements d’enseignement et de recherche français ou étrangers, des laboratoires publics ou privés.
Nine years of UV aerosol optical depth measurements at
Thessaloniki, Greece
S. Kazadzis, A. Bais, V. Amiridis, D. Balis, C. Meleti, N. Kouremeti, C. S.
Zerefos, S. Rapsomanikis, M. Petrakakis, A. Kelesis, et al.
To cite this version:
S. Kazadzis, A. Bais, V. Amiridis, D. Balis, C. Meleti, et al.. Nine years of UV aerosol optical depth measurements at Thessaloniki, Greece. Atmospheric Chemistry and Physics Discussions, European Geosciences Union, 2007, 7 (1), pp.537-567. �hal-00302417�
ACPD
7, 537–567, 2007Aerosol optical depth variability in an urban environment S. Kazadzis et al. Title Page Abstract Introduction Conclusions References Tables Figures ◭ ◮ ◭ ◮ Back Close
Full Screen / Esc
Printer-friendly Version Interactive Discussion
EGU Atmos. Chem. Phys. Discuss., 7, 537–567, 2007
www.atmos-chem-phys-discuss.net/7/537/2007/ © Author(s) 2007. This work is licensed
under a Creative Commons License.
Atmospheric Chemistry and Physics Discussions
Nine years of UV aerosol optical depth
measurements at Thessaloniki, Greece
S. Kazadzis1, A. Bais1, V. Amiridis2, D. Balis1, C. Meleti1, N. Kouremeti1,C. S. Zerefos3, S. Rapsomanikis4, M. Petrakakis5, A. Kelesis5, P. Tzoumaka5, and K. Kelektsoglou4
1
Laboratory of Atmospheric Physics, Physics Department, Aristotle University of Thessaloniki, University Campus Box 149, 54124, Thessaloniki, Greece
2
Institute for Space Applications and Remote Sensing, National Observatory of Athens, Athen, Greece
3
University Athens, Fac. Geol Geoenvironment, Climatology Lab., Athen, Greece
4
Democritus University Thrace, Department of Environmental Engnineering, Xanthi, Greece
5
Municipal Thessaloniki, Department of Environment, Thessaloniki, Greece
Received: 31 October 2006 – Accepted: 8 January 2007 – Published: 15 January 2007 Correspondence to: S. Kazadzis (skazan@auth.gr)
ACPD
7, 537–567, 2007Aerosol optical depth variability in an urban environment S. Kazadzis et al. Title Page Abstract Introduction Conclusions References Tables Figures ◭ ◮ ◭ ◮ Back Close
Full Screen / Esc
Printer-friendly Version Interactive Discussion
EGU
Abstract
Spectral measurements of the aerosol optical depth (AOD) and the Angstrom coeffi-cient were conducted at Thessaloniki, Greece (40.5◦N, 22.9◦E) between January 1997 and December 2005 with a Brewer MKIII double-monochromator spectroradiometer. The dataset was compared with collocated measurements of a second
spectrora-5
diometer (Brewer MKII) and a CIMEL sun-photometer, showing correlations of 0.93 and 0.98 respectively. A seasonal variation of the AOD was observed at Thessaloniki, with AOD values at 340 nm of 0.52 and 0.28 for August and December respectively. Back trajectories of air masses for up to 4 days were used to assess the influence of long-range transport from various regions to the aerosol load over Thessaloniki. It is
10
shown that part of the observed seasonality can be attributed to air masses with high AOD originating from North-Eastern and Eastern directions during summertime. The analysis of the long-term record (9 years) of AOD showed a downward tendency. A similar decreasing tendency was found in the record of the PM-10 aerosol measure-ments, which are conducted near the surface at 4 air-quality monitoring stations in the
15
area of the city of Thessaloniki.
1 Introduction
Aerosols play a very important role for the Earth-atmosphere energy budget as they modify it through various atmospheric processes. Such processes are: the direct effect by scattering and absorption of the solar and earth’s radiation (Coakley et al., 1983;
20
Charlson et al., 1992), the semi-direct effect by changing atmospheric thermodynamics and cloud formation (Ackerman et al., 2000; Koren et al., 2004), and finally the indirect effect by changing cloud microphysics (Twomey, 1977; Rosenfeld and Lensky, 1998). The impact of aerosols to the planet’s radiative forcing is a major component of global and regional climatic patterns, influencing processes in the atmospheric boundary layer
25
temper-ACPD
7, 537–567, 2007Aerosol optical depth variability in an urban environment S. Kazadzis et al. Title Page Abstract Introduction Conclusions References Tables Figures ◭ ◮ ◭ ◮ Back Close
Full Screen / Esc
Printer-friendly Version Interactive Discussion
EGU atures over the globe (Charlson et al., 1992). The cooling by anthropogenic aerosols
may be comparable in magnitude to greenhouse gas warming on a global scale but can be much larger on a regional scale (Intergovernmental Panel on Climate Change (IPCC), 2001). However, uncertainties remain substantial for the direct and for the indirect effect (IPCC, 2001; Anderson et al., 2003a).
5
Aerosols found over the Mediterranean originate from various sources, such as the superimposition of a marine component, a mineral dust component (Saharan dust out-breaks and local dust suspension) and the local and long range transported anthro-pogenic component (Lelieveld et al., 2002; Moulin et al., 1997; di Sarra et al., 2003). In the last decade, a substantial number of experimental studies on aerosols has been
10
focused on the eastern Mediterranean area (Luria et al., 1996; Pinker et al., 1997; Mi-halopoulos et al., 1997; Papayannis et al., 1998, 2005; Formenti et al., 2001, 2002; Lelieveld et al., 2002; Gerasopoulos et al., 2003; Balis et al., 2003, 2004; Amiridis et al., 2005). Various model studies predicted maximum net direct radiative forcing by sulfate aerosols for this region (Charlson et al., 1991; Kiehl and Rodhe, 1995; Boucher
15
and Anderson, 1995). For the eastern part of Mediterranean, the Aegean Sea and the coastal part of continental Greece, aerosols from different sources can be identified. Apart from local pollution, aerosols that originate from biomass burning, anthropogenic aerosols from the highly populated urban centres and industrial areas of Central and Eastern Europe and maritime aerosols, converge over this area (Formenti et al., 2002;
20
Balis et al., 2003). For the lower troposphere over the Mediterranean, particularly dur-ing summer, European pollution is mainly responsible for the reduction of air quality, whereas in the free troposphere pollution is largely determined by trans-boundary and possibly intercontinental transport (Zerefos et al., 2000; Lelieveld et al., 2002; Balis et al., 2003, 2004).
25
In this paper we discuss the variability of aerosol optical depth measured with a Brewer spectroradiometer at Thessaloniki, Greece during the period January 1997 to December 2005. In Sect. 2 we describe the instrumentation and the methods used for the data analysis. Section 3 presents a statistical analysis of the Brewer-derived
ACPD
7, 537–567, 2007Aerosol optical depth variability in an urban environment S. Kazadzis et al. Title Page Abstract Introduction Conclusions References Tables Figures ◭ ◮ ◭ ◮ Back Close
Full Screen / Esc
Printer-friendly Version Interactive Discussion
EGU measurements of the aerosol optical depth in the UV region and the Angstrom
coeffi-cient, along with discussions on their seasonal dependence. Back-trajectory analyses show an additional dependence of the aerosol optical depth on the origin of the air masses. In Sect. 6 PM10 aerosol measurements are analysed for the investigation of the boundary layer contribution to the total aerosol load over Thessaloniki.
5
2 Instrumentation, methodologies and modelling tools
2.1 Site description
Measurements of the aerosol optical depth have been conducted in Thessaloniki, a city with a population of approximately 1 million, since 1997. The measuring station is located near the centre of the city on the roof of the Physics Department of the Aristotle
10
University of Thessaloniki (40◦38 N, 22◦57 E, 80 m a.s.l.). The site is facing the Aegean Sea to the south and is situated along the expected pathway through which pollution from central and Eastern Europe influences aerosol loading over the Eastern Mediter-ranean. Three different instruments have been used to derive the AOD. Their main characteristics and the methodologies used are presented in the following sections.
15
2.2 The Brewer spectroradiometers
The Brewer MKIII spectroradiometer is a double monochromator, which can provide spectrally resolved measurements of the global and the direct solar irradiance. Its op-erational spectral range is 290–365 nm, and its spectral resolution is 0.55 nm at full width at half maximum (FWHM). Details on the operation and calibration procedures
20
are given in Bais et al. (1997). A second, single monochromator Brewer MKII spec-troradiometer measures the direct spectral irradiance with similar spectral resolution at five wavelengths in the UV-B region, nominally at 306.3, 310.0, 313.5, 316.8 and 320 nm. These measurements are not absolutely calibrated since they are used in relative sense to derive the total ozone column (Kerr et al., 1981).
ACPD
7, 537–567, 2007Aerosol optical depth variability in an urban environment S. Kazadzis et al. Title Page Abstract Introduction Conclusions References Tables Figures ◭ ◮ ◭ ◮ Back Close
Full Screen / Esc
Printer-friendly Version Interactive Discussion
EGU The retrieval of the aerosol optical depth, especially at the shorter UV-B wavelengths,
is difficult and is associated with substantial uncertainties (Marenco et al., 1997), re-quiring accurate and precise calibration and quality control procedures. The AOD is calculated as the residual optical depth after subtracting from the total atmospheric optical depth the optical depths due to molecular scattering, and the O3 and SO2
ab-5
sorption. One key issue is the absolute calibration of the direct spectral irradiance measurements. Two approaches have been proposed: The first is based on the ab-solute calibration of the solar spectral irradiance measured by the Brewer (Bais, 1997; Marenco et al., 1997; Meleti and Cappellani, 2000; Kazadzis 2005), while the second uses the Langley extrapolation method to derive the absolute calibration of the
irradi-10
ance (Jaroslawski and Krzyscin, 2000; Jaroslawski et al., 2003; Kirchhoff et al., 2001; Marenco et al., 2002; Cheymol and De Backer 2003; Groebner and Meleti 2004). The AOD derived from both methods appears consistent with those measured indepen-dently by a multifilter rotating shadow-band radiometer (Marenco et al., 2002) and by a CIMEL Sun photometer (Jaroslawski and Krzyscin, 2000; Meleti and Cappellani,
15
2000).
In this study, following the methodology described in Marenco et al. (1997), we used absolutely calibrated direct irradiance spectral measurements in the range 290–365 nm and in steps of 0.5 to retrieve the total column of the aerosol optical depth. The spectral AOD is determined by comparing the measured cloud-free spectrum of the direct
irra-20
diance with the direct irradiance at the surface which is calculated from the transfer of the high resolution extraterrestrial spectrum ATLAS 3 (Van Hoosier, 1996) through the atmosphere using the Beer’s law and accounting only for molecular absorption (mainly O3 and SO2) and Rayleigh scattering. The Rayleigh optical depth was calculated
ac-cording to Hansen and Travis (1974) and the ozone cross sections were taken from
25
Bass and Paur (1985). The calculations are performed at the resolution of the ATLAS 3 spectrum and the derived high-resolution irradiance at the ground is convoluted with the instrument’s slit function to derive finally the optical depth. The basic method that was used to calibrate the measured direct irradiance spectra and the uncertainties of
ACPD
7, 537–567, 2007Aerosol optical depth variability in an urban environment S. Kazadzis et al. Title Page Abstract Introduction Conclusions References Tables Figures ◭ ◮ ◭ ◮ Back Close
Full Screen / Esc
Printer-friendly Version Interactive Discussion
EGU the methodology are described in Bais, (1997) and in Kazadzis et al. (2005). The
cali-bration method has been recently improved to account for polarization effects from the instrument’s window (Cede et al., 2006).
Uncertainties in the AOD retrieval from Brewer spectroradiometric measurements arise either form the instruments operation (e.g. occasions of non ideal positioning of
5
the input optics to the sun) or from the AOD retrieval methodology (e.g. the assumption of negligible NO2 concentrations). The latter may lead to an overestimation of the
calculated AOD of at most 0.005 and 0.01, respectively at 320 and 340 nm for each Dobson Unit of NO2(Arola and Koskela, 2005).
A second collocated Brewer MKII spectroradiometer has been also used to derive
10
the AOD at six wavelengths in the UV-B region, following the methodology described in (Meleti and Cappellani, 2000; Groebner and Meleti, 2004; De Backer and Cheymol, 2004). In this case the Langley extrapolation method was used to derive the extrater-restrial solar flux at the six wavelengths.
The AOD data used in this study were obtained by the two Brewer
spectroradiome-15
ters obtained in the period 1997–2005. 2.3 CIMEL sunphotometer
Since September 2005 AOD measurements at Thessaloniki have been enriched with the addition of a CIMEL sun photometer (provided by the Department of Environmental Engineering of Democritus Univ Thrace). The CIMEL is an automatic Sun-sky
scan-20
ning filter radiometer allowing the measurements of the direct solar irradiance at wave-lengths 340, 380, 440, 500, 670, 870, and 1020 nm. This CIMEL instrument is part of the NASA’s Aerosol Robotic Network (AERONET). NASA provides preliminary pro-cessing of the real-time data containing the daily pattern of AOD at all operational wavelengths (level 1.5 data) (Holben et al., 1998).
ACPD
7, 537–567, 2007Aerosol optical depth variability in an urban environment S. Kazadzis et al. Title Page Abstract Introduction Conclusions References Tables Figures ◭ ◮ ◭ ◮ Back Close
Full Screen / Esc
Printer-friendly Version Interactive Discussion
EGU 2.4 Backward trajectories and clustering algorithm
Analytical backward trajectories of air masses provide information about the origin of the aerosols observed at a particular location and on the dynamical patterns governing this transport of air masses. Systematic studies based on combined backward tra-jectories and long term aerosol vertical profile observations have been conducted for
5
Central European locations (Mattis et al., 2000) These studies have helped in explain-ing the dependence of the observed aerosol optical properties on the origin of the air masses. In our study, four-day back trajectories were computed for the days of inter-est (cases of cloudless skies), using the Hybrid Single-Particle Lagrangian Integrated Trajectory (HYSPLIT) model (Draxler and Hess, 1997). This model uses the
meteoro-10
logical data produced by the ETA Model of the National Weather Service of Spain to compute advection and dispersion of air parcels. We used HYSPLIT to generate 4-day back trajectories for air-parcels arriving over the site at Thessaloniki on 12:00 UTC at an altitude of 1500 m for all days with available Brewer AOD measurements. Measure-ments of the vertical profile of the aerosol backscatter coefficient with a LIDAR showed
15
that the maximum aerosol loading over Thessaloniki occurs at 1500 m above seal level (Amiridis et al., 2005).
Then, a cluster analysis algorithm was used to categorize the computed trajectories into groups of similar properties, the so-called clusters. In this study the clustering algorithm for atmospheric trajectories recommended by Dorling et al. (1992) was used,
20
which can be used also to determine the optimum number of clusters. For the arrival height of 1500 m over Thessaloniki, the optimum number of clusters was found to be five.
2.5 Measurements of the PM-10
Since 1988 the Environmental Department of Municipality of Thessaloniki operates a
25
network of monitoring stations measuring various atmospheric pollutants and mete-orological parameters. Nowadays the network consists of five atmospheric pollution
ACPD
7, 537–567, 2007Aerosol optical depth variability in an urban environment S. Kazadzis et al. Title Page Abstract Introduction Conclusions References Tables Figures ◭ ◮ ◭ ◮ Back Close
Full Screen / Esc
Printer-friendly Version Interactive Discussion
EGU stations and four meteorological stations. Measurements of airborne particulate matter
with an aerodynamic diameter of less than or equal to a nominal 10 microns (PM10) are conducted at all five monitoring stations. The instruments are automatic high-volume samplers that use absorption of β radiation for the determination of the PM10 con-centration. At the central station a TEOM (Tapered Element Oscillating Microbalance
5
Method) instrument is also used, measuring simultaneously with the high volume an-alyzer. The correlation coefficient between the two data sets is 0.9 (Petrakakis et al., 2005). All the other stations of the municipal network are equipped only with β radia-tion absorpradia-tion analyzers; hence the PM10 concentraradia-tions used in the present study are from instruments of this type. The two measuring methods mentioned above are
10
the most widely used throughout the European Networks, with the β absorption being the prevailing one. According to this method, the suspended particulates of ambient air are separated by filtering, using a membrane, whose absorbance ability has been measured in advance. The difference in the membrane’s absorbance ability before and after the filtering defines the mass of the selected particulate matter. This mass is
15
associated with the measurement of air volume which passes through the membrane and as a result the PM10 concentration is derived.
3 Aerosol optical depth comparisons
The aerosol optical depth measurements derived with the Brewer spectroradiome-ter were compared: i) with standard measurements of AOD from the CIMEL
sun-20
photometer, ii) with AOD measurements from the second Brewer spectroradiometer that uses a different methodology for retrieving the AOD.
The AOD at 340 nm derived from the Brewer MKIII and from the CIMEL sphotometer were compared for a period of 6 months (October 2005–March 2006) un-der cloudless-sky conditions. The irradiance at 340 nm is practically unaffected by
25
ozone and SO2variations. About 500 synchronized (with a time difference of less than 10 min) measurements were used for this investigation (see Fig. 1). The two datasets
ACPD
7, 537–567, 2007Aerosol optical depth variability in an urban environment S. Kazadzis et al. Title Page Abstract Introduction Conclusions References Tables Figures ◭ ◮ ◭ ◮ Back Close
Full Screen / Esc
Printer-friendly Version Interactive Discussion
EGU are highly correlated (r2=0.98) and have no significant offset. The mean AOD for this
period was calculated to 0.403 and 0.422 respectively for the Brewer and the CIMEL. The average difference is 0.019 with a standard deviation (1σ) of 0.022.
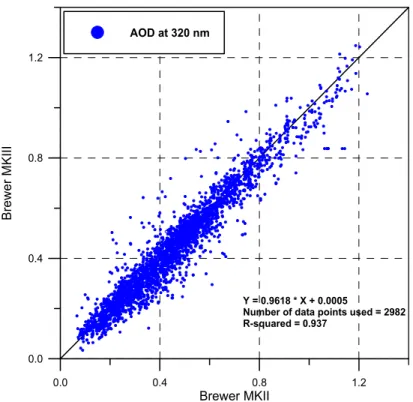
A comparison of the AOD at 320 nm retrieved from the two Brewer spectroradiome-ters during the period 1997–2005 is shown in Fig. 2. Here we used the AOD at 320 nm,
5
a wavelength that is affected by ozone, because this is the longest available wavelength in the Brewer MKII measurements. About 2900 data points (with time difference of less than 10 min) under cloud free skies are included in this comparison. For the selection of the cloud free days we used the methodology described in Vasaras et al. (2001), which is based on the variability of the measurements from a collocated pyranometer. The
10
correlation between the two data sets is again high (r2=0.937), taking into account that the two instruments use completely different methodologies to derive the AOD. Con-trary to the comparison of the MKIII Brewer with the CIMEL, the single monochromator Brewer MKII overestimates the AOD by about 5%. This difference could be related to the different calibration procedures and methodologies used in the two instruments for
15
the AOD retrieval.
4 Long term variability of aerosol optical depth
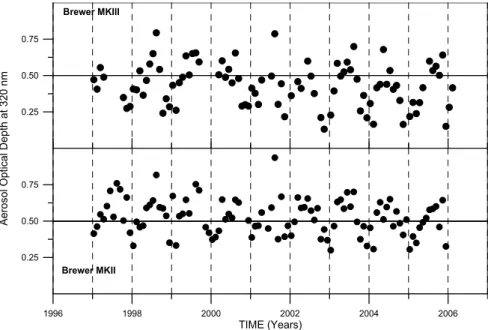
The long term variability of the AOD at 320 nm at Thessaloniki is discussed in this section, using monthly mean values for the period January 1997–December 2005 from both Brewer spectroradiometers (Fig. 3). The monthly means have been calculated
20
from daily averages of AOD, derived from all single measurements corresponding to cloudless skies. Only months with more than 8 days of data have been considered. Some of the gaps in the series of the MKIII Brewer are due to the relocation of the instrument to participate in experimental campaigns away from the home site.
The long term monthly mean AOD at 320 nm derived from the MKII Brewer was found
25
0.43±0.12 (1σ), while the mean AOD from the MKII is 0.47±0.18 (1σ). The difference between monthly averages from the two instruments is due to the different number of
ACPD
7, 537–567, 2007Aerosol optical depth variability in an urban environment S. Kazadzis et al. Title Page Abstract Introduction Conclusions References Tables Figures ◭ ◮ ◭ ◮ Back Close
Full Screen / Esc
Printer-friendly Version Interactive Discussion
EGU days forming each monthly mean, as the two instruments have different measurement
schedules. Nevertheless, the annual pattern of the AOD variability is similar for both datasets, with maximum values in the summer periods and minimum values in winter.
For Brewer MKIII, the standard deviation (1σ) of the daily measurements of AOD at 320 nm forming the monthly averages is on the average 0.12 with minimum and
5
maximum of 0.02 and 0.21 respectively.
Both series of AOD show a negative trend from 1997 towards 2005. A linear re-gression on the MKIII data reveals a change of –2.2%, –2.4% and –3.1% per year respectively for 320, 340 and 355 nm. For Brewer MKII the change of AOD at 320 nm for the same period was calculated to –1.6% per year, which is somewhat smaller that
10
the one calculated from the MKIII data. This difference is within the uncertainty levels of both instruments and is likely attributable to the differences in the amount of data composing the two datasets.
The frequency distribution of the AOD at 340 nm observed at Thessaloniki is shown in the left panel of Fig. 4, for bins of 0.1 AOD units. Nearly 50% of the cases lie between
15
0.2 and 0.5, while more than 30% of the cases show AOD values higher than 0.5 which indicates a location with high aerosol load.
The seasonal characteristics of the frequency distribution of occurrence of AOD at 340 nm show that in more than 50% of the cases in wintertime the AOD is lower than 0.3, while in the summertime in more than 50% of the cases the AOD is higher than
20
0.5. The right panel of Fig. 4 shows the relative contribution of the different seasons to the annual frequency distribution of AOD. The normalization is done by subtracting the yearly mean frequency of occurrence from every AOD bin selected from the percentage calculated for the same bin in each season.
For spring and autumn, all AOD categories have similar distributions differing at most
25
by about 3%, whereas for winter and summer seasons the distribution is shifted from low AOD values (winter) to high values (summer). Figure 4 (right) is also showing that in the wintertime the frequency of occurrence for AOD’s less than 0.3 is approximately 20% more than the average distribution, whereas in the summertime the frequency
ACPD
7, 537–567, 2007Aerosol optical depth variability in an urban environment S. Kazadzis et al. Title Page Abstract Introduction Conclusions References Tables Figures ◭ ◮ ◭ ◮ Back Close
Full Screen / Esc
Printer-friendly Version Interactive Discussion
EGU of occurrence for AOD’s more than 0.5 is approximately 20% more than the average
distribution. The mean AOD at 340 nm and the standard deviation of the mean for the four seasons are summarized in Table 1.
The wavelength dependence of the optical depth at Thessaloniki is investigated for the period 1997–2005 using the Angstr ¨om’s power law approximation:
5
τ(λ) = β ∗ λa (1)
where τ(λ) is the AOD at wavelength λ and a, β are the Angstr ¨om coefficients. The Angstr ¨om exponent, a, was derived from an exponential regression on the spectral optical depth in the wavelength range 325–350 nm. The spectral region below 325 nm was excluded from the regression in order to minimize the uncertainties introduced
10
in the spectral AOD by possible leakage in the parameterization of the ozone effects. The average value of the Angstr ¨om coefficient, a, for the entire dataset was estimated to 1.63±0.53. Gerasopoulos et al. (2003) found an Angstr ¨om coefficient of 1.57±0.28 using one year (2001) of data from a Multifilter Radiometer (MFR) at the same location. The MFR measures the global and diffuse irradiance at selected wavelengths in the
15
visible part of the spectrum. Values of the Angstr ¨om exponent, a, of about 1.2 to 1.4 are representative of continental aerosols, whereas for larger aerosols (dust, sea-salt) the exponent has lower values (Michalsky et al., 2001).
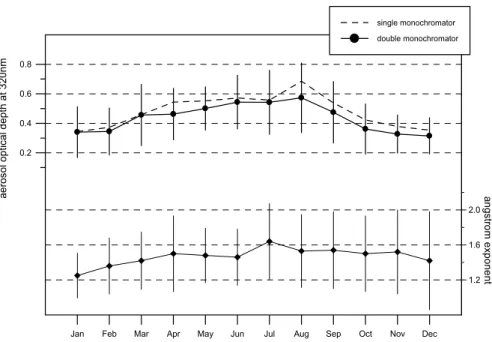
The long term monthly means of AOD and a derived from both Brewers are shown in Fig. 5. Both instruments reveal a clear annual pattern with a distinct maximum of AOD
20
in the summer months (between 0.5 and 0.6 for AOD at 320 nm), while in the winter period the AOD reaches a minimum of about 0.3. As for Fig. 3, the differences in the monthly means from the two instruments are due to differences in the data points forming each mean, as a result of different measuring schedules. However, these differences are within the 1σ uncertainty of the mean.
25
The observed AOD seasonality can be attributed to various processes: Enhanced evaporation and high temperatures in the summer increase the turbidity in the bound-ary layer and in conjunction with stagnant weather systems over the area help in the
ACPD
7, 537–567, 2007Aerosol optical depth variability in an urban environment S. Kazadzis et al. Title Page Abstract Introduction Conclusions References Tables Figures ◭ ◮ ◭ ◮ Back Close
Full Screen / Esc
Printer-friendly Version Interactive Discussion
EGU built up of the aerosols. The summer peak in the AOD is also supported by the
ab-sence of significant wet removal of aerosols and by the trans-boundary transportation of particles from eastern directions. The latter is confirmed by the consistency of the back-trajectories that are presented in the next section. During the winter months, there is significant wet deposition of aerosols, which together with the northern winds
5
that are dominant in the area, result in cleaning of the atmosphere and thus to lower AOD values.
5 Origin of air masses arriving at Thessaloniki
To explain part of the observed seasonality in AOD measurements at Thessaloniki we used back trajectories to investigate whether the magnitude of the observed AOD is
10
associated with the origin of the air masses. Back trajectories of up to four days for air-parcels arriving at 12:00 UTC over Thessaloniki at 1500 m a.s.l. were generated with the HYSPLIT model and for every day with AOD measurements. These 968 trajectories were categorized in five major clusters and are shown in Fig. 6. For each cluster the so-called seed trajectories have been determined, representing the average path of
15
the air masses.
Cluster 1 represents fast transport of air mass mainly from the Atlantic Ocean. Clus-ter 2 is the most common one, with air masses generally originating from Northern directions. The trajectories of cluster 3 correspond generally to westerly directions, while cluster 4 to easterly directions. Finally the 5th cluster includes mostly air masses
20
from local sources and in some cases those from the Saharan desert. Table 2 summa-rizes the aerosol characteristics of the five clusters, including the average and standard deviation of AOD, the frequency of occurrence of each cluster and the contribution of the winter and summer seasons. Daily means of the AOD were calculated for days that include at least 7 direct irradiance spectral measurements.
25
The data of Table 2 suggest that clusters 2, 3 and 5 contain trajectories that result in AOD close to the average AOD for all clusters (0.41), while clusters 1 and 4 correspond
ACPD
7, 537–567, 2007Aerosol optical depth variability in an urban environment S. Kazadzis et al. Title Page Abstract Introduction Conclusions References Tables Figures ◭ ◮ ◭ ◮ Back Close
Full Screen / Esc
Printer-friendly Version Interactive Discussion
EGU to the minimum and maximum AOD respectively. Cluster 1 represents transport of
masses containing very low aerosol load and measurements within this cluster can be characterized as cases with only boundary layer aerosol load and with minimum contribution from the free troposphere. From the occurrences of these cases it can be seen that they are dominant in the wintertime representing 32% of all cases, while in
5
the summer months they are very uncommon, in the order of 5% of total cases. During these months, air masses from northwest directions reach northern Greece, and are associated with increased wind speed and atmospheric washout, and with subsidence from the upper troposphere.
Cluster 4 represents air masses from eastern directions which are associated with
10
high aerosol loads over Thessaloniki. Lidar measurements (Amiridis et al., 2005) have shown that aerosols in the free troposphere transported from other regions may con-tribute to the total AOD by up to 50%, especially in the summer months. Various studies have demonstrated that in the summer months aerosols in the Eastern Mediterranean are largely affected by biomass burning episodes from forest fires in northern coast of
15
the Black Sea (Salisbury et al., 2003; Balis et al., 2003). Zerefos et al. (2000) reported that 70% of the SO2 column measured at Thessaloniki can be attributed to lignite com-bustion in power plants in Bulgaria and Romania.
The monthly mean contribution of each cluster to the total aerosol optical depth is shown in Fig. 7. Aerosol optical depths corresponding to trajectories of cluster 4 are
20
high during all months, but mainly in the summer (summer mean = 0.64) and they dominate the long term monthly means of AOD (thick black line). The mean AOD for cluster 1 is about 0.24. About one third of the cases of this cluster are found in winter, when cloudless skies are usually associated with northern winds that transport air masses with low aerosol content, confirming earlier results by Amiridis et al. (2005).
ACPD
7, 537–567, 2007Aerosol optical depth variability in an urban environment S. Kazadzis et al. Title Page Abstract Introduction Conclusions References Tables Figures ◭ ◮ ◭ ◮ Back Close
Full Screen / Esc
Printer-friendly Version Interactive Discussion
EGU
6 Analysis of the PM-10 measurements
The PM-10 measurements conducted by the municipality of Thessaloniki are used to investigate the tendencies of the aerosols in the lower boundary layer of Thessaloniki. Daily means were calculated for all four stations in the period 1997–2005, which were then combined to form monthly mean values of PM-10.
5
The upper panel of Fig. 8 shows the deseasonalized 9-year long monthly means of the PM10 concentration for each station. The de-seasonalization was done by normal-izing (dividing) each monthly mean with the 1997–2005 normal. On the same figure, the average of the monthly mean departures from all stations is also shown. A negative change is evident at all stations ranging from –2% to –5.6% per year. For the average
10
of all stations, the linear change is –3.3% per year.
The overall change for the PM-10 concentrations in Thessaloniki calculated from measurements starting in the late 1980s is negative although there are differences in the magnitude among the stations. This is more apparent for the stations influenced by traffic emissions and less for the urban ones. This remark is of high importance, since
15
during the period 1989–2003 there has been a significant increase in the pollution load of the city, mainly due to an increase of about 70% in the fleet of the vehicles. However, during this period in the city centre the decrease is approximately 22% for PM10 con-centrations, whereas for the other primary pollutants is much larger (50% for CO, 47% for SO2 and 30% for NO). This positive development is due to a series of measures
20
that had been taken during the 1990s concerning many aspects of the city activities (Petrakakis et al., 2005). Such measures were the usage in the industry of crude oil with low sulphur content, the improvement of fuel quality (total ban of leaded fuel), the renewal of the fleet with vehicles using anti-pollution technology, the introduction of the annual check in the exhausts control and finally measures related with the city
infras-25
tructure such as the construction and function of the ring road and extensive usage of mechanical besoms for road and pavement cleaning.
ACPD
7, 537–567, 2007Aerosol optical depth variability in an urban environment S. Kazadzis et al. Title Page Abstract Introduction Conclusions References Tables Figures ◭ ◮ ◭ ◮ Back Close
Full Screen / Esc
Printer-friendly Version Interactive Discussion
EGU aerosol load (Voutsa et al., 2002) and the columnar amount of the aerosols is
dom-inated by those found in the first 2–3 km (e.g. Amiridis et al., 2005). Therefore it is reasonable to expect that the PM10 concentration is a major contributor to the total column of the aerosol optical depth over Thessaloniki. The long-term changes found in the PM10 concentration, agree quite well with the linear change (ranging between
5
–2.2 and –3.1 % for different wavelengths) that was calculated for the AOD as derived from the spectroradiometric measurements (see lower panel of Fig. 8).
7 Summary and conclusions
Nine years (1997–2005) of direct sun spectral measurements at Thessaloniki, Greece, were used for the determination of the spectral aerosol optical depth AOD in the UV-B
10
and UV-A parts of the solar spectrum, as well as of the Angstrom exponent.
Measurements of the AOD retrieved from two Brewer spectroradiometers and a CIMEL sun-photometer were compared showing generally good agreement. The mean absolute difference between AOD measurements in the UV-B from the dou-ble monochromator Brewer MKIII and the single monochromator Brewer MKII is ∼5%
15
(with an R2 of 0.937), although the two instruments used different procedures for the their calibration and AOD retrieval. Very good agreement was found between mea-surements of AOD at 340 nm derived from Brewer MKIII and from the CIMEL (mean absolute difference ∼4% with R2=0.982)
Long term monthly means of AOD at 340 nm at Thessaloniki show a seasonal
varia-20
tion with maximum optical depth values in the summer months (AOD=0.52 in August), and minimum in wintertime (AOD=0.28 in December). Another study using different instruments and techniques showed similar results for even smaller periods of data (Gerasopoulos et al., 2003).
The analysis of back trajectories showed that the contribution of air masses coming
25
from the North and North Eastern directions result in high aerosol loads over Thes-saloniki, while minimum AOD is associated with airmasses originating in the Atlantic
ACPD
7, 537–567, 2007Aerosol optical depth variability in an urban environment S. Kazadzis et al. Title Page Abstract Introduction Conclusions References Tables Figures ◭ ◮ ◭ ◮ Back Close
Full Screen / Esc
Printer-friendly Version Interactive Discussion
EGU ocean.
The AOD measurements derived from Brewer MKIII during the period 1997–2005 show a trend of about –2.2% per year at 320 nm and –3.1% per year at 340 nm. Simi-lar decreasing tendency has been found in the PM10 aerosol concentrations from the data of the network of the Municipality of Thessaloniki (Petrakakis et al., 2005). Both
5
datasets suggest that the air quality in Thessaloniki is improving, compared with the situation during the 1990s, resulting in cleaning of the lower atmosphere in Thessa-loniki. However, the absolute values of both optical depth and PM10 concentrations during the last decade are still high. This observed decrease in the aerosol amounts is expected to have a direct effect on the solar irradiance levels reaching the ground
10
(Garane et al., 2005).
To conclude, the aerosols found over Thessaloniki result from different sources, com-prising of a marine component, a mineral dust component (outbreaks of Saharan dust and local dust suspension) and an anthropogenic component. High aerosol optical depths may occur during the presence of either absorbing or non-absorbing particles
15
and hence information from various instruments are necessary in order to assess prop-erly the detailed nature and the optical properties of such a complex aerosol mixture.
Acknowledgements. This work has been conducted partly in the framework of the projects “SCOUT-O3” funded by the European Commission, and “Environmental Impacts of Atmo-spheric Aerosol Particles- Pythagoras I” funded by the Greek Secretariat of Research and
20
Technology. S. Kazadzis acknowledges the financial support of the Greek Scholarships Foun-dation (2005–2006, IKY).
References
Ackerman, A. S., Toon, O. B., Taylor, J. P., Johnson, D. W., Hobbs, P. V., and Ferek, R. J.: Effects of aerosols on cloud albedo: Evaluation of Twomey’s parametrization of cloud susceptibility
25
using measurements of ship tracks, J. Atmos. Sci., 57 2684–2695, 2000.
Amiridis, V., Balis, D. S., Kazadzis, S., Bais, A., Giannakaki, E., Papayannis, A., and Zerefos, C.: Four-year aerosol observations with a Raman lidar at Thessaloniki, Greece, in the framework
ACPD
7, 537–567, 2007Aerosol optical depth variability in an urban environment S. Kazadzis et al. Title Page Abstract Introduction Conclusions References Tables Figures ◭ ◮ ◭ ◮ Back Close
Full Screen / Esc
Printer-friendly Version Interactive Discussion
EGU
of European Aerosol Research Lidar Network (EARLINET), J. Geophys. Res., 110(D21), D21203, doi:10.1029/2005JD006190, 2005.
Anderson, T. L., Charlson R. J., Schwartz S. E., Knutti R., Boucher O., Rodhe H., and Heintzen-berg J.: Climate forcing by aerosols – A hazy picture, Science, 300, 1103–1104, 2003a. Arola, A. and Koskela, T.: On the sources of bias in aerosol optical depth retrieval in the UV
5
range, J. Geophys. Res. D. Atmos., 109(D8), D08209, doi:10.1029/2003JD004375, 2004 Bais, A. F.: Absolute spectral measurements of the direct solar ultraviolet irradiance using a
Brewer spectrophotometer, Appl. Opt., 36, 5199–5204, 1997.
Balis, D. S., Amiridis, V., Zerefos, C., Gerasopoulos, E., Andreae, M., Zanis, P., Kazantzidis, A., Kazadzis, S., and Papayannis A.: Raman lidar and sunphotometric measurements of
10
aerosol optical properties over Thessaloniki, Greece during a biomass burning episode, At-mos. Environ., 37, 4529–4538, 2003.
Balis, D. S., Amiridis, V., Nickovic, S., Papayannis, A., and Zerefos, C.: Optical properties of Saharan dust layers as detected by a Raman lidar at Thessaloniki, Greece. Geophys. Res. Lett., 31, L13104, doi:10.1029/2004GL019881, 2004.
15
Barnaba, F. and Gobbi, G. P.: Modeling the aerosol extinction versus backscatter relationship for lidar applications: maritime and continental conditions, J. Atmosp. Oc., 21, 428–442, 2004.
Bass, A. M. and Paur, R. J.: The ultraviolet cross-section of ozone: I. The measurements, in: Atmospheric Ozone, Proc. Quadrennial Ozone Symposium, edited by: Zerefos, C. S. and
20
Ghazi, A., 601–606, Reidel publ., 1985.
Boucher, O. and Anderson, T. L.: GCM assessment of the sensitivity of direct climate forcing by anthropogenic sulphate aerosols to aerosol size and chemistry, J. Geophys. Res., 100, 26 117–26 134, 1995.
Cede, A., Kazadzis S., Kowalewski M., Bais A., Kouremeti N., Blumthaler M., and Herman
25
J.: Correction of direct irradiance measurements of Brewer spectrophotometers due to the effect of internal polarization, Geophys. Res. Lett., 33, L02806, doi:10.1029/2005gl024860, 2006
Charlson, R. J., Langner, J., Rodhe, H., Leovy, C. B., and Warren, S. G.: Perturbation of the northern hemisphere radiative balance by scattering from anthropogenic sulphate aerosols,
30
Tellus A, 43, 152–163, 1991.
Charlson, R. J., Schwartz, S. E., Hales, J. M., Cess, R. D., Coakley, J. A., Hansen, J., and Hofmann, D. J.: Climate forcing by anthropogenic aerosols, Science, 255, 423–430, 1992.
ACPD
7, 537–567, 2007Aerosol optical depth variability in an urban environment S. Kazadzis et al. Title Page Abstract Introduction Conclusions References Tables Figures ◭ ◮ ◭ ◮ Back Close
Full Screen / Esc
Printer-friendly Version Interactive Discussion
EGU
Cheymol, A. and de Backer, H.: Retrieval of the aerosol optical depth in the UV-B at Uccle from Brewer ozone measurements over a long time period 1984–2002, J. Geophys. Res. D. Atmos., 108(D24), 4800, doi:10.1029/2003JD003758, 2003.
Coakley, J. A., Cess, R. D., and Yurevich, F. B.: The effect of tropospheric aerosols on the Earth’s radiation budget: a parameterization for climate models, J. Atmos. Sci., 40, 116–138,
5
1983.
di Sarra, A., Cacciani, M., DeLuisi, J., et al.: “Desert aerosol in the Mediterranean”, in: “Mediter-ranean Climate: Variability and Trends”, edited by: Bolle, H.-J., Springer-Verlag, 309–315, 2003.
Dorling, S., Davies, T., and Pierce, C.: Cluster analysis: A technique for estimating the synoptic
10
meteorological controls on air and precipitation chemistry—Method and applications, Atmos. Environ. Part A, 26, 2575–2581, 1992.
Draxler, R. R. and Hess, G. D.: Description of the HYSPLIT 4 modeling system, NOAA Tech. Memo. ERL ARL-224, 24 pp., NOAA, Silver Spring, Md, 1997.
Formenti, P., Andreae, M. O., Andreae, T. W., Galani, E., Vasaras, A., Zerefos, C., Amiridis, V.,
15
Orlovsky, L., Karnieli, A., Wendisch, M., Wex, H., Holben, B. N., Maenhaut, W., and Lelieveld, J.: Aerosol optical properties and large scale transport of air masses: Observations at a coastal and a semiarid site in the eastern Mediterranean during summer 1998, J. Geophys. Res., 106, 9807–9826, 2001.
Formenti, P., Reiner, O., Sprung, D., Andreae, M. O., Wendisch, M., Wex, H., Kindred, D.,
20
Dewey, K., Kent, J., Tzortziou, M., Vasaras, A., and Zerefos, C.: The STAAARTE-MED 1998 summer airborne measurements over the Aegean Sea: 1. Aerosol particles and trace gases, J. Geophys. Res., 107, 4450, doi:10.1029/2001JD001337, 2002a.
Garane K., Bais, A. F., Tourpali, K., Meleti, C., Zerefos, C., and Kazadzis, S.: Variability of spectral UV irradiance at Thessaloniki, Greece, from 15 years measurement, Proceedings
25
of SPIE – The International Society for Optical Engineering, 5886, 1–10, 2005
Gerasopoulos, E., Andreae, M. O., Zerefos, C., Andreae, T. W., Balis, D., Formenti, P., Merlet, P., Amiridis, V., and Papastefanou, C.: Climatological aspects of aerosol optical properties in Northern Greece, Atmos. Chem. Phys., 3, 2025–2041, 2003,
http://www.atmos-chem-phys.net/3/2025/2003/.
30
Groebner, J. and Meleti, C.: Aerosol optical depth in the UVB and visible wavelength range from Brewer spectrophotometer direct irradiance measurements: 1991–2002, J. Geophys. Res., 25(109), D09202, doi:10.1029/2003JD004409, 2004.
ACPD
7, 537–567, 2007Aerosol optical depth variability in an urban environment S. Kazadzis et al. Title Page Abstract Introduction Conclusions References Tables Figures ◭ ◮ ◭ ◮ Back Close
Full Screen / Esc
Printer-friendly Version Interactive Discussion
EGU
Hansen, J. E. and Travis, L. D.: Light scattering in planetary atmospheres, Space Sci. Rev., 16, 257–610, 1974.
Holben, B. N., Eck, T. F., Slutsker, I., et al.: AERONET – A federated instrument network and data archive for aerosol characterization, Remote Sens. Environ., 66, 1–16, 1998.
Intergovernmental Panel on Climate Change (IPCC): Climate Change 2001: The Scientific
5
Basis. Contribution of Working Group I to the Third Assessment of the Intergovernmental Panel on Climate Change, Cambridge Univ. Press, New York, 2001.
Jaroslawski, J., Krzyscin, J. W, Puchalski, S., and Sobolewski, P.: On the optical thickness in the UV range: Analysis of the ground-based data taken at Besk, Poland, J. Geophys. Res., 108(D23), 4722, doi:10.1029/2003JD003571, 2003.
10
Kazadzis, S., Bais, A., Kouremeti, N., Gerasopoulos, E., Garane, K., Blumthaler, M., Schallhart, B., and Cede, A.: Direct spectral measurements with a Brewer spectroradiometer: Absolute calibration and aerosol optical depth retrieval, Appl. Opt., 44(9), 1681–1690, 2005.
Kerr, J. B., McElroy, C. T., and Olafson, R. A. Measurements of ozone with the Brewer ozone spectrophotometer Quadrennial International Ozone Symposium, Boulder, CO; International
15
Organization; 4–9 Aug. 1980, 4–79, 1981
Kiehl, J. T. and Rodhe, H.: Modeling geographical and seasonal forcing due to aerosols, in: Aerosol Forcing of Climate, edited by: Charlson, R. J. and Heintzenberg, J., 281–296, J. Wiley, New York, 1995.
Kirchhoff, V. W. J. H., Silva, A. A., Costa, C. A., Paes Leme, N., Pava ˜o, H. G., and Zaratti, F.:
20
UV-B optical thickness observations of the atmosphere, J. Geophys. Res., 106, 2963–2973, 2001.
Koren, I., Kaufman, Y. J., Remer, L. A., and Martins, J. V.: Measurement of the effect of Amazon smoke on inhibition of cloud formation, Science, 303(5662), 1342–1345, 2004.
Lelieveld, J., Berresheim, H., Borrmann, S., Crutzen, P. J., Dentener, F. J., Fischer, H.
Fe-25
ichter,J., Flatau, P. J., Heland, J., Holzinger, R., Korrmann, R., Lawrence, M. G., Levin, Z., Markowicz, K. M., Mihalopoulos, N., Minikin, A., Ramanathan, V., de Reus, M., Roelofs, G. J., Scheeren, H. A., Sciare, J., Schlager, H., Schultz, M., Siegmund, P., Steil, B., Stephanou,E. G., Stier, P., Traub,M., Warneke, C., Williams, J., and Ziereis, H.: Global air pollution cross-roads over the Mediterranean, Science, 298, 794–799, 2002.
30
Lelieveld, J., Berresheim, H., Borrmann, S., et al.: Global air pollution crossroads over the Mediterranean, Science, 298, 794–799, 2002.
ACPD
7, 537–567, 2007Aerosol optical depth variability in an urban environment S. Kazadzis et al. Title Page Abstract Introduction Conclusions References Tables Figures ◭ ◮ ◭ ◮ Back Close
Full Screen / Esc
Printer-friendly Version Interactive Discussion
EGU
B., Yitzchaki, A., and Seter, I.: Atmospheric sulfur over the east Mediterranean region, J. Geophys. Res, 101, 25 917–25 930, 1996.
Marenco, F., Di Sarra, A., and De Luisi, J.: Methodology for determining aerosol optical depth from Brewer 300–320 nm ozone measurements, Appl. Opt., 41, 1805–1814, 2002.
Marenco, F., Santacesaria, V., Bais, A. F., Balis, D., Di Sarra, A., Papayannis, A., and Zerefos, C.
5
S.: Optical properties of tropospheric aerosols determined by lidar and spectrophotometric measurements (PAUR campaign), Appl. Opt., 36, 6875–6886, 1997.
Mattis, I., Jaenisch, V., Muller, D., Franke, K., and Ansmann, A.: Classification of particle extinc-tion profiles derived within the framework of the German lidar network by the use of cluster analysis of backtrajectories, in: Lidar Remote Sensing of the Atmosphere, edited by: Dabas,
10
A., Loth, C., and Pelon, J., 211–214, Ed. Ecole Polytech., Palaiseau, France, 2000.
Meleti, C. and Cappellani F.: Measurements of aerosol optical depth at Ispra: Analysis of the correlation with UV-B, UV-A, and total solar irradiance, J. Geophys. Res., 105, 4971–4978, 2000.
Michalsky, J. J., Schlemmer, J. A., Berkheiser, W. E., Berndt, J. L., Harrison, L. C., Laulainen,
15
N. S., Larson, and N. R., Barnard, J. C.: Multiyear measurements of aerosol optical depth in the Atmospheric Radiation Measurement and Quantitative Links programs, J. Geophys. Res., 106, 12 099–12 107, 2001.
Mihalopoulos, N., Stephanou, E., Kanakidou, M., Pilitsidis, S., and Bousquet, P.: Tropospheric aerosol ionic composition in the eastern Mediterranean region, Tellus B, 49, 314–326, 1997.
20
Moulin, C., Lambert, C. E., Dulac, F., and Dayan, U.: “Control of atmospheric export of dust from North Africa by the North Atlantic oscillation”, Nature, 387, 691–694, 1997.
Papayannis A., Balis, D., Bais, A., van der Bergh, H., Calpini, B., Durieux, E., Fiorani, L., Jaquet, L., Ziomas, I., and Zerefos, C. S.: The role of urban and suburban aerosols on solar UV radiation over Athens, Greece, Atmos. Environ, 32, 2193–2201, 1998.
25
Papayannis, A., Balis, D., Amiridis, V., et al.: Measurements of Saharan dust aerosols over the eastern Mediterranean using elastic backscatter-Raman lidar, spectrophotometric and satellite observations in the frame of the EARLINET project, Atmos. Chem. Phys., 5, 2065– 2079, 2005,
http://www.atmos-chem-phys.net/5/2065/2005/.
30
Petrakakis, M., Kelesis, A., Tzoumaka, P., Tsougas, M., Tzourelis, G., and Zoumakis, N.: Long term variation of the PM10 concentration levels in Thessaloniki, HELLECO 05, O-A72, Athens, 2005.
ACPD
7, 537–567, 2007Aerosol optical depth variability in an urban environment S. Kazadzis et al. Title Page Abstract Introduction Conclusions References Tables Figures ◭ ◮ ◭ ◮ Back Close
Full Screen / Esc
Printer-friendly Version Interactive Discussion
EGU
Pinker, R. T., Ferrare, R. A., Karnieli, A., Aro, T. O., Kaufman, Y. J., and Zangvil, A.: Aerosol optical depths in a semiarid region, J. Geophys. Res., 102, 1123–1137, 1997.
Ramanathan, V., Crutzen, P. J., Kiehl, J. T., and Rosenfeld, D.: Aerosols,climate, and the hydrological cycle, Science, 294, 119–2124, 2001.
Rosenfeld, D. and Lensky, I. M.: Satellite-based insights into precipitation formation processes
5
in continental and maritime convective clouds, Bull. Am. Meteorol. Soc., 79, 2457–2476, 1998.
Salisbury, G. , Williams, J., Holzinger, R., Gros, V., Mihalopoulos, N., Vrekoussis, M., Sarda-Est `eve, R., Berresheim, H., von Kuhlmann, R., Lawrence, M., and Lelieveld, J.: Ground-based PTR-MS measurements of reactive organic compounds during the MINOS campaign
10
in Crete, July–August 2001 Atmos. Chem. Phys., 3, 925–940, 2003,
http://www.atmos-chem-phys.net/3/925/2003/.
Twomey, S.: The influence of pollution on the shortwave albedo of clouds, J. Atmos. Sci., 34, 1149–1152, 1977.
Van Hoosier, M. E.: “The Atlas-3 solar spectrum,” available via anonymous ftp (ftp://susim.nrl.
15
navy.mil), 1996.
Vasaras, A., Bais, A. F., Feister, U., and Zerefos, C. S.: Comparison of two methods for cloud flagging of spectral UV measurements, Atmos. Res., 57/1, 31–42, 2001.
Voutsa, D., Samara, C., Kouimtzis, Th., and Ochsenkuhn, K.: Elemental composition of air-borne particulate matter in the multi-impacted urban area of Thessaloniki, Greece Atmos.
20
Environ. 36, 4453–4462, 2002.
Yu, H., Liu, S. C., and Dickinson, R. E.: Radiative effects of aerosols on the evolution of the at-mospheric boundary layer, J. Geophys. Res., 107(D12), 4142, doi:10.1029/2001JD000754, 2002.
Zerefos, C. S., Ganev, K., Kourtidis, K., Tzortziou, M., Vasaras, A., and Syrakov, E.: On the
25
ACPD
7, 537–567, 2007Aerosol optical depth variability in an urban environment S. Kazadzis et al. Title Page Abstract Introduction Conclusions References Tables Figures ◭ ◮ ◭ ◮ Back Close
Full Screen / Esc
Printer-friendly Version Interactive Discussion
EGU
Table 1. Mean and standard deviation of the columnar aerosol optical depth measured at
Thessaloniki for different seasons during the period 1997–2005. Season Mean AOD at 340 nm and (1σ) Winter 0.33±0.14
Autumn 0.39±0.22 Spring 0.43±0.21 Summer 0.53±0.17
ACPD
7, 537–567, 2007Aerosol optical depth variability in an urban environment S. Kazadzis et al. Title Page Abstract Introduction Conclusions References Tables Figures ◭ ◮ ◭ ◮ Back Close
Full Screen / Esc
Printer-friendly Version Interactive Discussion
EGU
Table 2. Aerosol characteristics for the five clusters of back trajectories.
Cluster Mean AOD Standard Occurrence (%) Winter % Summer % number at 340 nm deviation 1 0.24 0.12 14 32 5 2 0.46 0.21 27 27 38 3 0.38 0.17 18 15 19 4 0.59 0.16 15 12 21 5 0.47 0.18 16 14 17
ACPD
7, 537–567, 2007Aerosol optical depth variability in an urban environment S. Kazadzis et al. Title Page Abstract Introduction Conclusions References Tables Figures ◭ ◮ ◭ ◮ Back Close
Full Screen / Esc
Printer-friendly Version Interactive Discussion EGU 0.0 0.4 0.8 1.2 CIMEL sun-photometer 0.0 0.4 0.8 1.2 Bre w e r MK II I Y = 1.008 * X + 0.019 Data points used = 475 R-squared = 0.981753
AOD at 340 nm
Fig. 1. Comparison of AOD at 340 nm retrieved by the Brewer MKIII spectroradiometer and the
ACPD
7, 537–567, 2007Aerosol optical depth variability in an urban environment S. Kazadzis et al. Title Page Abstract Introduction Conclusions References Tables Figures ◭ ◮ ◭ ◮ Back Close
Full Screen / Esc
Printer-friendly Version Interactive Discussion EGU 0.0 0.4 0.8 1.2 Brewer MKII 0.0 0.4 0.8 1.2 Br e w e r M K II I Y = 0.9618 * X + 0.0005
Number of data points used = 2982 R-squared = 0.937
AOD at 320 nm
Fig. 2. Comparison of AOD at 320 nm retrieved by the Brewer MKIII and the Brewer MKII
ACPD
7, 537–567, 2007Aerosol optical depth variability in an urban environment S. Kazadzis et al. Title Page Abstract Introduction Conclusions References Tables Figures ◭ ◮ ◭ ◮ Back Close
Full Screen / Esc
Printer-friendly Version Interactive Discussion EGU 1996 1998 2000 2002 2004 2006 TIME (Years) 0.25 0.50 0.75 0.25 0.50 0.75 Ae ro so l O p ti ca l D e p th a t 3 2 0 n m Brewer MKIII Brewer MKII
Fig. 3. Monthly mean AOD at 320 nm for the period 1997–2006, derived from the MKIII (upper
ACPD
7, 537–567, 2007Aerosol optical depth variability in an urban environment S. Kazadzis et al. Title Page Abstract Introduction Conclusions References Tables Figures ◭ ◮ ◭ ◮ Back Close
Full Screen / Esc
Printer-friendly Version Interactive Discussion EGU < 0.1 0.1-0.2 0.2-0.3 0.3-0.4 0.4-0.5 0.5-0.6 0.6-0.7 0.7-0.8 0.8-0.9 0.9-1.0 >1 AOD bins 0 4 8 12 16 20 F re q u e n c y o f A O D o c c u re n c e s ( % ) < 0.1 0.1-0.2 0.2-0.3 0.3-0.4 0.4-0.5 0.5-0.6 0.6-0.7 0.7-0.8 0.8-0.9 0.9-1.0 >1 AOD bins -10 -5 0 5 10 D e p a rt u re s f ro m n o rm a l (% ) spring summer automn winter
Fig. 4. Frequency distribution (in percent) of AOD at 340 nm occurrences in bins of 0.1 (left).
ACPD
7, 537–567, 2007Aerosol optical depth variability in an urban environment S. Kazadzis et al. Title Page Abstract Introduction Conclusions References Tables Figures ◭ ◮ ◭ ◮ Back Close
Full Screen / Esc
Printer-friendly Version Interactive Discussion
EGU
Jan Feb Mar Apr May Jun Jul Aug Sep Oct Nov Dec
0.2 0.4 0.6 0.8 a e ro s o l o p ti ca l d e p th a t 3 2 0 n m 1.2 1.6 2.0 a n g st ro m e x p o n e n t single monochromator double monochromator
Fig. 5. (Upper panel) Monthly mean AOD at 320 nm and standard deviation (±1σ) as
mea-sured by the MKIII Brewer spectroradiometer over Thessaloniki for the period 1997–2005. The dashed line corresponds to the measurements derived from the MKII Brewer. (Lower panel) Monthly mean and standard deviation of the Angstr ¨om exponent, a, derived from Brewer MKIII data in the same period.
ACPD
7, 537–567, 2007Aerosol optical depth variability in an urban environment S. Kazadzis et al. Title Page Abstract Introduction Conclusions References Tables Figures ◭ ◮ ◭ ◮ Back Close
Full Screen / Esc
Printer-friendly Version Interactive Discussion EGU Cluster 1 Cluster 2 Cluster 3 Cluster 4 Cluster 5 Cluster 1 Cluster 2 Cluster 3 Cluster 4 Cluster 5
Fig. 6. Four-day back trajectories corresponding to for all AOD measurements conducted
at Thessaloniki during the period 1997–2005, grouped in different clusters, representing air masses with similar characteristics and originating from similar directions. The bottom-right panel shows the seed trajectories for all clusters.
ACPD
7, 537–567, 2007Aerosol optical depth variability in an urban environment S. Kazadzis et al. Title Page Abstract Introduction Conclusions References Tables Figures ◭ ◮ ◭ ◮ Back Close
Full Screen / Esc
Printer-friendly Version Interactive Discussion
EGU
Jan Feb Mar Apr May Jun Jul Aug Sep Oct Nov Dec Months 0.00 0.20 0.40 0.60 0.80 Me a n AO D a t 3 4 0 n m Clusters
#1 North West (Atlantic) #2 North
#3 West #4 East, North-East
#5 Western, Local and Saharan dust Mean AOD
Fig. 7. Monthly mean AOD for each cluster during the period 1997–2005. The thick black line
ACPD
7, 537–567, 2007Aerosol optical depth variability in an urban environment S. Kazadzis et al. Title Page Abstract Introduction Conclusions References Tables Figures ◭ ◮ ◭ ◮ Back Close
Full Screen / Esc
Printer-friendly Version Interactive Discussion EGU 1996 1997 1998 1999 2000 2001 2002 2003 2004 2005 2006 YEAR 0.5 1.0 1.5 D e se a s o n a liz e d P M -1 0 m o n th ly me a n 0.4 0.6 0.8 1.0 1.2 1.4 1.6 D e se a s o n a liz e d m o n th ly m e a n A O D a t 3 4 0 n m
Fig. 8. Upper Panel: Deseasonalized monthly mean PM10 aerosol concentration (solid circles)
at Thessaloniki. Smaller symbols are monthly means at each of the four aerosol monitoring sta-tions of the Municipality Network. Lower Panel: Deseasonalized monthly mean AOD (crosses) measured at Thessaloniki with Brewer MKIII.