Development and Assessment of a Soot Emissions Model for
Aircraft Gas Turbine Engines
by
Bastien Martini
Diplom6 de l'Ecole Polytechnique (2008) Ecole Polytechnique, Palaiseau, France
Submitted to the Department of Aeronautics and Astronautics in Partial Fulfillment of the requirements for the degree of
Master of Science in Aeronautics and Astronautics At the
MASSACHUSETTS INSTITUTE OF TECHNOLOGY
Dvuye aooo?] MARCH 2008
C 2008 Massachusetts Institute of Technology. All rights reserved.
The author hereby grants to MIT permission to reproduce and to distribute publicly paper and electronic copies of this thesis document in whole or in part.
Signature of Author...
Department of Aerautics and Astronautics
of MrMch 2008
Certified by... ... .. ... .. .... ... aitz
Jerome C. Hunsaker Professor and Depa' nt Head Aeronautics and Astronautics
f",
f
hesi Supervisor
Accepted by... ... .... . ...Prof. D vid . Darmofal
AssociateDepartment Head Chair, Committee on Graduate Students
Development and Assessment of a Soot Emissions Model for
Aircraft Gas Turbine Engines
by
Bastien Martini
Submitted to the Department of Aeronautics and Astronautics on March 27, 2008 in Partial Fulfillment of the
Requirements for the Degree of Master of Science in Aeronautics and Astronautics
Abstract
Assessing candidate policies designed to address the impact of aviation on the environment requires a simplified method to estimate pollutant emissions for current and future aircraft gas turbine engines under different design and operating assumptions. A method for NOx and CO emissions was developed in a previous research effort. This thesis focuses on the addition of a soot mechanism to the existing model. The goal is to estimate soot emissions of existing gas turbine engines within soot measurement uncertainties, and then to use the method to estimate the performance of potential future engines.
Soot is non-volatile primary particulate matter. In gas turbine engines the size rarely exceeds l [tm. The soot is composed almost exclusively of black carbon, is an aggregate of nearly spherical carbon primary particles, and exhibits fractal behavior. Results of other studies regarding soot nucleation, growth, oxidation, and coagulation rates are integrated within a network of perfectly-stirred reactors and shown to capture the typical evolution of soot inside a gas turbine combustor, with soot formed in the early parts of the combustor and then oxidized.
The soot model shows promising results as its emissions estimates are within the measurement uncertainties. Nevertheless, model uncertainties are high. They are the consequence of the large sensitivity to input variables. Therefore, the validity of the model is limited to cases with available engine data. More engine data are needed to develop and assess the soot model.
Thesis Supervisor: Ian Anton Waitz
Title: Jerome C. Hunsaker Professor of Aeronautics and Astronautics and Head of the Aeronautics and Astronautics Department
Acknowledgements
There are many people that I want to thank for my research at MIT. First, I cannot express enough gratitude to Pr. Waitz who made this project possible. He trusted me and showed me encouragement and patience even when I struggled. He was always here to answer my emails and give great orientations to my research. His workload is impressive and I still do not know how he has been able to carry out all his tasks and still have time to advice me. I am sorry for the numerous times I spammed him.
I also want to thank Pr. Willcox. She is co-director of the project and always gave me great advice. I am also glad she loves Annecy (my home town in France) so much. Other professors such as Pr. Jacobson and Dr. Dobbins from Brown University participated at one point to my work and I thank them for it.
Joe Palladino was of great help during all my research at MIT. His aircraft engine knowledge is tremendous and his help was precious. I cannot thank him enough.
I also want to express my gratitude to all the people who helped me during my research and I apologize for not being able to list them all. Dr. Jim Hileman was always here to take a coffee break to talk, Julien helped me get into PARTNER, Anuja loved talking about babies, Chris S. never took more than 5 minutes to answer my emails, and I had great talks with Tim and Phil from EDS.
Then, my friends made a great time at MIT wonderful. My coworker, the best person I have ever met at MATLAB®, helped me on my research, helped me to understand a mumbling Bostonian, to show me the U.S., to make me fly, to make me love football and so many other things that it would take a thesis to list them all. Jim did it too, being always present to help my wife and I, to play football, to laugh to my bad jokes and so many other things that I forget. Melissa, Michelle, Alex, Ana, the French
guys made me have a great time in Boston.
Finally, I cannot thank enough my wife Adeline and my son Clement. My wife has accepted to come to Boston and set aside her career to live with me. She was always here to cheer me up and to make me understand that there is something else than studies and sport. She also gave me the best present I ever got: my son.
Table of Contents
Abstract ... 3 Acknowledgem ents ... 5 Table of Contents ... 7 List of Tables ... 9 List of Figures... 11 N om enclature... 15 List of Acronym s ... ... 17 Introduction... 19 1.1. APM T and ED S... ... 20 1.2. Research m otivation ... 21 1.3. Em ission Regulation... 21 1.4. Sm oke N um ber... ... 23 1.5. Previous W ork... ... 24 1.6. Thesis Objective ... ... 261.7. Organization of the Thesis ... 27
Particulate M atter (PM ) ... 29
2.1. Definition and Classification... 29
2.2. Health and Climate Issues Related to PM...31
2.3. Measurement of Non-Volatile PM for Aircraft Engines ... 32
Soot Form ation... 35
3.1. Soot Properties ... .35
3.2. Soot Formation Pathway in Aircraft Combustors ... . 37
3.2.1. Precursors ... . 38
3.2.2. N ucleation ... ... 41
3.2.3. Growth, Oxidation, and Coagulation ... 42
3.3. Modeling Rates of Soot Formation inside the Combustor... 44
3.3.1. Nucleation ... 45
3.3.3. Oxidation Mechanism ... ... 53
3.3.4. Coagulation Mechanism... 56
3.3.5. Lindstedt's M odel ... 56
3.3.6. Modeling Summary ... 57
3.4. Discussion of the Physical Parameters Impacting Soot Formation... 58
Insertion of the Soot Model ... 61
4.1. The Combustor Model ... 61
4.2. Computation of Soot Emissions in PSRs and PLUGs... 64
4.2.1. Soot Modeling Integral Equations ... ... 65
4.2.2. Relation between Soot Flows and Soot Densities ... 67
4.2.3. Soot Equations System... 68
4.3. Chemical Kinetics Models ... 69
Results D iscussion... ... 71
5.1. Selection of the Soot M odel ... ... 71
5.1.1. Selection of the Kinetics Model ... ... 71
5.1.2. Choice of the Soot Formation Model... 72
5.1.3. Selection of the Unmixedness Representation ... 74
5.1.4. Choice of the Fuel Model and Aromatics Representation ... 80
5.2. Correction of the Model... 82
5.3. Problems of Sensitivity to Input Variables ... ... 86
5.3.1. Sensitivity Correction and New Results ... .. 89
5.3.2. Interpretation and Precision Estimation of the Model ... 92
C onclusion ... ... 97
A ppendixes ... 99
List of Tables
Table 1 - Major PM compounds found in aircraft exhaust ... 31
Table 2 - Assumed air-to-fuel ratios by power setting ... .34
Table 3 -Examples of simple PAHs... 39
Table 4 -Representative Chemical Limits for Aircraft fuels ... 40
Table 5 - Soot reaction mechanism from Colket and Hall with a reaction rate of k = A .exp(-E/(R T)) ... ... 49
Table 6 - Soot reaction mechanism from Kazakov et al. with a reaction rate of k = A .Tn.exp(-E/(R T))... 51
Table 7 -Extrapolation of aFW(T) ... 52
Table 8 - Comparison of HACA and Lindstedt's models for mass soot rates ... 57
Table 9 - Comparison of HACA and Lindstedt's models for particle soot rates ... 57
Table 10 - PW4090 and CFM56-2 models: maximum equivalence ratios for the 4 ICAO points ... 80
Table 11 - Soot model elasticity of input variables for the PW4090 engine ... 86
Table 12 - Multiplicative coefficients applied to the mass and particle soot rates found in paragraph 3.3.6 ... ... 90
List of Figures
Figure 1 -SFC and Smoke Number improvements for aircraft engines ... 19
Figure 2 - APMT Architecture Overview4. ....... ... .. . . .. . . .. . ... . . . 21
Figure 3 -Landing and Take-Off Cycle... 22
Figure 4 - Inputs and outputs of the combustor model... ... 25
Figure 5 - Schematic of Allaire's network reactor model7 ... .. ... . ... .. . 26
Figure 6 - TEM photographs of soot aggregates at maximum soot volume fraction location along the axis of different flames, showing the texture of soot particles ... 36
Figure 7 - Structure of a soot primary particle ... ... 37
Figure 8 - Sooting effects of aromatics and hydrogen fuel content (from A. Lefebvre, Gas Turbine Com bustion) ... 40
Figure 9 - Micrographs of soot particles captured on carbon grids, from an ethene diffusion flame. The transition from precursor particles to soot aggregates occurs between Z = 30 and 40 m m ... 42
Figure 10 - Typical TEM photographs of soot aggregates along the axis of the ethylene-fueled laminar jet diffusion flame burning in air at atmospheric pressure38: ... 43
Figure 11 - Soot form ation path ... 44
Figure 12 - Nucleation energy activation estimation for HACA model for laminar prem ixed and diffusion flam es ... ... ... ... ... .... . . 47
Figure 13 - Soot surface growth rates (corrected for soot surface oxidation) in terms of the HACA mechanism of Colket and Hall for laminaro flames at atmospheric pressure (from ) . ... . . 50
Figure 14 - Estim ation off(T)3 1 ... 53 Figure 15 - Collision efficiencies as a function of distance from the burner exit, assuming that soot surface oxidation is only due to attack by OH (from 34)... 56
Figure 16 - Different areas inside the combustor... 63
Figure 17 - Functional outline of the combustor model ... 64
Figure 19 - C2H2 differences for the simple and the complex kinetics mechanism.
Residence times are obtained for TO conditions. Molar fractions are representative of other m odes as w ell ... 72 Figure 20 -Formation of soot in PSRs for both soot models ... 73 Figure 21 - Fraction of flow going into PSRs for a truncated normal distribution. Note the importance of the PSRs with equivalence ratios close to the mean and the very low importance of low and high equivalence ratios ... ... 75 Figure 22 - Beta distributions for different values of a and
13
obtained with MATLAB@... 7 7 Figure 23 - Formation of soot in the primary zone for TO and AP powers. Note that soot emissions for takeoff and approach are more stable for the beta distribution than for the norm al distribution ... ... 79 Figure 24 - PW4090: Beta pdf used to model ICAO modes emissions. Note that the maximum equivalence ratio has been increased to 2.5 in order to more accurately
represent soot em issions ... 80 Figure 25 - Influence of addition of acetylene on soot El. Y-axis is normalized by the engine maximum El obtained without acetylene addition ... .81 Figure 26 - Comparison of acetylene molar fraction as function of equivalence ratios for a propane fuel containing 10% of acetylene in volume and propane fuel containing no acetylene. Note that logarithmic scales are different for the plots ... 82 Figure 27 - Similarities of NOx emissions for different modes, relation between unm ixedness and N O x EI... ... 83 Figure 28 - Soot emission indices as function of unmixedness for different modes, relation between unmixedness and soot El ... ... 84 Figure 29 - Ultra sensitivity of the model when optimizing both soot and NO, emissions
... 84
Figure 30 - PW4090: Soot emissions as function of fuel flow... 85 Figure 31 - CFM56-2C: Soot emissions as function of fuel flow. Note that low power problems are also found in the NOx model ... ... 86 Figure 32 - Elasticity of input parameters relative to soot formation in PSRs ... 87
Figure 33 - Evolution of soot mass flow inside the PW4090 combustor model. Note the height of the peak ... 88 Figure 34 - Evolution of soot mass flow inside the CFM56-2C combustor model ... 89 Figure 35 - Evolution of soot mass flow inside the new PW4090 combustor model... 90 Figure 37 - Improvement of the model sensitivity for the PW4090 engine. The maximum absolute elasticity is 12.6 for the new model, compared to 83.9 for the previous one...91 Figure 39 - PW4090: emission index evolution as function of fuel flow... 91 Figure 40 - CFM56-2C: emission index evolution as function of fuel flow ... 92 Figure 39 - PW4090: parameters picked by the optimizer for volume and air fractions. 93 Figure 40 - CFM56-2C: parameters picked by the optimizer for volume and air fractions
... 9 3
Nomenclature
Boltzmann Constant Avogadro Number
Gas Constant
Density of soot particles
= 1.38*1023 J/K = 6.02* 1023 part/mol) = 8.31 J/(K*mol) = 1820 kg/m3 General Variables A Area
As Soot Surface Area per Volume (m-1) dp Diameter of a soot particle
fs Soot volume fraction
ki Reaction Rate Coefficient of reaction i Ki Reaction equilibrium constant
M Soot density (kg/m3) (M = p. fs) Mi Molecular weight of speciesj Mr Mass of an incipient soot particle N Soot particle density (part/m3)
p Fluid density
Fuel-to-Air equivalence ratio Collision efficiency Constants kB NA R Ps
List of Acronyms
AEDT - Aviation Environmental Design Tool AFR - Air to Fuel Ratio
APMT - Aviation Environmental Portfolio Management Tool CI- Concentration Index (in mg/m3)
CO - Carbon Monoxide
EDS - Environmental Design Space EI- Emission Index (in g/kg offuel)
EPA - U.S. Environmental Protection Agency FAA - Federal Aviation Administration FOA - First Order Approximation model Foo - Rated Thrust
HACA - H abstraction, C2H2 addition chemical mechanism
LTO - Landing Take-Off
MIT - Massachusetts Institute of Technology
NO,,- Nitrogen Oxides
PAH - Polycyclic Aromatic Hydrocarbon PLUG - iD Reactor
PM - Particulate Matter
PSR - Perfectly Stirred Reactor
Q
- Core Exhaust Volume per Mass of FuelRO - Rated Output
SFC - Specific Fuel Consumption SLS - Sea Level Static
SN- Smoke Number SO - Sulfur Oxides TIM - Time In Mode
UHC - Unburned Hydrocarbons
VOLPE - Volpe National Transportation Systems Center, Environmental Measurements and Modeling Division
Chapter 1
Introduction
Aviation transportation has achieved remarkable improvements since 1960, as it is now about 70% more fuel efficient to fly than 50 years ago as shown in Figure 1. Low
pollutant emissions have been achieved thanks to technology improvement, and emissions like carbon monoxide, unburned hydrocarbons, and soot have been
significantly decreased. Emissions of soot (as measured by the Smoke Number) have been lowered by as much as 85% between 1960 and 2000 as shown in Figure 1. However, growth of air traffic - estimated to be 4 to 5% annually between 1980 and 2000 - has outpaced the improvement of technology and total emissions have increased.
Therefore, concerns about aviation's contribution to climate change and surface air quality have increased.'
30 25 20 6 Z 15 0 10 5 1940 1950 1960 1970 1980 1990 2000 2010 1950 1960 1970 1980 Year Year
Figure 1 -SFC and Smoke Number improvements for aircraft engines2
1990 2000 2010
1 Aviation and the Environment: A National Vision Statement, Framework for Goals and Recommended
Actions," Report to the United States Congress, on behalf of the U.S. DOT, FAA and NASA, by I. A. Waitz, J. Townsend, J. Cutcher-Gershenfeld, E. M. Greitzer and J. L. Kerrebrock, December 2004.
2 from JOURNAL OF AIRCRAFT, Vol. 41, No. 1, January-February 2004, Progress in Aeroengine
Technology (1939-2003), Dilip R. Ballal and Joseph Zelina
SCivil Sea Level Static, Dry D Military Von Ohainfite 3 0 Olympus 3 0 *3 E l 13 cF•s•c2 " I i I , 1.5 1.25 E 0.75 I 0.5 0.25 A 0 . . U
FAA, in partnership with Transport Canada and NASA, has initiated the development of a suite of tools to help assess impacts of proposed environmental policies. This thesis presents the development of a combustor model that is integrated into one component of this tool suite. The combustor model estimates emission indexes of current and future aircraft engines given one-dimensional gas turbine engine thermodynamic cycle information, combustor volume, compressor discharge pressure and temperature, fuel flow and air flow at the combustor inlet.
1.1. APMT and EDS
One of the challenges in assessing environmental policies is the long time before the outcomes of a policy can be measured directly. For aviation, this time is particularly true because the time between development and introduction of new aircraft and engine technology can be as long as 25 years. Further, after new aircraft are introduced, they may have a service lifetime of 20-30 years. Therefore, when environmental policies are introduced, the consequences can be long-lasting. This heightens the need for decision makers to carefully assess a range of policy case scenarios and to estimate the impacts of new environmental policies on aircraft technologies, operations, industry economics, and environmental impacts. For this reason, FAA, Transport Canada and NASA initiated the development of an analytical tool suite that can estimate interdependencies amongst emissions, between noise and emissions, and that can analyze the benefit-cost of proposed actions. The Aviation Environmental Portfolio Management Tool (APMT) is a component of this tool suite and provides a "thorough appraisal of all aviation-related environmental effects and their direct economic costs to the aviation industry and consumers.3" Among the tools that APMT uses is Environmental Design Space (EDS), which provides "estimates for source noise, exhaust emissions, performance, and economic parameters for potential future aircraft designs under different policy and technological scenarios4." The architecture of APMT is shown Figure 2.
3 PARTNER web site, http://web.mit.edu/aeroastro/partner/projects/project3.html
Figure 2 - APMT Architecture Overview4.
1.2. Research motivation
In order to explore trade-offs among diverse future aircraft, EDS needs to assess fuel bum, emissions and noise for different aircraft designs. This thesis presents the development of a combustor model that computes NOx, CO and soot emissions at sea level for use within EDS. Inputs to the model have to be chosen carefully, they must be convenient to use when projecting future technology and they must be relevant to combustor characteristics.
1.3. Emission Regulation
In order to control the amount of pollution from aircraft in the vicinity of airports, the International Civil Aviation Organization (ICAO) has implemented emission
standards for soot, unburned hydrocarbons (UHC), carbon monoxide (CO) and oxides of nitrogen (NOx) that must be met by all subscribing countries. Except for soot, emission standards are defined for a Landing Take-Off cycle (LTO) cycle that defines the typical operations below 3,000 ft, i.e. near the airport. The LTO cycle comprises approach to the airport (30% Sea Level Static (SLS) thrust), idle (including taxi, equivalent to 7% SLS thrust) time, take-off (100% SLS thrust), and climb-out (85% SLS thrust). Figure 3 illustrates the four modes and the time spent in each mode (Time In Mode TIM).
Figure 3 -Landing and Take-Off Cycles
For NOx, CO and UHC emissions, the last regulation adopted to date6 is based on the
LTO emissions per unit thrust (Dp/Foo), defined as:
4
SEI, TIMm i ; fi Dp/Foo = i=
RO
where ElI is the emission of pollutant in mode i, hfi the fuel flow in mode i, and RO the rated output. Limits exist for each species, and are function of the certification date and of the rated output of the engine at sea level static conditions.
5 P.J. Jeanniot, "Environmental Review," International Air Transport Association, ISBN 92-9035-732-0.
6 ICAO Annex 16 Amendment 5 (November 24, 2005)
Regulation for soot is slightly different as it applies for all modes. The Smoke Number limit is:
SNm = min(50, 83.6- Foo-0.274)
where Foo is the rated thrust. This limit usually applies to the maximum power, take-off, since soot emissions typically increase monotonically with power (although some engines display more complicated behavior).
1.4. Smoke Number
Contrary to NOx,, or HC, certification procedures do not measure the emission index (El) for non-volatile particulate matter (soot). Instead, certification procedures evaluate smoke emissions using an indirect measurement of the smoke plume visibility of the engine. This method was implemented to eliminate the visible exhaust of aircraft, a major concern in the 1970's when the rules were first put in place. The measurement is done by positioning a filter at the exhaust of the engine that traps smoke particles contained in a given mass of exhaust gas. Then, the reflectance of the filter is measured and is compared to the reflectance of the paper before staining it. The comparison yields the Smoke Number (SN).
SN = 100- (_ R)
R,
R, and R, are the reflectance of respectively the stained filter and the unstained filter.
The bigger the smoke number is, the more soot is emitted. The uncertainty of such a measurement is high as it is estimated to be plus or minus 3 SN, to be compared to maximum SN values of usually less than 30, i.e. an uncertainty at least higher than 10%. More than 60% of engines have a smoke number below 10, so uncertainty is at least 30% in 60% of measurements.
1.5. Previous Work
The combustor model presented in this thesis was originally developed by Allaire as part of his Masters' thesis at MIT7. It predicts NO, and CO emissions of current and
potential future gas turbine engines within quantified uncertainty bounds. In achieving those objectives, the model needed to meet specific attributes including:
- Use of high level input variables such as the compressor exit temperature and pressure (T3, P3), combustor volume, and mass flows of air and fuel entering the
combustor (r~ir and ith~i). These inputs were determined to be convenient for
an expert to use in projecting future technology.
- It should represent the physical relationships between operating conditions, input variables and pollutant emissions.
- The model must apply to any combustor technology so it can be used to assess emissions of future engines.
- Fast computation times are required relative to three-dimensional CFD computations.
- Uncertainty must be quantified through comparison to existing technology to the extent possible. Uncertainties approaching the measurement uncertainties for emissions indices for the active fleet are a goal, i.e. about 16% for NO, and 23% for CO.
As shown by Allaire, the model meets those objectives for NO, and CO emissions, and achieves particularly good prediction for NO, emissions (model estimates are all within ±_16% uncertainty with the exception of idle) for the small number of engines for which comparisons to experiment were presented. An overview of the combustor model is shown below:
7 Douglas L. Allaire, "A Physics-Based Emissions Model for Aircraft Gas Turbine Combustors", Master's
Geometry: (Combustor volume)
Additional parameter:
I
Cotbu
0r
Emission Index:1Mo
(NOx, CO, soot)
(Combustor unmixedness)
Figure 4 - Inputs and outputs of the combustor model
The model represents the physical layout of a combustor. It consists of a primary zone, an intermediate zone, and a dilution zone, that are modeled by either perfectly stirred reactors (PSR) or plug flow reactors as shown in Figure 5. PSRs are ideal reactors that assume instantaneous mixing. They are adequate to model combustion processes that have negligible characteristic mixing times relative to burning times. Plug flow reactors assume steady inviscid flow with ideal gas behavior and no mixing in the axial direction.
Primary zones of typical combustors have large recirculation regions of flow, high temperatures, and high levels of turbulence. Short characteristic mixing times relative to
burning times are usually associated with high levels of turbulence, suggesting that PSRs
are appropriate to model this region. 16 Parallel PSRs - each PSR has a different
fuel-to-air ratio - capture the unmixedness of air and fuel in the primary zone associated with the
injection of fuel inside the combustor.
The intermediate zone's role is to slowly add dilution and cooling air while maintaining a high enough temperature to complete combustion. It also serves as an extension of the primary zone to burn pockets of fuel-rich mixture when they exist. Testing revealed that a single plug reactor provided the best results for the intermediate zone.
The dilution zone is designed to cool down the gas to an acceptable mean temperature and to improve the pattern factor prior to the turbine inlet. The flow is essentially
one-Operating conditions:
(Combustor Inlet pressure and temperature, air flow
and fuel flow)
dimensional and is therefore reasonably well modeled by plug flow reactors. Two serial plug flow reactors are used to model this region, divided by the addition cooling air between both plugs.
Finally, dilution and cooling air are modeled through the addition of air between each zone.
PSRs
Figure 5 - Schematic of Allaire's network reactor model'
1.6. Thesis Objective
The objective of the thesis is to develop a soot emissions model for use in the combustor model previously developed by Allaire for EDS. The soot model must meet the same attributes as the previous version (see paragraph 1.5). Soot emissions are historically the most challenging to predict of the major pollutant emissions. They are very sensitive to design and operating parameters. The first objective is to represent the trend of soot emissions for the 4 ICAO LTO cycle modes (idle, approach, climb-out and
I---take-off). This trend is different for all engines, but takeoff smoke number is usually the largest value. Two engines that have different trends are modeled in this thesis: the PW4090 engine and the CFM56-2C engine. If the trend objective is met, the next milestone is to generate soot emissions estimates for other engines in the fleet.
1.7. Organization of the Thesis
The thesis describes and analyzes the soot formation mechanisms that are implemented in the combustor model.
Chapter 2 defines particulate matter (PM), describes the health and environmental problems associated with PM, and details the current methodology to assess PM emission in engines exhaust. Chapter 3 describes the soot properties and the formation mechanism of soot, setting the modeling equations to be used. Chapter 4 explains how the soot mechanism was implemented in the combustor model, and finally Chapter 5 discusses the results obtained.
Chapter 2
Particulate Matter (PM)
This chapter describes the typical particulate matter (PM) that is found in the exhaust of aircraft engines. Different types of particulate matter are listed, classified, and the impacts on health and climate change are described. Finally, the current method used
by FAA and EPA to estimate PM emissions (FOA 3.0) is described. The method will be
used later on to compare the emission indexes generated by the combustor model to the
ICAO emission indexes.
2.1. Definition and Classification
Particle matter (PM) is not classified as specific species or as a specific chemical group like nitrogen oxides, alkanes or alkenes are for instance, but as a mixture of small particles and liquid droplets. PM is made up of various components, like acids, organic chemicals, metals, and dust particles, and can contain hundreds of chemical components. Typical PM types are dust, dirt, soot, smoke, and liquid droplets emitted by factories or combustion engines.8 Typical PM emitted by aircraft engines include soot, lube oil, fuel
organics and sulfates.
PM can be composed of volatile particles, non-volatile particles, or non-volatile particles coated with liquid. In aircraft engines, volatile particles are composed of fuel organics, lubrication oil and fuel sulfur, and non-volatile particles are soot particles (black carbon). Other classifications apply and are presented below; they take into account the size of the particles or how they are formed.
Size distribution
The "inhalable coarse particles" category (referred to as PMlo), contains particles whose diameter is larger than 2.5 micrometers and smaller than 10 micrometers. These particles are usually found near roadways and dusty industries. The second category contains "fine particles", particles whose diameter is less than 2.5 micrometers. They are referred to as PM2.5. Such particles can be emitted from forest fires, combustion engines,
or by subsequent reactions from gases emitted by power plants, industries or engines.
Reaction pathway
Researchers also differentiate particles emitted directly in the air by the pollutant source (primary particles) from the ones that are subsequently formed from complicated reactions between the combustion gases released and other chemical species in the atmosphere (secondary particles).
Aircraft Particulate Matter
Studies have shown that both non-volatile and volatile particulate matter is found in the exhaust of aircraft engines. Non-volatile particles form in the hottest areas of the combustor and in the early part of the turbine. No subsequent reaction occurs in the atmosphere; they are listed as primary particles.
Volatile particulate matter can be either primary or secondary PM. For instance, fuel sulfur particles emitted are largely composed of secondary particles; they mix in the atmosphere and react to form ammonium sulfates. The same is true of ammonium nitrate PM which is typically formed from precursor gases of NOx. Oil particulate matter, on the other hand, originates from leaks in the engine and do not evolve once in the atmosphere; they are primary particles. Finally, a good approximation is that particulate matter emitted by aircraft all belongs to the PM2.5 category9.
Major PM found in aircraft exhaust are listed Table 1.
9 Derivation of A First Order Approximation of Particulate Matter From Aircraft, Paper # 69970, Roger L. Wayson, Gregg G. Fleming, Brian Kim and Julie Draper
Non-volatile PM Volatile PM
Soot (C,) Fuel Sulfur (SOx)
Some metals Fuel Organics
Lube oil (can be included in fuel organics as well)
Table 1 - Major PM compounds found in aircraft exhaust.
2.2. Health and Climate Issues Related to PM
There is a well established correlation between exposure to particulate matter and adverse health effects. Particulate matter hazards come from both their size and their chemistry. Their size allows them to enter the lungs where chemicals may diffuse into the blood through the gaseous exchange in the lungs and can cause cardiovascular effects. The smallest particles are estimated to have the strongest adverse health impacts'. Theyl increase the risk of lung cancer, and may contribute to thousands of premature deaths each year. Illnesses related to PM include new cases of chronic bronchitis, and aggravation of existing respiratory and cardiovascular disease.
In addition to health problems, PM contributes to global climate change. Sulfate aerosols intercept incoming sunlight and reduce the energy flux arriving to the Earth's surface". Soot has a slightly different effect as it absorbs light and influences clouds, meaning it warms up the atmosphere (due to light absorption) and cools down the surface (by reducing energy flux reaching it). Besides, it acts as a seed for water condensation. Water droplets are then bigger than usual, making the cloud denser and reflecting more solar radiation. The result increases the effect of warming the atmosphere and cooling the surface.
to European Commission, 2005
2.3. Measurement of Non-Volatile PM for Aircraft Engines
Measurement of soot emissions for aircraft engine is done by measurement of the Smoke Number. The method may be used to estimate of non-volatile particulate matter, but development of additional measurements is necessary. First, Smoke Number measurements do not meet high levels of precision, as uncertainties are usually around 30%. Further, the method does not capture some of the important physical characteristics of emitted particles, such as the soot mass flow and the particle size distribution. Two engines can have similar smoke numbers and have different mass flow rates of soot emissions. Over the last 10 years, people have proposed to include more accurate data during the certification measurements. For instance, it has been recommended that mass flow and size distribution be recorded12 instead of only Smoke Number. This would give more meaningful data and would provide researchers with better data to work with, but it requires more complex measurements. Research is currently on-going by groups such as the Society of Automotive Engineers (SAE) to standardize measurement techniques for aircraft PM, but it will not be completed for years to come. Even after acceptance of a standard method it will be additional years before certificated measurements are achieved and validated and a fleet database is completed.
The FOA Method
Because engine certification still requires measurement of Smoke Number only, a method has been created to assess mass flow emissions of the different types of particulate matter based on SN measurements. This method is called First Order Approximation (FOA) (see Appendix A). As it is stated in the document, "this method is approximate and is only to be considered an interim approach until measured, statistically valid data are available9." The FOA method is based on studies that showed correlation between the reported smoke number and mass emissions. FOA relies on the assumptions
that the change in mass emissions is correlated to the change in SN'3 and that the few data that are accessible are representative of commercial aircraft. A relation between mass emissions and SN is then extrapolated. The last released version is version 3.0. It is different from version 2.0 in the sense that non-volatile and volatile PMs are not correlated anymore. In version 2.0, volatile PMs were obtained by multiplying non-volatile PM (obtained using a direct relationship with SN) by a factor of 3. In version 3.0, each volatile component is also assessed independently of others. More details are found Appendix A.
In order to estimate soot emission indices from the ICAO Smoke Number, FOA3.0 introduces the concentration index CI (mg/m3) and the core exhaust volume per mass of
fuel
Q
(in M3/kg fuel). Regression is made between CI and SN, and standardQ
is estimated for the 4 ICAO points. The productQ.
CI yields the emission index. More precisely, the method introduces different regression functions for SN below and above30 that account for technology, as most modem engines have a smoke number below 30
whereas older engines' Smoke Numbers are usually above 30.
Based on regression of the data, the relation between concentration of soot CI (Concentration Index, expressed in mg/M3) and Smoke Number SN is:
CI = 0.0694(SN)'233 5 7 for SN < 30
CI = 0.0297(SN)2 - 1.802(SN) + 31.94 for SN > 30
Concerning the determination of
Q,
the FOA method assumes that average air-to-fuel ratios (AFR) per power settings can be assumed for all commercial turbine jet aircrafts'4(see Table 2).
13 Based on the findings of Wayson, R.L., G. Fleming, B. Kim, in A Review of Literature on Particulate
Matter Emissions from Aircraft, DTS-34-FA22A-LRI, Federal Aviation Administration, Office of Environment and Energy, Washington, D.C. 20591, December, 2003
14 Eyers, C., CAEP/WG3/AEMTG/WP5, Improving the First Order Approximation (FOA) for
Characterizing Particulate Matter Emissions from Aircraft Engines, Alternative Emissions Methodology Task Group (AEMTG) Meeting, Rio De Janeiro, Brazil
Power Setting AFR
7% (idle) 106
30% (approach) 83
85% (climbout) 51
100% (takeoff) 45
Table 2 - Assumed air-to-fuel ratios by power setting
The core exhaust volume per mass of fuel (Q) is calculated as:
Q = 0.776 -AFR + 0.733
or Q = (0.776 -AFR + 0.733)(1+ +)
in the case Smoke Number is measured with bypass air (bypass ratio is P3) as would be the case for internally mixed turbofan core and bypass streams.
Engines modeled in this thesis are relatively modern and have a Smoke Number less than 30. Their smoke number has also been measured without bypass air so we will use the following equation as the soot reference function in the model, as well as ICAO
SN.
Chapter 3
Soot Formation
Soot is the most prevalent non-volatile particulate matter found in aircraft engines. Other compounds such as metal particles are negligible and non-volatile PM emissions are considered to be soot only. Soot emissions originate due to incomplete combustion of hydrocarbon fuels and their formation occurs in the hottest parts of the flame, where fuel and air are poorly mixed. Soot size, shape, and the complex conditions necessary for its formation, make soot formation difficult to study. It has received considerable interest in the last 40 years and knowledge has significantly increased. However, there are still unanswered questions, especially for the turbulent high-pressure flames typical of aircraft gas turbine combustors. This chapter describes the current knowledge of soot properties and soot formation, and details the current best mechanism rates that model soot behavior.
3.1. Soot Properties
Soot, or black carbon, is made almost entirely of carbon. Other species such as hydrogen or oxygen or nitrogen can be found, but in low quantities. Typical ratios15 of
C/[i] are 8.3 to 18.3 for i=H, 58 to 109 for i=O and 292 to 976 for i=N.
Soot particles almost never exceed 1 m so soot belongs to the PM2.5 category.
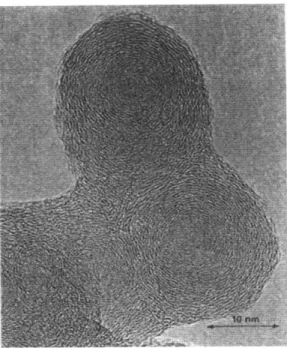
Figure 6 shows typical shapes of soot particles. They are aggregates of nearly spherical carbon primary particles having relatively uniform diameters. They also exhibit fractal behaviors with a mass fractal dimension below 2.
15 Combustion Science and Technology, Vol. 108, Nos. 4-6, 1995, pp. 207-229, Faeth, G.M., and Koylu,
Figure 6 - TEM photographs of soot aggregates at maximum soot volume fraction location along the axis of different flames, showing the texture of soot particles16
For long combustor residence times, primary particles are well modeled by a Gaussian distribution with mean primary diameter just below 60 nm and standard deviation smaller than 25%17. The size distribution of the particle aggregates is appropriately modeled by a lognormal Gaussian distribution with an average size and a standard deviation that depend on the residence time. Those aggregates subsequently cluster to each other and form bigger open structured particles. As time elapses, soot particles do not look like primary particles touching each other anymore, but more like spherical particles that would have merged together because of soot growth.
Chemical properties like density, porosity are similar to black carbon. It is therefore a good estimate to assume a density of 1820 kg/m3, and this value will be used later. Also similar to carbon is the structure of primary particles composing soot. They consist of carbon layers, like graphite. Such a structure is shown Figure 7.
16 44th AIAA Aerospace Sciences Meeting and Exhibit, Soot Formation and Oxidation in Laminar Flames,
from C. H. Kim, F. Xu, P. B. Sunderland, A. M. El-Leathy and G. M. Faeth
17 AIAA2001-03ZZ, Soot Research in Combustion Science: Introduction and Review of Current Work from D. L. Urban and G. M. Faeth
Figure 7 -Structure of a soot primary particlei s
3.2. Soot Formation Pathway in Aircraft Combustors
As mentioned before, soot is produced in the hottest parts of the combustor, in the fuel-rich regions and in the early stages of the turbine19. However, for new engines with better mixing of air and fiuel, soot formation is reduced and almost no soot is created in the turbine. Based on the work of Dakhel P. M. and Waitz I. A.20, it has been shown that PMs do not evolve significantly in the plume of aircraft engines, and soot is considered a primary PM. In addition, time spent in the high-pressure turbine (HPT) is relatively low compared to the time spent in the combustor, so oxidation in the HPT affects little if any soot particles. Finally, temperature in the low-pressure turbine is too low to affect soot so the mass of soot exiting the engine is the same as the mass of soot exiting the combustor. For these reasons, we consider mass emissions of non-volatile PMs recorded from engines to come from the combustor, and the model objective is to match those values.
18 From The Evolution of Soot Precursor Particles in a Diffusion Flame, from Dobbins et al. (1998) p. 286,
Vol. 115, Combustion and Flame, Combustion Institute
19 Energy Combustion Sci. Vol. 23, Models of Soot Formation and Oxidation, Ian M. Kennedy
20
Pierre M. Dakhel, "Modeling of Particulate Matter Creation and Evolution in Aircraft Engines, Plumes and Particle Sampling Systems", Master's Thesis, Massachusetts Institute of Technology, 2005.
Soot radiation is both a strength and it is problematic. It is a strength because it makes spotting of soot easier, as the flame gets a bright yellow color and makes optical measurements of soot concentration possible. The drawback from a modeling standpoint is its complexity. Unlike other species such as NOx, soot depends heavily on the flame structure. Soot has influence on the flame as it releases heat through radiation, and understanding soot formation requires taking this feedback effect into account. This feature is responsible for the lack of modeling and understanding on soot formation. Many efforts have been undertaken over the last few years to understand the mechanisms of soot formation in engines. Progress has been made, but there are many questions that remain unanswered concerning each stage of the soot evolution (nucleation, growth, oxidation and coagulation). For aircraft engines, radiation of soot makes hardware life
and durability of engines - especially durability of combustor liners - decrease because
flame temperature increases with flame radiation. It also reduces efficiency of the engine and increases fuel consumption, but these effects are relatively insignificant.
3.2.1. Precursors
The soot formation path can be described as follows: particles react to form bigger chemical compounds, then grow, then collide with one another to form incipient soot particles, and finally grow, coalesce and get oxidized. The early compounds that trigger this path are called soot precursors. Over the years, many species have been thought of being a precursor to soot. Inceptions of polyacetylenes, ionic species, or polycyclic aromatics hydrocarbons (PAHs) were all once considered to be the key elements for soot nucleation. As of now, it is considered that the first two listed species are not crucial to soot formation, and that soot is obtained through PAHs21.
Polycyclic Aromatic Hydrocarbons (PAHs)
PAHs are chemical compounds that contain at least two simple aromatic rings bonded together, and that have neither heteroatoms (atoms other than C and H) nor substituents. Even though naphthalene (CloHs) fits into the definition, it is not a PAH by convention.
Anthracene (C14Ho10) is one of the simplest PAHs. Table 3 lists some of the simplest
PAHs along with their formula and shape.
PAH's name Formula Shape
Anthracene
C14Ho10Phenanthrene C14H10
Naphthacene
C18HI2Chrysene
C18sH2
Ovalene
C32H14
Table 3 -Examples of simple PAHs22
PAHs are also considered organic pollutants and affect air quality as some of them are carcinogens and others trigger health problems. As they are emitted with soot, they contribute to the health issues associated with soot emissions. They are due to incomplete combustion of crude oil, kerosene, or other compounds. PAHs can have as many rings, but few of them reach more than seven rings as they become large and unstable. The most commonly found PAHs have five or six rings.
The presence of aromatics in the fuel leads to higher soot creation rates since formation of the first aromatics ring - which is the rate-limiting step in the formation of PAHs (see paragraph 3.3.1) - can be bypassed. Legislation requires that fuels used for
22
civil air transportation have less than 22% volume of aromatics23. An ideal value would
be zero but the proportion of aromatics is too high to economically justify their removal. Figure 8 addresses the importance of the fuel surrogate that will be used in the model. As smoke depends on both aromatics content and hydrogen content, it is important to use a fuel surrogate that is similar to Jet A as far as soot is concerned.
60 I 50 a, p .0 0E ca 309n 40 on3 ZI I I I 10 11 12 13 14 15 16
Aromatics content, mass percent Hydrogen content, mass percent
Figure 8 - Sooting effects of aromatics and hydrogen fuel content (from A. Lefebvre, Gas Turbine Combustion)
Equivalent for U.S. civil Aromatics (by volume)
Olefins (by volume) Sulfur (by mass)
Kerosene Jet A; Jet A-1
22% 5% 0.3%
Table 4 -Representative Chemical Limits for Aircraft fuels24
23 Toxicologic Assessment of Jet-Propulsion Fuel 8 (2003),
http://books.nap.edu/openbook.php?recordid=10578&page=9 24 Gas Turbine Combustion, Arthur Lefebvre
E E a, 0 U,
i
I I3.2.2. Nucleation
Soot undergoes 4 types of reaction while in the combustor. The first one is nucleation and is described below. After incipient soot particles are formed, they grow, get oxidized and coagulate before exiting the combustor. Each reaction affects either the mass of soot or the number of particles, or both. For instance, nucleation creates new particles so it changes both mass and particle densities. Growth and oxidation, on the other hand, affect only mass, and coagulation affects only particle densities.
As mentioned above, the current understanding is that PAHs (polycyclic aromatic hydrocarbons) are the principal species responsible of soot nucleation'8. In this nucleation
process, the first step towards PAH is the formation of the first aromatic ring from hydrocarbons present in fuel. This step is highly important because it is considered to be the rate limiting reaction for PAH formation. As a consequence, it controls the rate of PAH formation and subsequently controls the rate of soot nucleation.
Once the first aromatic is created, primarily C5H5, growth of the soot precursors
(PAHs) follows an HACA mechanism2 1. This mechanism is detailed paragraph
3.3.2Error! Reference source not found.; aromatics need to be activated, then acetylene
radicals cluster to the activated molecule and make aromatics grow. More precisely, H molecules convert the aromatics to their radicals (activation) and acetylene bonds to the radicals (growth).
When they are large enough, PAHs are able to stick to each other by collision: their sizes increase. They create PAH dimers, then collide with simple PAHs to form trimers, then form tetramers and so on and keep growing through collisions. This process makes the PAHs evolve from gaseous species to solid particles, the first "solid particle" being usually assumed to be a dimer. The incipient soot particle is formed.
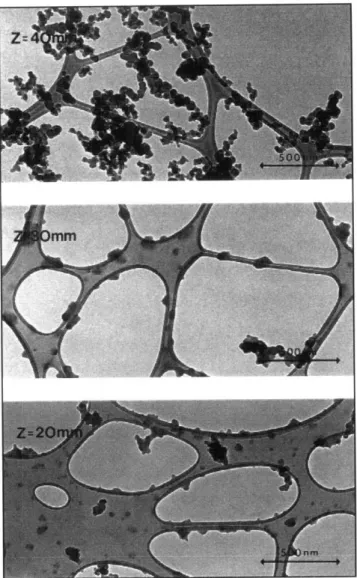
Figure 9 - Micrographs of soot particles captured on carbon grids, from an ethene diffusion flame. The transition from precursor particles to soot aggregates occurs between Z = 30 and 40 mm 25
3.2.3. Growth, Oxidation, and Coagulation
Once the incipient soot particle is formed, growth, oxidation and particle coagulation change the physical characteristics of the initial soot particle. Typical chemical mechanisms are HACA for soot surface growth, and 02 or OH oxidation for soot oxidation. Studies have also shown that in typical flames, growth and oxidation rates are much higher than nucleation rates.
25
From The Evolution of Soot Precursor Particles in a Diffusion Flame, from Dobbins et al. (1998) p. 286, Vol. 115, Combustion and Flame, Combustion Institute
b. photograph near the maximum soot concentration condition (z = 50 mm); c. photograph near the end of soot surface oxidization (z = 70 mm).
Figure 11 - Soot formation path
3.3. Modeling Rates of Soot Formation inside the Combustor
Based on the soot creation path described above, different models have been proposed. Lindsted was the first one to propose a model that could accurately predict soot emissions for a wide range of conditions27
. The model is based on acetylene for growth and nucleation, and OH for oxidation28. This model is described in reference
[28]. He remarked that soot was less reactive in the latest part of the growth, and he
27
Combustion and Flame (1991), 87 289-305, A Simplified Reaction Mechanism for Soot Formation in Nonpremixed Flames, K. M. Leung and R. P. Lindstedt28
Proceedings of the Combustion Institute (2007), J.B. Moss, I.M. Aksit, Modelling soot formation in a laminar diffusion, doi: 10. 1016/j.proci.2006.07.016
To sum up, hydrocarbons in the fuel react to form simple aromatic rings. After this initial reaction, aromatic rings react to form more complex rings and finally form PAHs. PAHs, when large enough, are solid and account for the incipient soot particles. Soot particles then undergo growth, oxidation and coagulation reactions in the combustors. Soot generally comes out of the combustor in an agglomerated form2 6 and then does not
undergo additional chemical reactions. The following figures outline the typical shapes and growth of soot particles and the typical path for soot creation inside an aircraft combustor.
Figure 10 - Typical TEM photographs of soot aggregates along the axis of the ethylene-fueled laminar jet diffusion flame burning in air at atmospheric pressure38:
a. photograph near start of soot formation (z = 20 mm);
suggested that the growth term should be modified to account for particle aging. Subsequent analysis showed that lower reactivity was not due to aging, but to a lack of reactivity of the particle. Soot must be activated by hydrogen before growing and follows a HACA mechanism. Still, due to the fact that it does not use radical species, Lindstedt's growth and nucleation models are still widely used. We describe both HACA and Lindstedt's models in this section.
3.3.1. Nucleation
Early Stages, Formation ofAromatics
This step is the least understood of all steps as many complex chemical species are thought to play an important role, as well as many reactions. There is also the difficulty of knowing when to consider a molecule solid and which first species is considered soot. Particles' sizes are also very small and require high optic resolution to observe them. As it has been seen, the current knowledge is that soot is created by aggregation of polycyclic aromatic hydrocarbons (PAHs).
The formation of the first aromatics ring plays a major role in the nucleation of soot as this reaction is considered to be the rate-limiting step in the reaction sequence to larger aromatics. In the last years attention has been given to this reaction in order to understand the soot formation pathway. Many initial pathways have been suggested to be the first step toward soot21. Researchers used either propargyl (C
3H3) or acetylene as
reactants because propargyl is extremely stable and acetylene is abundant in hydrocarbon fuel and is considered to play a major role in building up hydrocarbons. Reactions like
(1), (2) and (3) were once proposed but were dismissed by subsequent analysis. n - C4
H
3 + C2H2 -, phenyl (1)n- C4H5 + C2H2 --- benzene + H (2)
C3H3 + C3H3 -- benzene or phenyl + H (3)
Finally, a pathway relying on both propargyl radical and acetylene has been suggested and has proved satisfying, resulting in the following reaction:
C
3H, +
C
2H
2-c
-CH (4)
Following its formation, cyclopentadienyl (c - Cs5H) reacts rapidly to form benzene. Recent studies have shown the feasibility of this reaction and have determined the reaction rate is expected to be 2 to 103 faster than reaction (3)21. This property, when
added to the fact that both propargyl and acetylene - stability and abundance - appear as
reacting species, makes this reaction likely to play a key role in the formation of the first aromatic ring.
As a result, the first aromatics kinetic step is proportional to both propargyl and acetylene concentrations.
Nucleation: Growth ofAromatics, the HACA Mechanism
Aromatics growth can be described as a repetitive sequence of two principal steps. If we note A, an aromatic chain, its growth occurs as follows:
- Abstraction of an atom of hydrogen from the aromatic chain: Ai + H
-,,
AF, + H2 (HACA 1)- Addition of acetylene:
A,_ + C2H2 +- Aj+1 + products (HACA 2)
This mechanism is referred to as the HACA mechanism. HACA is an acronym for "H-abstraction, C2H2-addition". The abstraction step activates the aromatic by
converting it to a radical Aj, which reacts with C2H2 to form a bigger aromatic.
Aromatics activation can be achieved through different ways and by different species, but experimental data have shown that the abstraction by a gaseous H is the dominant reaction. Aromatics growth can also be achieved with species other than acetylene, but studies showed that the different pathways rapidly relax to the HACA mechanism.
The key feature of both reactions is reversibility21. Reverse reactions control the rate of aromatics growth and both reactions can be highly reversible. In many cases the second step reaction is extremely reversible and growth occurs - irreversibility occurs
-only when the aromatic formed is extremely stable because the system recovers entropy and decreases its energy. Coupling between (HACA 1) and (HACA 2) kinetics and stability of the products is what defines the HACA mechanism.
When HACA 2 is irreversible and HACA 1 is in equilibrium state, we get:
d[A,,
1 -k
2K[H]
[C2H2
.[A
dt
[H21
where K1 is the equilibrium constant of reaction HACA 1 and k2 is the reaction rate
coefficient of reaction HACA 2.
In most flame conditions, growth rate is proportional to acetylene concentration, as well as the reaction rate of the first aromatics ring. Combination of both reactions makes the overall nucleation rate proportional to [C2H2]. It is the reason why HACA and
Lindstedt's nucleation model rates are proportional to acetylene.
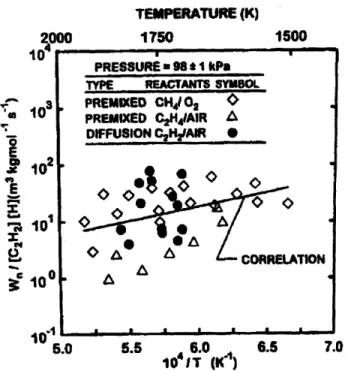
The HACA mechanism goes further as it inferred from the previous equation that the nucleation rate is proportional to [H] as well. But correlation with data is limited as seen Figure 12. TEMPERATURE (K) 2.000 1750 1500 10i a10 * 10 E S10 5.0 5.5 6.0 6.5 7.0 10 iT (IK)
Figure 12 - Nucleation energy activation estimation for HACA model for laminar premixed and diffusion flames17
PRESSURE 98 *1 kPa
TYPE REACTANTS SYMBOL
PREMIXED CH4 02 PREMIXED C2H41AIR ' DIFFUSION C2HyAIR , <
·
CORRELATION i1
For the model proposed by Lindstedt, W; C2HI is considered to be a function of
temperature only. By correlating the data to the model, Lindstedt obtained a nucleation rate2 8 w, -= a.Mp[C
2H e -2 1000/T, , with a = 54 s- and Mp E [144 ; 2000] kg/kmol. Mp
represents the mass of an incipient soot particle and depends on the number of atoms in the particle.
3.3.2. Growth: HACA Soot Particle Surface Mechanism
There are many similarities between soot surface and PAHs. Based on that remark, people have shown that soot growth is proportional to acetylene concentration (Lindstedt's model) and that it might follow the HACA mechanism. Two different HACA soot growth paths are presented in this section.
The first model is due to Frenklach and co-workers29 and is noted FW, the second one
has been established by Colket and Hall and is noted C3 0o. These mechanisms are
described Table 5 and Table 6. The mass growth rate of each mechanism is noted Rj, with i = FW or CH, and the net growth rate per unit of soot area is noted Wg. The relation between soot growth rate and each mass growth mechanism is defined as w, -a;.R ,,
with i=FW or CH. a, is an empirical factor, closed to unity, which models the difference between soot sites and the final compound of any mechanism. The underlying idea is that chemical reactions taking place on the surface of soot particles are analogous to those on large PAHs. The soot surface is considered to be like the edge of large PAHs, covered with C-H bonds21 and growth follows a HACA mechanism. The main difference with PAH is that soot sites are not gaseous, so the empirical factor is different from 1.
The principal difference between both mechanisms is that one (FW) involves fewer reactions than the other, but has an empirical factor that is a function of the maximum
29 30 Kazakov, A., Wang, H., and Frenklach, M., Combust. Flame 100:111 (1995).
Colket, M. B., and Hall, R. J., in Soot Formation in Combustion (H. Bockhorn, Ed.), Springer-Verlag, Berlin, 1994, p. 442.
temperature of the flame, while CH's empirical factor is a constant. Both mechanisms show very good correlations for different conditions and flames.
Reaction Mechanism from Colket and Hall30
Reaction A E
Reaction
number (m, kg mol, s) (kJ/(kg.mol)
1 C - H + H -- C, e +H2 2.5*10" 50,200 -1 C, +H - C - H+ H 4.0*108 29,300 2 C, *+H -- C, - H 2.2*10" -2 C, - H -- Cs +H 2.0*1017 456,000 3 C, +C2H2 - products 3.0*1014 259,000 4 C * +C2H2 - CCH CH 2.0*109 16,700 -4 CCHCH - Cs *+C2H2 5.0*1013 159,000 5 CCHCH- C, -H+H 5.0*10t0
Table 5 - Soot reaction mechanism from Colket and Hall with a reaction rate of k = A.exp(-E/(RT))
Using the steady-state approximation for fast reacting intermediates, the mechanism mass growth rate per soot surface is:
R - d(massgrowth/m2) CHAcA(kl.[H]+ k-2)(k4.k 5.[C2H2]-k 3.(k-4 + k))[C,- HI
- -L11
(K 1.[l 2J + K2.IH + K3)(K-4 + K-5)+ K4X51LC2 2 1
The coefficient acH is obtained based on available measurements, after correction for oxidation rates. Correlation between growth rate and RCH is particularly good as can be seen Figure 13. Regression gives acH = 1.0 with a 95% confidence interval of ±0.2. It confirms that soot growth is well modeled using this mechanism.
E IM
AV
I
I o111111 I I 111111 1 1 1 Bill
. seg a s se a s n sel a s o usi
IPRESIURE = 98 21 PREMIXED CH4 10 2 (1997) PREMIXED C,HIAIR (1998) XU & FAETH DIFFUSION C2H2,AIR (2000) EL-LEATHY ET. AL DIFFUSION HCIAIR (2001) DIFFUSION C,H,10CsHAIR (2001) 9
aLaIlII I J I IIlIlE I I IIIIa a
4 .3
4 103
RCH ( kglm2s)
10-2
Figure 13 - Soot surface growth rates (corrected for soot surface oxidation) in terms of the HACA
mechanism of Colket and Hall for laminar flames at atmospheric pressure (from3
')
The formation rate RCH can be simplified because in usually encountered flame conditions, [H] [C2H2] varies more than the other terms. It can be approximated as:
RcH, = cte. C CA.kl.kA 4.k .[ H
].[
C2with g being a function of temperature only. Correlation of coefficient acH depends on the ambient pressure and varies between 0 and 1.
To sum up, the Colket and Hall model for soot creation is: w•W- f(T)HI.[C 2H1.2
31
AIAA JOURNAL, Diffusion Flames, A.
Vol. 41, No. 5, May 2003, Soot Surface Growth in Laminar Hydrocarbon/Air M. El-Leathy, F. Xu, C. H. Kim, and G. M. Faeth
L · 10-2 S· u