HAL Id: hal-01091227
https://hal.archives-ouvertes.fr/hal-01091227
Submitted on 7 Dec 2014
HAL is a multi-disciplinary open access
archive for the deposit and dissemination of
sci-entific research documents, whether they are
pub-lished or not. The documents may come from
teaching and research institutions in France or
abroad, or from public or private research centers.
L’archive ouverte pluridisciplinaire HAL, est
destinée au dépôt et à la diffusion de documents
scientifiques de niveau recherche, publiés ou non,
émanant des établissements d’enseignement et de
recherche français ou étrangers, des laboratoires
publics ou privés.
Characterisation of dust aerosols in the infrared from
IASI and comparison with PARASOL, MODIS, MISR,
CALIOP, and AERONET observations
S. Peyridieu, A. Chédin, V. Capelle, C. Tsamalis, C. Pierangelo, R. Armante,
C. Crevoisier, L. Crépeau, M. Siméon, F. Ducos, et al.
To cite this version:
S. Peyridieu, A. Chédin, V. Capelle, C. Tsamalis, C. Pierangelo, et al.. Characterisation of dust
aerosols in the infrared from IASI and comparison with PARASOL, MODIS, MISR, CALIOP, and
AERONET observations. Atmospheric Chemistry and Physics, European Geosciences Union, 2013,
13 (12), pp.6065-6082. �10.5194/acp-13-6065-2013�. �hal-01091227�
Atmos. Chem. Phys., 13, 6065–6082, 2013 www.atmos-chem-phys.net/13/6065/2013/ doi:10.5194/acp-13-6065-2013
© Author(s) 2013. CC Attribution 3.0 License.
EGU Journal Logos (RGB)
Advances in
Geosciences
Open Access
Natural Hazards
and Earth System
Sciences
Open AccessAnnales
Geophysicae
Open AccessNonlinear Processes
in Geophysics
Open AccessAtmospheric
Chemistry
and Physics
Open AccessAtmospheric
Chemistry
and Physics
Open Access DiscussionsAtmospheric
Measurement
Techniques
Open AccessAtmospheric
Measurement
Techniques
Open Access DiscussionsBiogeosciences
Open Access Open Access
Biogeosciences
Discussions
Climate
of the Past
Open Access Open Access
Climate
of the Past
Discussions
Earth System
Dynamics
Open Access Open Access
Earth System
Dynamics
DiscussionsGeoscientific
Instrumentation
Methods and
Data Systems
Open Access
Geoscientific
Instrumentation
Methods and
Data Systems
Open Access DiscussionsGeoscientific
Model Development
Open Access Open Access
Geoscientific
Model Development
DiscussionsHydrology and
Earth System
Sciences
Open AccessHydrology and
Earth System
Sciences
Open Access DiscussionsOcean Science
Open Access Open Access
Ocean Science
DiscussionsSolid Earth
Open Access Open Access
Solid Earth
DiscussionsThe Cryosphere
Open Access Open Access
The Cryosphere
DiscussionsNatural Hazards
and Earth System
Sciences
Open Access
Discussions
Characterisation of dust aerosols in the infrared from IASI and
comparison with PARASOL, MODIS, MISR, CALIOP, and
AERONET observations
S. Peyridieu1,*, A. Ch´edin1, V. Capelle1, C. Tsamalis1, C. Pierangelo2, R. Armante1, C. Crevoisier1, L. Cr´epeau1, M. Sim´eon1, F. Ducos3, and N. A. Scott1
1Laboratoire de M´et´eorologie Dynamique, UMR8539, CNRS/IPSL, Ecole Polytechnique, Palaiseau, France 2Centre National d’Etudes Spatiales, Toulouse, France
3Laboratoire d’Optique Atmosph´erique, Universit´e des Sciences et Technologies de Lille, Villeneuve d’Ascq, France *now at: M3 Systems c/o CLS, Space Oceanography Division, Ramonville-St-Agne, France
Correspondence to: V. Capelle (virginie.capelle@lmd.polytechnique.fr)
Received: 10 August 2012 – Published in Atmos. Chem. Phys. Discuss.: 6 September 2012 Revised: 8 May 2013 – Accepted: 23 May 2013 – Published: 25 June 2013
Abstract. Infrared Atmospheric Sounder Interferometer (IASI) observations covering the period from July 2007 to December 2011 are interpreted in terms of monthly mean, 1◦×1◦, 10 µm dust Aerosol Optical Depth (AOD), mean al-titude and coarse mode effective radius. The geographical study area includes the northern tropical Atlantic and the northwest Arabian Sea, both characterised by strong, regular dust events. The method developed relies on the construc-tion of Look-Up-Tables computed for a large selecconstruc-tion of at-mospheric situations and observing conditions. At a regional scale, a good agreement is found between IASI-retrieved 10 µm AOD and total visible optical depth at 550 nm from either the Moderate resolution Imaging Spectroradiometer (MODIS/Aqua or Terra), or the Multi-angle Imaging Spec-troRadiometer (MISR), or the Polarization and Anisotropy of Reflectances for Atmospheric Science coupled with Ob-servations from a Lidar (PARASOL). Taking into account the ratio existing between infrared and visible AODs, the diversity between the different 550 nm AODs is similar to the difference between these and the IASI AODs. The in-frared AOD to visible AOD ratio, partly reflecting the vary-ing distribution of the dust layer between the dust coarse mode particles seen by IASI, and the fine mode seen by the other instruments, is found to vary with the region ob-served with values close to already published values. Com-parisons between the climatologies of the 10 µm IASI AOD and of the PARASOL non-spherical coarse mode AOD at
865 nm, both expected to be representative of the dust coarse mode, lead to conclusions differing according to the re-gion considered. These differences are discussed in the light of the MODIS Angstr¨om exponent (865–550 nm). At lo-cal slo-cale, around six Aerosol Robotic Network (AERONET) sites, close or far from the dust sources, a similar satisfactory agreement is found between IASI and the visible AODs and the differences between these products are shown and anal-ysed. IASI-retrieved dust layer mean altitudes also compare well with the Cloud-Aerosol Lidar with Orthogonal Polariza-tion (CALIOP/CALIPSO) aerosol mean layer altitude, both in terms of climatology and of zonal evolution throughout the Atlantic. Comparisons between the IASI-retrieved dust coarse mode effective radius and retrievals from AERONET at the six sites brings into evidence an almost systematic bias of about +0.35 µm (IASI-AERONET). Removing this bias leads to a satisfactory agreement between the climatologies of these two products. Overall, these results illustrate the dust westward transport characterised by a fast decrease of the dust optical depth, a somewhat slower decrease of the alti-tude, and an effective radius remaining almost constant dur-ing summer throughout the northern tropical Atlantic. They also demonstrate the capability of high resolution infrared sounders to contribute improving our understanding of pro-cesses related to the aerosols (transport, sources, cycles, ef-fect of aerosols on the terrestrial radiation, etc.).
6066 S. Peyridieu et al.: Characterisation of dust aerosols in the infrared 1 Introduction
Aerosols originate either from natural sources (dust, vol-canic, sea salt aerosols, etc.) or from anthropogenic sources (smoke, sulfates, soot, etc.). In its fourth report, the Intergov-ernmental Panel on Climate Change (IPCC, 2007) notes that, if aerosol forcings are now better understood than at the time of the Third Assessment Report due to improved measure-ments and more comprehensive modelling, they remain the dominant uncertainty in radiative forcing, on the one hand because they show a very high spatio-temporal variability, on the other because they influence many complex processes of the planet. Amongst all aerosol species, mineral dust is a major contributor to total aerosol loading and has been the subject of an increasing number of studies (e.g. Maher et al., 2010; Mahowald et al., 2010; Formenti et al., 2011; Shao et al., 2011; Knippertz et al., 2012). Remote sensing in the visible domain has been widely used to obtain better char-acterisation of these particles and their effect on solar radi-ation. After a long period of relative disinterest in aerosol remote sensing in the infrared (one of the oldest reference is by Legrand et al. (1989) using the low spectral resolu-tion, one window-channel, radiometer on board Meteosat), a marked growing interest in the infrared is now observed with the emergence of hyperspectral instruments as AIRS and IASI (Pierangelo et al., 2004, 2005; De Souza-Machado, 2006; Kl¨user et al., 2011, 2012). Indeed, from infrared re-mote sensing a coherent ensemble of aerosol characteristics can be retrieved simultaneously: AOD, mean altitude and size; this allows the impact of aerosols on terrestrial radia-tion to be quantified. Moreover, infrared and visible spectra are not sensitive to the same ranges of particle size: the coarse mode (size range >1 µm) is preferentially observed in the in-frared, whereas the fine mode (<1 µm) is mostly observed in the visible.
The new generation of high spectral resolution infrared sounders, such as the Atmospheric Infrared Sounder (AIRS) on Aqua, or the Infrared Atmospheric Sounder Interferom-eter (IASI) on Metop, have already shown promising capa-bilities to retrieve dust aerosol properties such as the 10 µm optical depth, the mean altitude, and the mean coarse mode particle size (Pierangelo et al., 2004, 2005; Peyridieu et al., 2010, hereafter referred to as “Pey2010”).
In this study, dust aerosol characteristics are retrieved from a method based on a Look-Up-Table (LUT) approach, already applied to more than 9 yr of AIRS observations (Pey2010), with results being obtained at a space-time res-olution of 1 degree-1 month. Two spectral bands are of par-ticular interest for the retrieval of aerosol properties in the infrared: between 8 and 12 microns, where channels are sen-sitive to both the dust optical depth and the altitude of the dust layer, and around 4 microns, where channels are essen-tially sensitive to the dust optical depth (Pierangelo et al., 2004; Pey2010: see their Fig. 1). Combining channels from these two spectral regions allows simultaneous retrieval of
both properties. Retrieval of the dust coarse mode aerosol ef-fective radius, a variable of prime importance for the study of dust radiative forcing, transport and deposition, uses a channel at about 9.3 µm (Pierangelo et al., 2005) selected for its high sensitivity to dust size and relative insensitivity to other atmospheric components (ozone, sulfates) or to dust asphericity.
This method is applied here to Infrared Atmospheric Sounder Interferometer (IASI) observations for the period from July 2007 to December 2011. Compared to AIRS, IASI has the advantage of a higher spectral resolution (0.50 cm−1 apodized), being constant throughout the whole spectrum, and of a full coverage of the spectral domain, allowing the se-lection of channels more specific to the variable considered. Its drawback is a larger noise at short wavelengths which may be overcome by averaging a few adjacent and radiatively sim-ilar channels.
Data and method are described in Sect. 2. Section 3 presents the results from IASI and comparisons with other aerosol products. For the AOD, these products are derived from the Moderate Resolution Imaging Spectro-radiometer (MODIS/Aqua and Terra), from the Multi-angle Imag-ing SpectroRadiometer (MISR), from the Polarization and Anisotropy of Reflectances for Atmospheric Science coupled with Observations from a Lidar (PARASOL), and from the AErosol RObotic NETwork (AERONET). For the altitude, comparisons are done with the Cloud-Aerosol Lidar with Or-thogonal Polarization (CALIOP/CALIPSO). Finally, the ra-dius is compared with AERONET coarse mode rara-dius. These results are discussed in Sect. 4.
2 Method and data 2.1 Method
The method for the retrieval of dust characteristics from IASI observations was originally developed for application to AIRS (Pierangelo et al., 2004). The present study uses a slightly modified version of this method already described in detail in Pey2010. It is a three-step algorithm based on a “Look-Up-Table” (LUT) approach. The two first steps, de-termination of the atmospheric state observed (using six IASI channels) and simultaneous determination of the 10 µm AOD and aerosol layer mean altitude (using eight IASI channels), have been described in Pey2010. The third step of the algo-rithm is the retrieval of the dust coarse mode effective radius (Reff): the approach follows the one described in Pierangelo et al. (2005). Here, it must be recalled that in the thermal infrared, at the reference 10 µm wavelength, the number of parameters describing the Particle Size Distribution (PSD) can be reduced to one: the effective radius Reff(Pierangelo et al., 2005). In fact, the PSD may be considered as being monomodal and the impact of its width is negligible once the AOD is given. “Radius-LUT” are built for a channel
S. Peyridieu et al.: Characterisation of dust aerosols in the infrared 6067
24 1
2
3
Figure 1a. IASI-retrieved 10 µm AOD climatology. Average is performed over 4 years for 4
January to June and over 5 years from July to December. 5 6 7 8 9 10 11 12 13 14 15 16 17 18 19 20 21 22 23 24 25 26
Fig. 1a. IASI-retrieved 10 µm AOD climatology. Average is performed over 4 yr for January to June and over 5 yr from July to December.
25 1 2 3 4 5 6 7 8 9 10 11 12 13 14 15 16 17 18 19 20 21 22 23 24 25 26 27
Figure 1b. 2007-2011 averaged zonal evolution of the IASI AOD (top-left), the MODIS (Terra) 28
AOD (top-right), the MISR AOD (bottom-left), and the PARASOL AOD (bottom-right), from the 29
African coast to the Caribbean, in June (blue), July (red), and August (green). Data are averaged 30
over the latitude band 10N-30N and over ±3° longitude, around the longitude considered. Black 31
solid line: number of items for July (right ordinate). 32 33 34 35 36 37 38 39
Figure 2. Boundaries of the four regions of study: EA: East Atlantic, MA: Mid-Atlantic, WA: 40
West Atlantic, AS: Arabian Sea. Blue stars indicate the locations of the AERONET sites 41
considered. 42
43 44
Fig. 1b. 2007–2011 averaged zonal evolution of the IASI AOD (top-left), the MODIS (Terra) AOD (top right), the MISR AOD (bottom left), and the PARASOL AOD (bottom-right), from the African coast to the Caribbean, in June (blue), July (red), and August (green). Data are averaged over the latitude band 10◦N–30◦N and over ± 3◦longitude, around the longitude considered. Black solid line: number of items for July (right ordinate).
6068 S. Peyridieu et al.: Characterisation of dust aerosols in the infrared Table 1. Entries used to build the IASI Look-Up-Tables (LUT) of simulated brightness temperatures (BTs) used in the three-step algorithm. BTs for bold-faced values are calculated using the forward coupled radiative transfer model 4AOP-DISORT, BTs for the other values are interpolated (linearly or quadratically).
step 1 : LUT – Atmosphere step 2 : LUT – AOD, altitude step 3: LUT – effective radius
Number of IASI channels 6 8 1
Angles (◦) 0, 5, 10, 15, 20, 25, 30, 35, 40, 45, 50
0, 5, 10, 15, 20, 25, 30, 35, 40, 45, 50
0, 5, 10, 15, 20, 25, 30
AOD values N/A 0.0, 0.1, 0.2, 0.3, 0.4,
0.5, 0.6, 0.7, 0.8
0.1, 0.2, 0.3, 0.4, 0.5, 0.6, 0.7, 0.8
Altitude values (m) N/A 757, 1258, 1756, 2411,
3254, 4116, 4965, 5795
757, 1258, 1756, 2411, 3254, 4116, 4965, 5795 Radii values (µm) N/A 2.3 (Reff) or 3.0 (rmodV)
OPAC/MITR
0.5, 0.8, 1.0, 1.5, 2.0, 2.5, 3.0, 4.0, 5.0
selected at 9.315 µm and for the values of the dust infrared optical depth, mean altitude and Reff of Table 1, using a monomodal lognormal size distribution. In order to simulate IASI brightness temperatures (BT) for the different effec-tive radii, the optical properties were calculated using a Mie code (Mishchenko et al., 2002 and ftp://ftp.giss.nasa.gov/ pub/crmim/spher.f) and the refractive indices of the “Mineral Transported” (MITR) aerosol model from the “Optical Prop-erties of Clouds and Aerosols” (OPAC) database (Hess et al., 1998). For this model, the complex refractive index at 550 nm is 1.53 + 0.0055i and the mode radius is 0.5 µm. Using the at-mospheric and aerosol properties (AOD, altitude) retrieved from the two first steps, the observed BT of the IASI radius-sensitive channel selected is compared to the LUT-simulated BTs for all sampled Reffvalues and the two values framing the observed BT are kept. The retrieved Reff value results from a linear interpolation between their associated Reff val-ues.
Entries used to build the IASI simulated brightness tem-perature LUTs used in the three-step algorithm are given in Table 1. In this Table, the entries in bold face corre-spond to LUTs BTs calculated using the forward coupled ra-diative transfer model 4A/OP-DISORT (Scott and Ch´edin, 1981; Stamnes et al., 1988, http://4aop.noveltis.com). The other entries correspond to LUTs BTs interpolated linearly or quadratically.
Several aspects of the retrieval algorithm such as the ro-bustness to aerosol model (size distribution, shape, and re-fractive index), the possible contamination by other aerosol species, the radiative transfer model bias removal, or the cloud mask including discrimination between clouds and aerosols, etc., were investigated in Pierangelo et al. (2004) and Pey2010. Most of the methodological work developed here has consisted in the adaptation to IASI of the AIRS channels selection procedure.
2.2 Data
In addition to IASI, the core instrument of this study, sev-eral other space-based instruments and their aerosol products have been used for the purpose of comparison and valida-tion: MODIS, MISR and PARASOL, all measuring visible AOD and, therefore essentially sensitive to the fine mode. CALIOP, which is also part of the A-train, provides a mea-sure of the aerosol vertical distribution.
Developed by CNES in collaboration with EUMETSAT, the IASI instrument (Chalon et al., 2001; http://smsc.cnes. fr/IASI), onboard the MetOp-A polar platform, is a Fourier Transform Spectrometer that measures Earth-emitted in-frared radiation. Launched in October 2006 (operational since July 2007), it provides 8461 spectral channels, between 15.5 µm and 3.63 µm, with a spectral resolution of 0.50 cm−1 after apodisation and a regular spectral sampling interval of 0.25 cm−1. Metop-A crosses the Equator at 9:30 p.m. on its ascending node. IASI provides a near global coverage twice a day at a spatial resolution of 12 km at nadir.
MODIS (http://modis.gsfc.nasa.gov/) is an imaging ra-diometer flying on board the Terra platform since Decem-ber 1999 and on board the Aqua platform since May 2002. Its data products are widely used in the aerosol community (Tanr´e et al., 1997; Remer et al., 2005, 2008). Aqua (Terra) crosses the Equator at 01:30 a.m. (10:30 a.m.) on its descend-ing node. Aqua (Terra) crosses the Equator at 01:30 a.m. (10:30 a.m.) on its descending node. This temporal shift with IASI is not significant at the monthly scale. Here, we use the Level 3 monthly products (total and fine mode) from Terra, which provide the optical depth reported at 550 nm at a spatial resolution of 1◦×1◦(see: http://disc.sci.gsfc.nasa. gov/giovanni/overview/index.html). MODIS fine mode AOD is obtained by multiplying the total AOD by the fine mode fraction. We have verified that no significant differences are observed between Terra and Aqua, at least at the monthly scale considered here.
S. Peyridieu et al.: Characterisation of dust aerosols in the infrared 6069 MISR (http://www-misr.jpl.nasa.gov; Diner et al., 2002),
flying on board the Terra platform since December 1999, views the sunlit Earth simultaneously at nine widely spaced angles. The MISR Level 3 global data products are reported on a rectangular grid 0.5◦by 0.5◦degree. Here, use is made of the AOD reported at 555 nm.
Launched in December 2004, PARASOL carries a POLDER-like (Polarization and Directionality of the Earth’s Reflectances) wide field radiometer. The instrument (De-schamps et al., 1994) measures the polarized light in dif-ferent directions for retrieving aerosol and cloud optical and physical properties (Tanr´e et al., 2011). The mission takes also advantage of the other instruments in the A-Train for-mation. Original AOD values are given at 865 nm in the of-ficial PARASOL archive provided by the ICARE datacenter (http://www.icare.univ-lille1.fr/). They are here referenced to 550 nm using the Angstr¨om exponent (865–670) from the Level 2 products (orbits) of the PARASOL archive, then combined into global, monthly products, gridded at a reso-lution of 0.25 degree. Use is also made of the non-spherical coarse mode (NSCM) monthly mean AOD at 865 nm.
Launched in April 2006, the satellite CALIPSO with the on board two-wavelength depolarization lidar CALIOP permits an accurate determination of the aerosol altitude (Winker et al., 2007, 2009; Kim et al., 2008). The depo-larization at 532 nm allows discriminating between the dust aerosols and other types of aerosols which in general do not depolarize light. It should be noted that CALIPSO, a near-nadir viewing instrument, does not offer a full coverage of the Earth (beam diameter of 70 m at the Earth’s surface, 16 days repetition cycle) which makes it difficult to statistically interpret the result. Here, the L2 5 km aerosol layer product (version 3.01) is used to calculate monthly mean altitudes at regional scale. Two classes of aerosols are used for the com-parison of the IASI altitude with the L2 product: “dust” and “polluted dust”. The polluted dust class, which corresponds to dust mixed with other types of aerosols, as biomass burn-ing or urban pollution, is also taken into account. For one CALIOP measurement, up to eight aerosol layers can be re-ported. With the purpose of a simple and robust evaluation of IASI retrievals, only the cases where one aerosol layer is detected and measured by the lidar are selected. The sub-set of CALIOP data resulting from this selection represents about 65 % of all CALIOP data where aerosol layers are de-tected (see Pey2010 for more details). Contrary to CALIOP, the IASI dust retrieval algorithm outputs the mean altitude of the whole dust layer, i.e. the altitude at which half of the AOD is below and half of the AOD is above, with low sensitivity to a complex layering of the dust.
Finally, IASI-retrieved 10 µm AOD and coarse mode ef-fective radius are compared to AERONET (see, for example, Dubovik et al., 2002) visible AOD (550 nm) and coarse mode radius for several sites of the northern tropical Atlantic and one site of the Arabian Sea.
25 1 2 3 4 5 6 7 8 9 10 11 12 13 14 15 16 17 18 19 20 21 22 23 24 25 26 27
Figure 1b. 2007-2011 averaged zonal evolution of the IASI AOD (top-left), the MODIS (Terra) 28
AOD (top-right), the MISR AOD (bottom-left), and the PARASOL AOD (bottom-right), from the 29
African coast to the Caribbean, in June (blue), July (red), and August (green). Data are averaged 30
over the latitude band 10N-30N and over ±3° longitude, around the longitude considered. Black 31
solid line: number of items for July (right ordinate). 32 33 34 35 36 37 38 39
Figure 2. Boundaries of the four regions of study: EA: East Atlantic, MA: Mid-Atlantic, WA: 40
West Atlantic, AS: Arabian Sea. Blue stars indicate the locations of the AERONET sites 41
considered. 42
43 44
Fig. 2. Boundaries of the four regions of study: EA: East Atlantic, MA: Mid-Atlantic, WA: West Atlantic, AS: Arabian Sea. Blue stars indicate the locations of the AERONET sites considered.
3 Results
The period analysed extends from the beginning of IASI operational activity (July 2007) to December 2011. Results are presented for the northern tropics of the Atlantic Ocean and northwest Arabian Sea. Only night-time observations are analysed because of the use of shortwave channels signifi-cantly sensitive to sun radiation.
3.1 IASI 10 µm optical depth 1◦×1◦climatology Figure 1a shows IASI-retrieved monthly climatology (1◦× 1◦) of the dust aerosol mean 10 µm optical depth for the period 07/2007–12/2011. Blank areas correspond to cloudy conditions or no retrievals. This figure clearly shows dust transport, through the so-called Saharan Air Layer (SAL), from the Saharan sources to the Caribbean and North Amer-ica in summer and to the Amazon basin in winter as already described in several publications (see, for example, Chia-pello et al., 1995, 2005; Karyampudi et al., 1999; Kaufman et al., 2005; Huang et al., 2010). Note the “clean” period in November–December as shown in Ben-Ami et al. (2012). Figure 1a is similar to the AIRS climatology of Pey2010 as well as to the MODIS 550 nm AOD climatology (not shown). Figure 1a shows a fast westward decrease of the AOD more clearly seen on Fig. 1b which displays the 2007– 2011 averaged zonal evolution of the AOD from IASI (top-left), and of the total AOD from MODIS(Terra) (top-right), MISR (bottom-left), and PARASOL (bottom-right), from the African coast to the Caribbean, in June, July, and August, for the latitude band 10◦N–30◦N (± 3◦ longitude, 1◦ moving average). All products show a similar fast westward decrease up to 50◦W and then remaining approximately constant, with differences of the same order of magnitude between 0.55 µm AODs as between IASI and the other three products (apart from the ratio observed between IASI 10 µm AOD and the 0.55 µm AODs and discussed in the next section). 3.2 Comparison between IASI 10 µm AOD and visible
MODIS, MISR, and PARASOL AODs at regional scale
For each of the four regions illustrated in Fig. 2, East-Atlantic (EA), Mid-Atlantic (MA), West Atlantic (WA) and Arabian
6070 S. Peyridieu et al.: Characterisation of dust aerosols in the infrared 26 1 2 3 4 5 6 7 8 9 10 11 12 13 14 15 16 17 18 19 20 21 22 23 24 25 26
Figure 3. Climatology of the IASI AOD (10 µm, red, this work), and climatologies of the AOD 27
of MODIS-Terra (total: dashed blue; fine mode: dotted blue), MISR (total: green), and PARASOL 28
(total: dashed grey; fine mode: purple) for each region of study. All visible AODs are scaled by 29
the empirically determined IR/VIS ratio shown on each graph (top-left label). Average over 4 30
(January to June) to 5 (July to December) years. 31 32 33 34 35 36 37
Figure 4. Climatologies of the MODIS AOD, total (solid blue) and fine mode (dotted blue), left 38
ordinate, and of the MODIS Angström exponent (865-550 nm) (green, right ordinate), for the two 39
regions EA and AS. 40
41 42 43
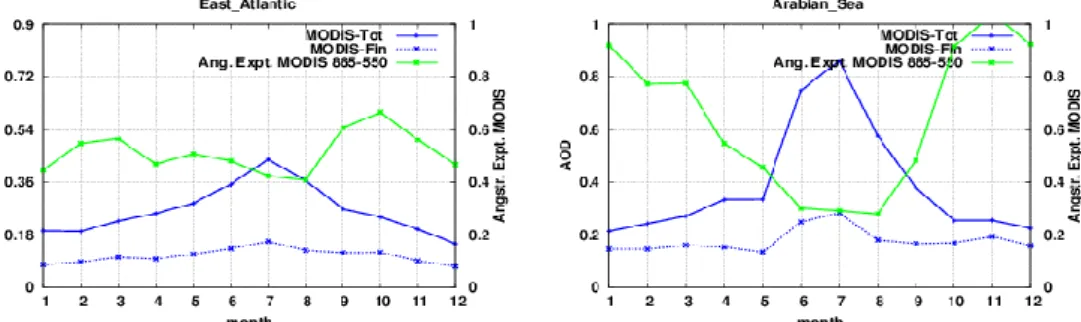
Fig. 3. Climatology of the IASI AOD (10 µm, red, this work), and climatologies of the AOD of MODIS-Terra (total: dashed blue; fine mode: dotted blue), MISR (total: green), and PARASOL (total: dashed grey; fine mode: purple) for each region of study. All visible AODs are scaled by the empirically determined IR/VIS ratio shown on each graph (top left label). Average over 4 (January to June) to 5 (July to December) years.
Sea (AS), Figure 3 shows climatologies of the IASI 10 µm AOD, the MODIS-Terra, total and fine modes AODs, the MISR total AOD, and the PARASOL total and fine modes AODs, for the period July 2007 to December 2011 (January– June: 4-yr average; July–December: 5-yr average). It is worth pointing out that, for the sake of an easier comparison, all visible AODs are scaled by the factor shown on each graph (top-left label) of this figure. This scaling factor actually cor-responds to the infrared (10 µm) to visible (0.55 µm) AOD ratio, determined here empirically, so as to ensure the best match between the IR and the various visible AODs, tak-ing into account both their climatology and their time se-ries. A physical evaluation of this ratio is not straightfor-ward because of its strong dependence on the microphysi-cal properties of the aerosol considered. It can be obtained by a Lorenz-Mie calculation, given as input the refractive index and a size distribution (see Sect. 2.1). For a bimodal lognormal volumic size distribution, that is supposed to be the more appropriate, it requires knowing its modal volu-mic radii, widths, and volume concentrations for both fine and coarse modes for the situation considered (Mishchenko et al., 2002; Dubovik et al., 2002). A direct comparison be-tween infrared and visible AODs is thus difficult. However, the comparison of both products brings information on dust size distribution, in particular, on the relative abundance of fine versus coarse mode particles. Sensitivity tests have been performed in order to determine which variables are the main contributors to the IR/VIS ratio. Results show that the ratio
of the concentration of fine to coarse mode, followed by the effective radius of the coarse mode have the largest influ-ence. Given the range of values obtained from AERONET retrievals (http://aeronet.gsfc.nasa.gov) during the IASI pe-riod on several sites, we found an expected IR/VIS ratio ly-ing between 0.3 and 0.6, with higher values correspondly-ing to smaller fine mode concentrations. These values are consis-tent with the ratios empirically found here. In general, IASI compares well with these scaled total visible AOD climatolo-gies but significant differences are also observed.
For region EA, close to the dust sources, IASI AOD well matches the shape of the MODIS, MISR, and PARASOL AODs. The IR/VIS ratio is 0.45.
For region MA, farther from the sources, the agreement is still good with even smaller differences than for the EA region. The IR/VIS ratio is 0.42.
Region WA shows an IASI AOD season lagging behind the MODIS (or MISR and PARASOL) dust season. This be-haviour had already been pointed out for AIRS in Pey2010 who explained it by a late arrival of the dust coarse mode compared to the fine mode. This late arrival was confirmed by both AERONET 0.55 µm AOD and Angstr¨om exponent at La Parguera (18◦N, 67◦W) station, showing a fast transition between the two aerosol modes in May/June (see Pey2010 for more details). Note that for regions MA and WA, the MODIS fine mode AOD appears significantly larger than that from PARASOL. The IR/VIS ratio is 0.40.
S. Peyridieu et al.: Characterisation of dust aerosols in the infrared 6071 26 1 2 3 4 5 6 7 8 9 10 11 12 13 14 15 16 17 18 19 20 21 22 23 24 25 26
Figure 3. Climatology of the IASI AOD (10 µm, red, this work), and climatologies of the AOD 27
of MODIS-Terra (total: dashed blue; fine mode: dotted blue), MISR (total: green), and PARASOL 28
(total: dashed grey; fine mode: purple) for each region of study. All visible AODs are scaled by 29
the empirically determined IR/VIS ratio shown on each graph (top-left label). Average over 4 30
(January to June) to 5 (July to December) years. 31 32 33 34 35 36 37
Figure 4. Climatologies of the MODIS AOD, total (solid blue) and fine mode (dotted blue), left 38
ordinate, and of the MODIS Angström exponent (865-550 nm) (green, right ordinate), for the two 39
regions EA and AS. 40
41 42 43
Fig. 4. Climatologies of the MODIS AOD, total (solid blue) and fine mode (dotted blue), left ordinate, and of the MODIS Angstr¨om exponent (865–550 nm) (green, right ordinate), for the two regions EA and AS.
For region AS, covering the Arabian Sea, south of the Arabian Peninsula, the situation is more complex. Signifi-cant differences are observed between the various products in June–July and, in August–September, IASI displays slightly larger AODs. Differences are also seen for the four months October–January, with significantly lower IASI AODs. The IR/VIS ratio is 0.31. These differences can partly be ex-plained by the different behaviour of the MODIS Angstr¨om exponent (865–550 nm) shown on Fig. 4 together with the climatologies of the MODIS total and fine modes AODs for the two regions EA and AS, closest to source regions. While EA region shows a relatively flat Angstr¨om exponent, with maxima in September–November and minima in July– August, the AS region shows a pronounced low (∼0.3 in-stead of ∼0.4) of the Angstr¨om exponent in June–August and high values (>0.9) in October–January. This indicates a summer peak period largely dominated by the coarse mode (Smirnov et al., 2002; Eck et al., 2008), seemingly more in phase with the flat PARASOL fine mode AOD than with the MODIS fine mode peak of June–July (Figs. 3 and 4). Moreover, the high Angstr¨om exponent values of the four months October–January coincide with the low IASI AOD values for this region (Fig. 3) indicating the dominating in-fluence of the fine mode almost not seen by IASI. For the seven first months, IASI appears more in phase with MISR. For IASI and for this region, however, there may be some doubts about the use of the MITR aerosol model, in particu-lar, because of the presence observed of carbonate minerals from deposits along the Oman/Yemen and United Arab Emi-rates coasts (Reid et al., 2005, 2008) or the possible mixing of dust with anthropogenic pollution aerosols either from the petroleum industry in the Arabian peninsula or from India.
The IR/VIS ratios shown on Fig. 3 for regions EA (∼0.45), MA (∼0.42), and WA (∼0.40) are consistent with the ex-pected range of ratios obtained from AERONET results, and are in reasonable agreement with values from Highwood et al. (2003) (see also Pierangelo et al., 2004). For region AS, the ratio comes to ∼0.31, much smaller than for the other regions. These ratios reflect, at least in part, the varying dis-tribution of the dust layer between the coarse and the fine
modes (and, obviously, the difference between the observa-tion wavelengths).
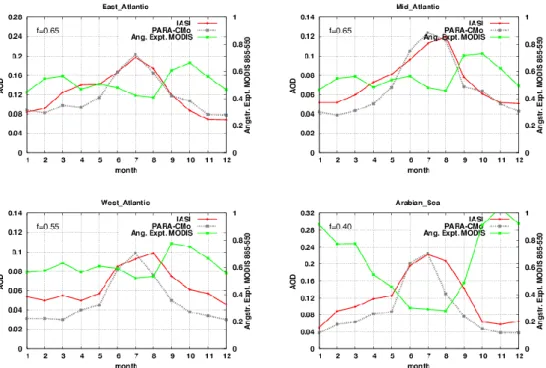
We also compared the 10 µm IASI AOD with the NSCM AOD at 865 nm derived from PARASOL, both being specific of the dust particle coarse mode. These two AOD climatolo-gies are shown in Fig. 5 together with that of the MODIS Angstr¨om exponent (865–550 nm). To approximately match the IASI AOD, the NSCM AOD has been scaled by a ra-tio, actually the IR/VIS coarse mode rara-tio, chosen in such a way that the best agreement is obtained around the peak of the dust season. Indeed, more coarse mode is expected to be present at this time of the year. This ratio corresponds to the only coarse mode and can be estimated theoretically using the same refractive index than previously and a monomodal lognormal distribution. This time, the variables that have the strongest impact on this ratio are the effective radius and the standard deviation of the distribution. Such a ratio decreases with the effective radius and increases with the width of the distribution. For typical values from AERONET, the ratio 10 µm IASI AOD/ 865 nm PARASOL NSCM AOD is ex-pected to lie between 0.7 and 0.9. These values are higher than the one found here, which would imply, if IASI actu-ally retrieves the same coarse mode as the one obtained from PARASOL observations, an underestimation of the IASI AOD. On the other hand, the PARASOL NSCM AOD could also be slightly overestimated. An analysis of the monthly ratio 865 nm PARASOL NSCM AOD/ 865 nm PARASOL total AOD leads to values sometimes above 0.9 and even 1.0, higher than the values theoretically expected. Indeed, estimating the coarse mode contribution to the total AOD at 865 nm (following Pierangelo, 2013) for typical values of the size distribution parameters taken from AERONET, leads to values lower than 0.85. Nevertheless, with a ratio IASI/ 865 nm PARASOL NSCM of 0.65 for the EA and the MA regions, a relatively good agreement is found between the two products with a slightly faster start of the IASI season. For both regions and both products, the rapid decrease of the AOD in August–September coincides with the rapid increase of the Angstr¨om exponent. With a ratio IASI/PARASOL NSCM of 0.55 (resp. 0.40) for the WA (resp. AS) region,
6072 S. Peyridieu et al.: Characterisation of dust aerosols in the infrared 27 1 2 3 4 5 6 7 8 9 10 11 12 13 14 15 16 17 18 19 20 21 22 23 24 25 26 27 28
Figure 5. IASI 10 µm AOD climatology (red, left ordinate) and PARASOL non-spherical coarse 29
mode (CMo) AOD at 865 nm climatology (scaled by the empirically determined IR/VIS ratio 30
shown on each graph: top-left label) for the four regions of study (grey, left ordinate); climatology 31
of the MODIS Angström exponent (865-550 nm) (green, right ordinate). Average over 4 (January 32
to June) to 5 (July to December) years. 33 34 35 36 37 38 39 40 41 42 43 44 45 46 47 48 49 50 51 52 53
Fig. 5. IASI 10 µm AOD climatology (red, left ordinate) and PARASOL non-spherical coarse mode (CMo) AOD at 865 nm climatology (scaled by the empirically determined IR/VIS ratio shown on each graph: top-left label) for the four regions of study (grey, left ordinate); cli-matology of the MODIS Angstr¨om exponent (865–550 nm) (green, right ordinate). Average over 4 (January to June) to 5 (July to December) years.
the agreement between the two products is significantly less good, particularly outside the peak of the season. For the WA region, however, both products confirm the late start of the dust coarse mode season and show the same sharp Spring transition in May/June. A similar behaviour is observed for the AS region. In both cases, the sharp decrease of IASI AOD in August–September occurs in phase with the increase of the Angstr¨om exponent, but occurs one month sooner for the PARASOL NSCM AOD. This makes the IASI season one month longer than seen by PARASOL, again more in phase with the Angstr¨om exponent behaviour. In general, the ra-tio IASI/PARASOL NSCM is smaller to what is expected (∼0.5, with the exception of Tenerife). The impact of the dust fine mode on the IASI AOD cannot explain this difference: for dust with a typical bimodal distribution, the fine mode contribution to the total optical depth at 10 µm is usually of the order of 10 % (Pierangelo, 2013). Another explanation could come from the (hypothetical) presence of polluted dust (possibly including the hygroscopic growth of the fine mode particles, Smirnov et al., 2002) that present more spherical particles not fully accounted for in the NSCM AOD. This re-sult could also indicate that the use of the MITR model is not appropriate for all the regions, and particularly for AS due to the heterogeneity of the aerosol types observed in this region (Kaskaoutis et al., 2010).
Finally, the interannual variability seen by the visible in-struments is also well reproduced by IASI, as shown by
their AOD time series for the four regions of study (Fig. 6). Again, region WA well depicts the late arrival of the coarse mode relatively to the fine mode. Some discrepancies are also found, for example, in March–May 2009 for region EA, or in August–September 2010 for region MA.
3.3 Comparisons between IASI 10 µm AOD and visible MODIS, MISR, PARASOL and AERONET AODs at six AERONET sites
Comparisons between IASI 10 µm AOD and visible MODIS, MISR, PARASOL and AERONET AODs have been done at six AERONET sites, namely: Tenerife (La Laguna), Capo Verde, Dakar, Barbados, La Parguera, all in the Atlantic re-gions, and Karachi, in the AS region (sites indicated by a star on Fig. 2). Figure 7 shows climatologies of the IASI AOD, of the visible AOD from MODIS-Terra (total), MISR (to-tal), PARASOL (total and fine mode), and from AERONET (500 nm AOD) at these sites (N.B.: for Capo Verde, the AERONET AOD is at 440 nm as no 500 nm AOD is avail-able). Time average is made over 4 (January to June) to 5 (July to December) years for the satellite products. For AERONET data, we consider that at least two years must be reported for averaging. Space average is made over an area ±1.5◦in latitude and longitude, centred on each site; pixels flagged “land” are excluded. On the whole, the agreement be-tween IASI and the other sources of data appears satisfactory with, however, differences from one site to another.
S. Peyridieu et al.: Characterisation of dust aerosols in the infrared 6073
28 1
2 3
Figure 6. Time series of the 10 µm IASI AOD (red) , and of the MODIS-Terra (blue), MISR 4
(green), and PARASOL (grey), total 550 nm AODs, for the EA region (top-left), the MA region 5
(top-right), the WA region (bottom-left), the AS region (bottom-right). All visible AODs are 6
scaled by the empirically determined IR/VIS ratio shown on each graph (top-left label). 7 8 9 10 11 12 13 14 15 16 17 18 19 20 21 22 23 24 25 26 27 28 29 30
Fig. 6. Time series of the 10 µm IASI AOD (red), and of the MODIS-Terra (blue), MISR (green), and PARASOL (grey), total 550 nm AODs, for the EA region (top left), the MA region (top right), the WA region (bottom left), the AS region (bottom right). All visible AODs are scaled by the empirically determined IR/VIS ratio shown on each graph (top left label).
For Tenerife (La Laguna), IASI and the visible (total) AOD climatologies display similar shapes with relatively small differences. A more pronounced difference is observed between AERONET and the other satellite data, as already reported by Kalashnikova and Kahn (2008) for the neigh-bouring site of Izana, where this difference is even larger. The meteorological conditions currently prevailing at these sites, marked by strong low level intrusions of cold air, may at least partially explain this problem. At Capo Verde, the IASI dust season starts more rapidly. At Dakar, IASI is more in phase with MISR and AERONET (several months are miss-ing) than with MODIS or PARASOL which peak months ap-pear two to three months later. The reason for this difference is still unclear. At the site of Barbados, far from the sources, IASI AOD is larger than the other AODs in August and de-creases less rapidly; at this site, the AERONET AOD is sub-stantially smaller than the other visible AODs, a result also observed by Kalashnikova and Kahn (2008) at the nearby site of Guadeloup (16◦N, 61◦W). At La Parguera, the over-all agreement is satisfactory but, as for Barbados, the IASI season decreases less rapidly than shown by the other prod-ucts. For both sites, the PARASOL AOD peak is significantly larger than the other visible AOD peaks. In the Arabian Sea region, at Karachi site, IASI AOD performs relatively well (again larger in August) in spite of our use of the MITR model most probably less adapted to this region.
Figure 8 shows the climatologies of the 10 µm IASI AOD, of the PARASOL NSCM AOD at 865 nm, scaled by the IR/VIS ratio (label top-left on each graph) empirically esti-mated, as in Fig. 5, to approximately match the IASI AOD around the peak of the dust season, and of the MODIS Angstr¨om exponent. For Tenerife, the agreement is relatively good with a ratio of 0.95. At Capo Verde, if the agreement is satisfactory from June to December, IASI starts much more rapidly than the 865 nm PARASOL NSCM AOD does. It may however be observed that the Spring sharp gradient of the Angstr¨om exponent, indicative of a change in the aerosol modes distribution, is more in phase with IASI than with PARASOL. Almost the same situation is observed at Dakar. The IASI AOD, well in phase with the AERONET or MISR AODs (see Fig. 7), peaks two months earlier than the PARA-SOL NSCM AOD. The situation is different far from the sources (at Barbados and La Parguera) and in the Arabian sea (at Karachi) with IASI dust seasons significantly longer than the PARASOL NSCM ones, but again appearing more in phase with the MODIS Angstr¨om exponent gradients, par-ticularly at Barbados. As for the WA and AS regions (Fig. 5), IASI AOD lies significantly above PARASOL outside the summer months.
All together, these comparisons, with differences between IASI and the other products of the same order of magnitude as between the other products themselves, demonstrate the ability of IASI to work properly at small scale. They also
6074 S. Peyridieu et al.: Characterisation of dust aerosols in the infrared 29 1 2 3 4 5 6 7 8 9 10 11 12 13 14 15 16 17 18 19 20 21 22 23 24 25 26 27 28 29 30 31 32 33 34 35 36 37 38 39 40 41
Figure 7. Climatology of the 10 µm IASI AOD (red, left ordinate), and of the AODs from 42
MODIS-Terra (total: blue), MISR (total: green), PARASOL (total: grey; fine mode: purple), and 43
AERONET (500 nm: cyan), right ordinate, for the six AERONET sites. Time average over 4 44
(January to June) to 5 (July to December) years; space average over an area ±1.5° in latitude and 45
longitude, centred on each site. N.B.: for Capo Verde, the AERONET AOD is at 440 nm (no 46
AOD-500 available). Visible AODs are scaled by the empirically determined IR/VIS ratio shown 47 on each graph. 48 49 50 51 52 53
Fig. 7. Climatology of the 10 µm IASI AOD (red, left ordinate), and of the AODs from MODIS-Terra (total: blue), MISR (total: green), PARASOL (total: grey; fine mode: purple), and AERONET (500 nm: cyan), right ordinate, for the six AERONET sites. Time average over 4 (January to June) to 5 (July to December) years; space average over an area ± 1.5◦in latitude and longitude, centred on each site. N.B.: for Capo Verde, the AERONET AOD is at 440 nm (no AOD-500 available). Visible AODs are scaled by the empirically determined IR/VIS ratio shown on each graph.
indicate that dust models more adapted to the region (or site) observed have to be constructed and substituted to the MITR model.
3.4 IASI altitude time series versus CALIOP altitude It is worth recalling that the altitudes seen by either IASI or by CALIOP do not correspond to the same definition. For IASI, it is an “infrared-equivalent” altitude, i.e. the altitude at which half of the dust optical depth at 10 µm is below and half of the optical depth at 10 µm is above, when, for CALIOP, it is the centre of the attenuated backscatter coeffi-cient profile (“centroid”).
Figure 9a shows the dust layer monthly mean altitude time series (July 2007–September 2011) for IASI and CALIOP, averaged over regions EA, MA and AS of Fig. 2. For IASI, months with no data correspond to an insufficient number of items in the statistics mostly due to cloudiness or to rejec-tions from the algorithm. Region WA is not shown for the same reason. For these three regions, a clear seasonal cycle is seen, with the monthly mean altitude being higher dur-ing summer than durdur-ing winter. This transport pattern is con-sistent with conclusions from numerous other studies (see, for example, Prospero et al., 1981; Chiapello et al., 1995, 2005). Averaged over the whole period shown on Fig. 9a, the mean and the standard deviations of the difference between
S. Peyridieu et al.: Characterisation of dust aerosols in the infrared 6075 30 1 2 3 4 5 6 7 8 9 10 11 12 13 14 15 16 17 18 19 20 21 22 23 24 25 26 27 28 29 30 31 32 33 34 35 36 37 38 39 40 41 42 43
Figure 8. IASI 10 µm AOD climatology (red, left ordinate) versus PARASOL non-spherical 44
coarse mode AOD at 865 nm climatology (scaled by the empirically determined IR/VIS ratio 45
shown on each graph: top-left label) for the six AERONET sites (grey, left ordinate); climatology 46
of the MODIS Angström exponent (865-550 nm) (green, right ordinate). Average over 4 (January 47
to June) to 5 (July to December) years. 48 49 50 51 52 53
Fig. 8. IASI 10 µm AOD climatology (red, left ordinate) versus PARASOL non-spherical coarse mode AOD at 865 nm climatology (scaled by the empirically determined IR/VIS ratio shown on each graph: top-left label) for the six AERONET sites (grey, left ordinate); climatology of the MODIS Angstr¨om exponent (865–550 nm) (green, right ordinate). Average over 4 (January to June) to 5 (July to December) years.
IASI and CALIOP mean altitudes, for regions EA, MA, and AS, respectively, come to −140 ± 290 m, −180 ± 270 m, and −220 ± 470 m. These results illustrate the good consis-tency between the two products keeping in mind (i), the large difference between the spatial and temporal samplings of the IR sounder and of CALIOP, (ii), the variability associated with IASI and CALIOP altitudes during the summer peak season (of the order of 800 m and 1 km, respectively), these values more reflecting the variability of the aerosol layer (one month, 1◦) than the accuracy of the products themselves, (iii), the different definitions of the mean altitude retrieved by IASI or by CALIOP. The agreement is significantly less good for region AS than for the other two, particularly con-cerning the amplitude of the seasonal cycle. Again, the use of
the MITR model may be in question and future plans include the construction of models better adapted to this situation. A relatively slow regular decrease of the altitude from east to west (from about 3 km at 20◦W to 1.5 km at 80◦W), al-ready reported in several studies (see, for example, Colarco et al., 2003a, b, and references therein), appears on Fig. 9b, for both CALIOP and IASI. The decrease is somewhat faster for CALIOP from 20◦W to 60◦W.
This comparison illustrates the ability of infrared sounders to retrieve dust aerosols altitude that compare relatively well with that of CALIOP.
6076 S. Peyridieu et al.: Characterisation of dust aerosols in the infrared 31 1 2 3 4 5 6 7 8 9 10 11 12 13 14 15 16 17 18 19 20 21 22 23 24 25
Figure 9a. Altitude (km) time series of IASI (red), and CALIOP (blue), for the period July 2007 26
to December 2011, and for the regions EA (top-left), MA (top-right), and AS (bottom). 27
28 29
Figure 9b. 2007-2011 averaged zonal evolution of the IASI (left) and CALIOP (right) altitude, from the African coast to the Caribbean, in June (blue), July (red), and August (green). Data are averaged over the latitude band 10N-30N and over ±3° longitude, around the longitude considered. Black solid line: number of items for July (right ordinate).
Fig. 9a. Altitude (km) time series of IASI (red), and CALIOP (blue), for the period July 2007 to September 2011, and for the regions EA (top left), MA (top right), and AS (bottom).
31 1 2 3 4 5 6 7 8 9 10 11 12 13 14 15 16 17 18 19 20 21 22 23 24 25
Figure 9a. Altitude (km) time series of IASI (red), and CALIOP (blue), for the period July 2007 26
to December 2011, and for the regions EA (top-left), MA (top-right), and AS (bottom). 27
28 29
Figure 9b. 2007-2011 averaged zonal evolution of the IASI (left) and CALIOP (right) altitude, from the African coast to the Caribbean, in June (blue), July (red), and August (green). Data are averaged over the latitude band 10N-30N and over ±3° longitude, around the longitude considered. Black solid line: number of items for July (right ordinate).
Fig. 9b. 2007–2011 averaged zonal evolution of the IASI (left) and CALIOP (right) altitude, from the African coast to the Caribbean, in June (blue), July (red), and August (green). Data are averaged over the latitude band 10◦N–30◦N and over ± 3◦longitude, around the longitude considered. Black solid line: number of items for July (right ordinate).
3.5 IASI dust coarse mode effective radius
As reported in Pierangelo et al. (2005), the sensitivity of infrared BTs to the particle size is a few tenths of Kelvin, an order of magnitude smaller than their sensitivity to ei-ther AOD or altitude, making it only slightly larger than the IASI radiometric noise. Moreover, the smaller the AOD the smaller the sensitivity to the radius, and the less reli-able the retrieved radius. Figure 10a presents the monthly climatology (1◦×1◦) of the IASI-retrieved dust coarse mode effective radius (Reff) for the period 07/2007–12/2011. As expected, months outside the dust season appear noisier. Cleaner results are obtained within the period April-May to September. This 5-yr monthly climatology reveals relatively small variations of Reff, from highest values of about 2.2– 2.3 µm close to the African coasts and over the Arabian Sea
to lowest values around 1.8–1.9 µm, mostly at the southern or northern edges of the dust layer. Figure 10b shows the 2007–2011 averaged zonal evolution of the IASI effective radius, from the African coast to the Caribbean, in June, July, and August. Data are averaged over the latitude band 10◦N–30◦N and over ± 3◦longitude, around the longitude considered. With an almost constant value of about 2 µm, this figure confirms the findings of Maring et al. (2003a) who had noted that “Normalized mineral dust size distri-butions of particles smaller than 7.3 µm over the Canary Islands and Puerto Rico were indistinguishable, indicating these particles were not preferentially removed during atmo-spheric transport” (see also Christopher and Jones, 2010). IASI-retrieved radius values are in reasonable agreement with AERONET-retrieved dust coarse mode effective radius
S. Peyridieu et al.: Characterisation of dust aerosols in the infrared 6077
32
1
2
3
Figure 10a. IASI-retrieved dust coarse mode effective radius (µm) climatology. Average over 4
4
(January to June) to 5 (July to December) years.
5
6
Figure 10b. Same as Fig. 9b for the IASI radius.
Fig. 10a. IASI-retrieved dust coarse mode effective radius (µm) climatology. Average over 4 (January to June) to 5 (July to December) years.
32
1
2 3
Figure 10a. IASI-retrieved dust coarse mode effective radius (µm) climatology. Average over 4 4
(January to June) to 5 (July to December) years. 5
6
Figure 10b. Same as Fig. 9b for the IASI radius.
Fig. 10b. Same as Fig. 9b for the IASI radius.
monthly mean values (http://aeronet.gsfc.nasa.gov/new web/ optical properties.html) at various sites. Preliminary compar-isons have brought into evidence an overall systematic pos-itive bias of ∼ +0.35 µm between IASI and AERONET re-trievals. To facilitate the comparison, this bias, still not un-derstood, has then been removed from the IASI results of Fig. 11, a choice which does not mean that more confidence should be given to either AERONET or to IASI. This fig-ure shows the dust coarse mode effective radius climatol-ogy from IASI and from AERONET at the six sites
consid-ered here. IASI retrieved AOD (grey) is also shown (right ordinate). IASI missing months correspond to too small IASI AODs (<0.04). Here again, small variations of Reff are seen, with noisier IASI results at La Laguna (Tenerife) and Karachi. As for the AOD, the site of La Laguna shows different results with a larger positive bias of ∼0.50 µm (0.35 + 0.15). A rather good agreement comes out from these comparisons (however, still too limited) with this quasi op-erational network. Such comparisons also raise the question of the accuracy of AERONET measurements (Ryder et al., 2013; M¨uller et al., 2012). Comparisons with in situ cam-paign measurements are more problematic as shown by Reid et al. (2003a) who compared various methods of measure-ment of dust particles coarse mode from Africa and empha-sised the uncertainties in the sizing methods and on the am-biguities in the size parameters. It is worth noting that M¨uller et al. (2012), comparing AERONET data and airborne mea-surements during the SAMUM 2006 campaign, found out that the effective radius of the coarse mode fraction of min-eral dust derived from sun photometer was twice as small as that from the airborne observations.
6078 S. Peyridieu et al.: Characterisation of dust aerosols in the infrared
33
Figure 11. Dust coarse mode effective radius climatology from IASI (red) and AERONET (blue)
for the six AERONET sites. IASI retrieved AODs (dotted grey) are also shown (right ordinate).
IASI missing months are due to too small AODs (<0.04) or to not enough items in the statistics. A
systematic bias of 0.35 µm has been subtracted to IASI radius results (see text).
Fig. 11. Dust coarse mode effective radius climatology from IASI (red) and AERONET (blue) for the six AERONET sites. IASI retrieved AODs (dotted grey) are also shown (right ordinate). IASI missing months are due to too small AODs (<0.04) or to not enough items in the statistics. A systematic bias of 0.35 µm has been subtracted to IASI radius results (see text).
4 Discussion and conclusions
The main characteristics of the northern tropical Atlantic and Arabian Sea dust aerosol layers, i.e. 10 µm AOD, mean alti-tude, and coarse mode effective radius, have been retrieved from IASI and compared with MODIS-Terra (no significant differences seen with Aqua at the monthly level) total and fine modes AOD, MISR total AOD, PARASOL total, fine and non-spherical coarse modes AOD, AERONET AOD, CALIOP mean altitude, and AERONET radius retrievals. Such comparisons have been made at regional scale, over the northern tropical Atlantic and the Arabian Sea, as well as at local scale around six AERONET sites. The retrieval method is a three-step algorithm (retrieval of (i), the atmospheric en-vironment, (ii), of the AOD and altitude, (iii), of the effec-tive radius), based on the use of Look-Up-Tables computed
using the 4A/OP-DISORT radiative transfer model in its op-erational version. Use is made of the MITR aerosol model from the OPAC database (Hess et al., 1998).
Maps of the aerosol 10 µm IASI AOD over the Atlantic Ocean illustrate the main patterns of dust transport: during the May–September dust season, a fast westward decrease of the optical depth is observed, from about 0.2 at the African coast to about 0.1 at ∼55◦W. This value remains approx-imately constant up to the Caribbean. MODIS, MISR and PARASOL visible AODs at 550 nm confirm these results.
Comparisons at regional scale (three regions of the north-ern tropical Atlantic: East Atlantic (EA), Mid-Atlantic (MA), West Atlantic (WA) and one region of the Arabian Sea (AS)) show a good agreement between IASI and the other instru-ments either during the summer peak of the dust season or outside of it. Differences between IASI AODs and the
S. Peyridieu et al.: Characterisation of dust aerosols in the infrared 6079 properly scaled (see Sect. 3.2) 0.55 µm AODs are of the same
order of magnitude as between them. The IR AOD to Visible AOD ratio is found to vary with the region, from about 0.45 eastward to 0.40 westward and 0.31 for the Arabian Sea, re-flecting, at least in part, the varying distribution of the dust layer between the coarse and the fine modes (and, obviously, the difference between the observation wavelengths). These ratios are in reasonable agreement with values expected from AERONET and with already published values (Highwood et al., 2003). Both expected to be representative of the dust coarse mode, the climatologies of the 10 µm IASI AOD and of the PARASOL non-spherical coarse mode (NSCM) AOD at 865 nm, compare well for the two regions EA and MA even if the ratio AOD IASI/ PARASOL NSCM AOD is lower than theoretically expected. For the two regions WA and AS, the comparison reveals a coarse mode dust season longer for IASI than for PARASOL NSCM, the former seemingly more in phase with the MODIS 865–550 nm Angstr¨om exponent gradients. Outside the season, the ratio IASI AOD/ PARA-SOL NSCM AOD is significantly larger than inside. This re-sult could indicate that the use of the MITR model is not ap-propriate for all the regions, and particularly for AS. Another explanation could come from the presence of large, more spherical, polluted dust particles, including the hygroscopic growth of the fine mode particles (Smirnov et al., 2002; Eck et al., 2008; Basart et al., 2009), not fully accounted for in the NSCM AOD. Still at regional scale, time series of the IASI AOD illustrate the dust natural cycle as well as its interannual variability, in good agreement with 0.55 µm AODs.
On a local scale, around six AERONET sites, results are similar with a general good agreement between IASI and the other instruments or the AERONET AODs. Two noticeable exceptions for the latter are Tenerife (La Laguna) and Barba-dos with all space-borne instruments (including IASI) mea-suring too high AODs compared to AERONET, particularly in summer. This discrepancy had already been observed by Kalashnikova and Kahn (2008). Conclusions similar to that obtained at regional scale are obtained when comparing IASI AOD to PARASOL NSCM AOD with largest differences ob-served outside the dust season for sites far from the sources (Barbados and La Parguera).
A relatively slow regular decrease of the altitude from east to west (from about 3 km at 20W to 1.5 km at 80◦W), already reported in several studies (see, for example, Colarco et al., 2003a, b; Ben-Ami et al., 2009; Tsamalis et al., 2013), ap-pears on Fig. 9b, for both CALIOP and IASI. The decrease is somewhat faster for CALIOP (∼25 m deg−1) than for IASI (∼20 m deg−1). The agreement between IASI and CALIOP mean altitudes is quite satisfactory (bias of the order of −0.25 km and standard deviation of the order of 0.28 km, av-eraged over the whole period studied) for the regions EA and MA, slightly less satisfactory for the AS region (−0.22 km and 0.47 km, respectively). Not enough items are available for region WA. These results must be analysed having in mind the large difference between the spatial and temporal
samplings of these two sounders, and the different definitions of the mean altitude retrieved by IASI and by CALIOP. Such results illustrate the capability of IR sounders to retrieve a meaningful dust layer altitude on a global scale over ocean.
Another interesting feature of this work is the retrieval of the dust coarse mode effective radius (Reff) from IASI, a vari-able of prime importance for the study of dust radiative forc-ing, transport and deposition. The method developed follows that of Pierangelo et al. (2005). A 5-yr climatology of the dust effective radius has been obtained, revealing relatively small variations of Reff, from highest values of about 2.2– 2.3 close to the African coasts and over the Arabian Sea to lowest values around 1.8–1.9 µm, mostly at the southern or northern edges of the dust layer. This result agrees with the findings of the PRIDE campaign (Maring et al., 2003a, b; Reid et al., 2003b). Compared to AERONET-retrieved val-ues, these results bring into evidence a positive bias of IASI of about 0.35 µm. Work is in progress to explain this differ-ence. The main interest of the present results is to bring a global and consistent view of the coarse mode dust particle size throughout its transport to the Caribbean and over the Arabian Sea.
Further potential improvements are numerous: increase of the IASI aerosol products space-time resolution from (1◦, 1 month) to (1 spot, 1 day) (Tsamalis et al., 2011); retrieval of dust characteristics over land, using maps of the infrared surface emissivity at high spectral resolution (0.05 µm) and skin temperature retrieved from IASI (Capelle et al., 2012); extension in latitude; improvements of the assumptions con-cerning the aerosol models presently used. Future work also includes deeper validation/evaluation of the present aerosol products. Finally, CNES has begun feasibility studies on a new-generation atmospheric sounding interferometer (IASI-Next Generation) to be flown aboard the second-generation MetOp satellites. IASI NG will improve the IASI perfor-mances by a factor of two in both the spectral resolution and radiometric noise, leading to major improvements in the accuracy of retrieved aerosol characteristics: AOD, altitude, and, particularly, effective radius.
Acknowledgements. MODIS and MISR data were obtained
through NASA Giovanni, an online visualisation and analysis tool maintained by the Goddard Earth Sciences (GES) Data and Information Services Centre (DISC). PARASOL data have been extracted from the archive maintained by the ICARE datacenter (http://www.icare.univ-lille1.fr/). We thank the PI investigators and their staff for establishing and maintaining the AERONET sites used in this investigation. We are also happy to thank the ICARE Thematic Centre for providing us with CALIPSO/CALIOP data (http://www.icare.univ-lille1.fr/). This work has been supported in part by the European Community under the Grant Agreement no. 283576 (MACC project) and by CNRS, CNES and Ecole Polytechnique. We have also benefited from the large facilities of IDRIS, the computer centre of CNRS.
6080 S. Peyridieu et al.: Characterisation of dust aerosols in the infrared Edited by: E. Highwood
The publication of this article is financed by CNRS-INSU.
References
Basart, S., P´erez, C., Cuevas, E., Baldasano, J. M., and Gobbi, G. P.: Aerosol characterization in Northern Africa, Northeastern At-lantic, Mediterranean Basin and Middle East from direct-sun AERONET observations, Atmos. Chem. Phys., 9, 8265–8282, doi:10.5194/acp-9-8265, 2009.
Ben-Ami, Y., Koren, I., and Altaratz, O.: Patterns of North African dust transport over the Atlantic: winter vs. summer, based on CALIPSO first year data, Atmos. Chem. Phys., 9, 7867–7875, doi:10.5194/acp-9-7867-2009, 2009.
Ben-Ami, Y., Koren, I., Altaratz, O., Kostinski, A., and Lehahn, Y.: Discernible rhythm in the spatio/temporal distributions of transatlantic dust, Atmos. Chem. Phys., 12, 2253–2262, doi:10.5194/acp-12-2253-2012, 2012.
Capelle, V., Ch´edin, A., P´equignot, E., Schl¨ussel, P., Newman, S. M., and Scott, N. A.: Infrared continental surface emissiv-ity spectra and skin temperature retrieved from IASI observa-tions over the tropics. J. Appl. Meteor. Climatol., 51, 1164–1179, doi:10.1175/JAMC-D-11-0145.1, 2012.
Chalon, G., Cayla, F., and Diebel, D.: IASI: An Advanced Sounder for Operational Meteorology, Proceedings of the 52nd Congress of IAF, Toulouse France, October 2001, 2001.
Chiapello, I., Bergametti, G., Gomes, L., Chatenet, B., Dulac, F., Pimenta, J., and Santos Suares, E.: An additional low layer trans-port of Sahelian and Saharan dust over the North-Eastern Tropi-cal Atlantic, Geophys. Res. Lett., 22, 3191–3194, 1995. Chiapello, I., Moulin, C., and Prospero, J. M.:
Understand-ing the long-term variability of African dust transport across the Atlantic as recorded in both Barbados surface concen-trations and large-scale Total Ozone Mapping Spectrometer (TOMS) optical thickness, J. Geophys. Res., 110, D18S10, doi:10.1029/2004JD005132, 2005.
Christopher, S. A. and Jones, T.: Satellite and surface-based remote sensing of Saharan dust aerosols, Remote Sens. Environ., 114, 1002–1007, doi:10.1016/j.rse.2009.12.007, 2010.
Colarco, P. R., Toon, O. B., and Holben, B. N.: Saharan dust trans-port to the Caribbean during PRIDE: 1. Influence of dust sources and removal mechanisms on the timing and magnitude of down-wind aerosol optical depth events from simulations of in situ and remote sensing observations, J. Geophys. Res., 108, 8589, doi:10.1029/2002JD002658, 2003a.
Colarco P. R., Toon, O. B., Reid, J. S., Livingston, J. M., Russell, P. B. Redemann, J. Schmid, B., Maring, H. B., Savoie, D., Wel-ton, E. J., Campbell, J. R., Holben, B. N., and Levy, R.: Sa-haran dust transport to the Caribbean during PRIDE: 2. Trans-port, vertical profiles, and deposition in simulations of in situ and remote sensing observations, J. Geophys. Res., 108, 8590, doi:10.1029/2002JD002659, 2003b.
De Souza-Machado, S., Strow, L. L., Motteler, H., and Hannon, S.: Infrared dust spectral signatures from AIRS, Geophys. Res. Lett., 33, L03801, doi:10.1029/2005GL024364, 2006.
Deschamps, P.-Y., Br´eon, F.-M., Leroy, M., Podaire, A., Bricaud, A., Buriez, J.-C., and S`eze, G.: The POLDER mission: In-strument characteristics and scientific objectives. IEEE Trans. Geosci. Remote Sens., 32, 598–615, 1994.
Diner, D. J., Beckert, J. C., Bothwell, G. W., and Rodriguez J. I.: Performance of the MISR Instrument During Its First 20 Months in Earth Orbit, IEEE. Trans. Geosci. Rempte Sens. 40, 1449– 1466, 2002.
Dubovik, O., Holben, B., Eck, T., Smirnov, A., Kaufmann, Y., King, M., Tanr´e, D., and Slutsker, I.: Variability of absorption and op-tical properties of key aerosol types observed in worldwide loca-tions, J. Atmos. Sci., 59, 590–608, 2002.
Eck, T. F., Holben, B. N., Reid, J. S., Sinyuk, A., Dubovik, O., Smi-mov, A., Giles, D., O’Neill, N. T., Tsay S.-C., Ji, Q., Al Mandoos, A., Ramzan Khan, M., Reid, E. A., Schafer, J. S., Sorokine, M., Newcomb, W., and Slutsker, I.: Spatial and temporal variability of column-integrated aerosol optical properties in the southern Arabian Gulf and United Arab Emirates in summer, J. Geophys. Res., 113, D01204, doi:10.1029/2007JD008944, 2008.
Formenti, P., Sch¨utz, L., Balkanski, Y., Desboeufs, K., Ebert, M., Kandler, K., Petzold, A., Scheuvens, D., Weinbruch, S., and Zhang, D.: Recent progress in understanding physical and chem-ical properties of African and Asian mineral dust, Atmos. Chem. Phys., 11, 8231–8256, doi:10.5194/acp-11-8231-2011, 2011. Hess, M., Koepke, P., and Schult, I.: Optical Properties of Aerosols
and Clouds: The software package OPAC, B. Am. Meteor. Soc., 79, 831–844, 1998.
Highwood, E., Haywood, J. M., Silverstone, M. D., Newman, S. M., and Taylor, J. P.: Radiative properties and direct effect of Saharan dust measured by the C-130 aircraft during Saharan Dust Experiment (SHADE), 2. Terrestrial spectrum, J. Geophys. Res., 108, 8578, doi:10.1029/2002JD002552, 2003.
Huang, J., Zhang, C., and Prospero, J. M.: African dust outbreaks: A satellite perspective of temporal and spatial variability over the tropical Atlantic Ocean, J. Geophys. Res., 115, D05202, doi:10.1029/2009JD012516, 2010.
IPCC: Climate Change – The Physical Science Basis, Contribu-tion of Working Group I to the Fourth Assessment Report of the IPCC, ISBN 978 0521 88009-1 Hardback; 978 0521 70596-7 Pa-perback, 2007.
Kalashnikova, O. V. and Kahn, R. A.: Mineral dust plume evolution over the Atlantic from MISR and MODIS aerosol retrievals, J. Geophys. Res., 113, D24204, doi:10.1029/2008JD010083, 2008. Karyampudi, V., Palm, S., Reagen, J., Fang, H., Grant, W., Hoff, R., Moulin, C., Pierce, H., Torres, O., Browell, E., and Melfi, S.: Validation of the Saharan dust plume conceptual model using Lidar, Meteosat, and ECMWF Data, B. Am. Meteorol. Soc., 80, 1045–1075, 1999.
Kaskaoutis, D. G., Kalapureddy, M. C. R., Krishna Moorthy, K., Devara, P. C. S., Nastos, P. T., Kosmopoulos, P. G., and Kambezidis, H. D.: Heterogeneity in pre-monsoon aerosol types over the Arabian Sea deduced from ship-borne measure-ments of spectral AODs, Atmos. Chem. Phys., 10, 4893–4908, doi:10.5194/acp-10-4893-2010, 2010.
Kaufman, Y., Koren, I., Remer, L., Tanr´e, D., Ginoux, P., and Fan, S.: Dust transport and deposition observed from the