HAL Id: hal-00316835
https://hal.archives-ouvertes.fr/hal-00316835
Submitted on 1 Jan 2000
HAL is a multi-disciplinary open access
archive for the deposit and dissemination of sci-entific research documents, whether they are pub-lished or not. The documents may come from teaching and research institutions in France or abroad, or from public or private research centers.
L’archive ouverte pluridisciplinaire HAL, est destinée au dépôt et à la diffusion de documents scientifiques de niveau recherche, publiés ou non, émanant des établissements d’enseignement et de recherche français ou étrangers, des laboratoires publics ou privés.
Lunar tidal winds in the upper atmosphere over Collm
R. J. Stening, C. Jacobi
To cite this version:
R. J. Stening, C. Jacobi. Lunar tidal winds in the upper atmosphere over Collm. Annales Geophysicae, European Geosciences Union, 2000, 18 (12), pp.1645-1650. �hal-00316835�
Lunar tidal winds in the upper atmosphere over Collm
R. J. Stening1, C. Jacobi2
1School of Physics, University of New South Wales, UNSW SYDNEY NSW 2052, Australia 2Institute for Meteorology, University of Leipzig, Stephanstr. 3, 04103 Leipzig, Germany Received: 10 April 2000 / Revised: 5 October 2000 / Accepted: 11 October 2000
Abstract. The lunar semidiurnal tide in winds measured at around 90 km altitude has been isolated with ampli-tudes observed up to 4 m s)1. There is a marked
amplitude maximum in October and also a considerable phase variation with season. The average variation of phase with height indicated a vertical wavelength of more than 80 km but this, and other results, needs to be viewed in the light of the considerable averaging required to obtain statistical signi®cance. Large year-to-year variations in both amplitude and phase were also found. Some phase comparisons with the GSWM model gave reasonable agreement but the model ampli-tudes above a height of 100 km were much larger than those measured. An attempt to make a comparison with the lunar geomagnetic tide did not yield a statistically signi®cant result.
Key words: Meteorology and atmospheric dynamics (middle atmosphere dynamics; waves and tides)
Introduction
The lunar atmospheric tide is generated in the lower atmosphere primarily as a result of the moon's gravi-tational attraction on the atmosphere and of the vertical motion of the oceans at the lower boundary of the atmosphere. The theory of the lunar tide in the atmosphere and descriptions of early measurements of it are given in Chapman and Lindzen (1970).
Lunar eects in the upper atmosphere were ®rst seen in the daily geomagnetic variations as early as 1850 (Kreil, 1850). Even now, however, puzzles still remain concerning some aspects of the seasonal behaviour of these variations (Stening and Winch, 1979).
In order to understand the lunar geomagnetic vari-ations we needed to study the lunar tides in the winds which drive these variations by dynamo action in the ionosphere. The present work is part of an eort to analyse suitable wind data sets for the lunar tide. We believe that this is the ®rst time that winds measured by the D1 method have been analysed extensively in this way. Most of the data analysed hitherto have been gathered by the partial re¯ection drift method which gives data in the 80 to 100 km height region just below the dynamo region of the ionosphere (e.g. Stening et al., 1994).
Another focus has been to simulate the lunar tide in the upper atmosphere from ®rst principles. Vial and Forbes (1994) provided a much improved model which showed reasonable agreement with observations. This model was extended to greater heights using the Global Scale Wave Model (GSWM) of Hagan et al. (1995) (see Stening et al., 1997a). Results from the extended model gave fair agreement with analysed data at the near equatorial site of Christmas Island (Stening et al., 1997b). This same GSWMmodel is used for compar-isons in this work.
Description of the Collm wind measurements
Winds in the mesosphere/lower thermosphere region have been measured at Collm (52°N, 15°E) for many years using low frequency transmitters and the D1 method (KuÈrschner and Schminder, 1986; Schminder and KuÈrschner, 1988; Jacobi et al., 1997). The iono-spherically re¯ected sky waves of three commercial radio transmitters at 177, 225 and 270 kHz are recorded using the closely spaced receiver technique. A modi®ed form of the similar-fade method is used to automatically interpret the wind measurements (KuÈrschner, 1975; Schminder and KuÈrschner, 1994). The procedure is based on the estimation of time dierences between corresponding fading extrema for three measuring points forming a right angled triangle over the ground with small sides of 300 m in the north and east
Correspondence to: R. J. Stening e-mail: [email protected]
directions. The pairs of time dierences which allow the calculation of individual wind vectors are measured with a temporal resolution of 0.25 s.
Half-hourly zonal and meridional mean wind values are obtained after averaging over 30±60 data points. The standard deviation of a half-hourly mean is in the order of 20 m s)1, caused by the real wind variations and by
the resolution and number of the individual wind measurements. After including the results of the indi-vidual measurements on each of the three frequencies combined with a weighting function based on an estimate of the ``chaotic velocity'' (Sprenger and Sch-minder, 1969; Schminder and KuÈrschner, 1992), mean values are calculated referring to a re¯ection point at 52°N, 15°E. During the daytime the low frequency radio waves are mostly absorbed in the ionospheric D region so the observations are con®ned to nighttime. This results in a total of about 700 half-hourly mean values per month in summer and about 1200 in winter and in a coverage of 11±12 h per day in summer and about 20 h per day in winter.
The virtual re¯ection height is measured on 177 kHz using phase dierences between the ground wave and the re¯ected sky wave. The dierences are obtained in the modulation frequency range near 1.8 kHz (KuÈrsch-ner et al., 1987). The height resolution of each individual re¯ection height measurement is close to 1 km. Half-hourly means consist of 6000 individual values on average. The standard deviation of these mean re¯ection height values is in the order of 3 km below 95 km and 5 km near 100 km height.
A recent study has been made using these data by Rawer and Harnischmacher (1999). They examined the lunar tides in the daily mean winds and in the ampli-tudes and phases of the solar semidiurnal tides. Our analysis is dierent from this in that we seek the amplitude and phase of the lunar semidiurnal tide itself. Lunar analysis
In order to analyse these data for a lunar tidal periodicity, the method of Malin and Schlapp (1980) is used. The half-hourly data points are ®rst averaged in pairs to give hourly means. Each of the hourly mean values in the data set under consideration is then randomly assigned to one of ten subsets. The data in each of these ten subsets is then ®tted by least squares to a mean, a 12 h solar tide and a lunar semidiurnal tide, where each tidal component has sine and cosine terms enabling the calculation of the phase. The lunar tide varies as A sin (2s + /) where A is the amplitude, s is the lunar time and / is the phase. The lunar time s=t ) m where t is the local solar time and m is the lunar age (m=0 corresponds to new moon). In the analysis the lunar tide is derived by calculating the lunar age m of each data point and the phase of the tide is presented as the lunar hour of maximum smax. smaxis related to the
phase / (in degrees) by smax=3 ) //30. The relation of
these quantities, measured as angles, may be seen in Fig. 2L.2 of Chapman and Lindzen (1970). However t is
more usually measured in solar hours and s in lunar hours.
The accuracy (standard deviation) of the resulting amplitude and phase is determined from the variance of the results from the ten separate determinations from the ten subsets. This method employed is useful in that the presence of gaps in the data, as is the case here, is not a problem. The main drawback is that a somewhat large number of data points need to be included in each data set in order to get signi®cant results.
Some calculations were made when the solar 24 h tide was also included in the ®t, but unreasonably large amplitudes for this tide were sometimes produced and the phase of the solar semidiurnal tide did not always agree with earlier determinations (Jacobi et al., 1997). In these earlier analyses the tides were ®tted by a multiple regression analysis in which a polynomial dependence of amplitude on height is assumed and the eastward and northward winds are assumed to have the expected quadrature phase relationship usually found for high-latitude observations. We shall see that the phase of the eastward wind is indeed normally 90° or 3 h ahead of the northward phase but this is not always exactly so for the lunar tide. It should particularly be noted, in passing, that this phase dierence may not be 3 h for low latitude stations (Stening et al., 1997b).
We use data from the years 1985 to 1997 and we will examine the variations of the lunar tide with season, with year and with altitude.
Our results will be compared with simulations derived from the Global Scale Wave Model (GSWM) of Hagan et al. (1995). In this model we use zonal wave number 2 and the tide is assumed to be a small perturbation of a shallow, compressible, hydrostatic, perfect gas atmosphere. The momentum, mass continu-ity, ideal gas law and thermal energy equations are solved in their linearized form. Molecular and eddy diusion, Newtonian cooling and ion drag are included. A zonal mean atmosphere and the resulting zonal winds are taken from Hedin et al. (1991) as the background. The lunar tide is introduced both as a gravitational force on the lower atmosphere and as a movement of the lower ocean and land boundaries (Vial and Forbes, 1994). Further information on the model may be found in the cited references.
Seasonal variation
The average seasonal variation of the amplitude and phase of the tide is shown in Fig. 1. In this analysis data are taken from 1985 to 1997, 80 to 150 km and data from one month are analysed together. It should be emphasised here that all heights quoted are virtual heights. The true heights are not known but will be, on the average, about two to three kilometres lower than the virtual heights at the levels where the bulk of the re¯ections occur.
There is a clear maximum in the amplitude centred on October where over 3 m s)1is reached. A maximum
occurs near the September equinox also in the solar
semidiurnal tide at Collm (Schminder et al., 1989). This is the time when the zonal circulation reverses direction at lower levels in the atmosphere and semidiurnal tides, both solar and lunar, are able to propagate upwards more easily. Between June and December the phase reverses in a similar way to the lunar tide at Saskatoon (Stening et al., 1987).
To reduce the size of the error bars data from a wide range of heights were included in the analysis shown in Fig. 1. However very similar variations, showing all the main features of Fig. 1, were obtained when data from only the 90 to 100 km height interval were included. It can thus be said that these particular results apply most closely to the 90±100 km height range.
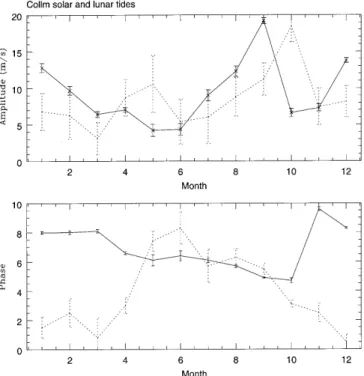
In the same analysis the phase and amplitude variations of the solar semidiurnal tide were also obtained and the results plotted alongside those of the lunar tide in Fig. 2. The amplitude of the lunar tide has been multiplied by 5 to highlight the dierences. It is clear that the autumn maximum in amplitude is in September for the solar tide but in October for the lunar tide. Also the lunar tide does not show the increased winter amplitudes seen in the solar tide. The northward winds (not plotted) behave in a very similar fashion.
Height variation
It is hard to gather enough data in a particular set to extract a meaningful height variation of the lunar tide. When variations with season and with year are also
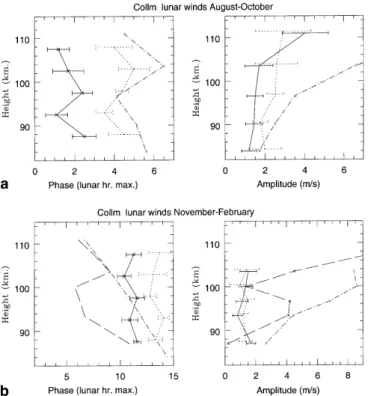
occurring, this presents a dicult problem. In the samples shown in Fig. 3 we have tried to use data from seasons and particular years when the variability is smaller. While the approximate 3 h phase dierence between northward and eastward winds is usually preserved, the phase progressions with height are generally small, indicating, on the average, rather long vertical wavelengths of 80 km or more.
All 13 years of data were used together in the following calculations of height variations. To improve statistical signi®cance data from a group of three or four months were analysed together. Four groups of months were used but only two of the groups yielded an appreciable number of points with acceptable statistical signi®cance.
The phases and amplitudes of the eastward wind derived from the GSWMmodel are also included: these were derived by performing a simple average of the phases for the months included. For August±October (Fig. 3a) the phases agree with the model to within just over one hour. At the greater heights the model ampli-tudes are very much larger than those observed The model of Vial and Forbes (1994) (not shown) gives an eastward wind speed of 13.9 m s)1at 102 km, but this is
near the largest height of this model. The lack of monotonicity in the model curve comes from the aver-aging: for August and September the model tide has a slow variation of phase with height while in October there is a change to a much more rapid variation. The ®gure shows what happens when these are put together. It is
Fig. 1. Amplitude and phase of the lunar tide in the winds. Data included in the analysis are from heights of 80 to 150 km and from 1985 to 1997 inclusive. Solid line is for the northward winds and dashed line for eastward. The error bars represent one standard deviation
Fig. 2. Comparison of the seasonal variation of the amplitude and phase of the solar semidiurnal and lunar semidiurnal tides in the eastward winds. Data included are from 80 to 150 km and 1985 to 1997. The solid line is the solar 12 h tide and the dashed line is the lunar tide. The amplitude of the lunar tide has been multiplied by 5. The phases correspond to the local (solar) time of maximum for the solar tide and the lunar hour of maximum for the lunar tide
suspected that similar eects may also occur when winds data from dierent months and years are included in the lunar analysis, but this is often necessary to obtain any statistically signi®cant result at all.
It is clear that the November±February phase data (Fig. 3b) do not agree well with the model. Although the model results agree with the GSWMphases to within 2 h below 100 km, the phase progression with height is quite dierent. (Note that both model plots are for the eastward wind.) In this regard the results given for Saskatoon for December should be recalled (Stening et al., 1987). There it was found that, in some years, the phases progressed slowly with height, similarly to our results here for Collm. However, in other years there was a much more rapid phase progression (shorter vertical wavelength) resembling the model.
Again the model amplitudes at greater heights are very much larger. The GSWMgives an eastward wind of 10.8 m s)1 at 103.5 km while the model of Vial and
Forbes (1994) gives 4.8 m s)1 at 102.6 km. Caution
needs to be exercised in making comparisons with models because the analysed data come from many years which may have dierent underlying atmospheric conditions prevailing in dierent years. Also the model values are plotted at real heights while the analysed values are at virtual heights which may be 2 to 3 km higher than the real heights.
Year-to year variations
In earlier work the year-to-year variations were exam-ined at Saskatoon and Adelaide to look for evidence of symmetry and antisymmetry in the lunar tide at various seasons (Stening et al., 1994). Using data from just a few months in one year necessarily reduces the accuracy of the determination of the tide but the accuracy seems to be just about sucient to show that there are quite large changes from year to year. The analyses in this section used data from a single year, a group of adjacent months and all heights from 80 to 110 km.
In Fig. 4 we ®rstly see, for the winter (November± February) period, that amplitudes at Collm may vary considerably from year to year with 1991 and 1994 standing out with large amplitudes. We also see large phase changes (dierences as large as 5 h) with the northward and eastward phases roughly tracking each other. Some experiments with the GSWMmodel showed quite large changes in phase and amplitude of the lunar tide were associated with stratwarms which occur during the northern winter. These changes were particularly noticeable at observing stations near 50°N latitude (Stening et al., 1997a). The phases for those measurements, in which the error bar of the amplitude extends below zero, are likely to be unreliable.
Large phase changes are also seen in summer (May± July) in Fig. 5. The summer data were selected to compare year-to-year changes in amplitude of the winds with changes in the lunar geomagnetic variations which
Fig. 3. a Height variation of the phase and amplitude of the lunar tide during August±October. Each point is derived from analysis of data from a 5 km height range and from 1985 to 1997 and from the months of August, September and October. The short dashed line is the phase of the eastward wind, solid line the northward wind and the dot-dashed line gives results for the eastward wind from the GSWM model. b As for a but for the months November to February inclusive. The long dashed line is the phase of the eastward wind from the model of Forbes and Gillette (1982)
Fig. 4. Variation with year of the amplitude and phase of the lunar tide in winter. Data included in each analysis are for one year, heights from 85 to 110 km and months from January, February, November and December of that calendar year. The amplitude is in m s)1. The solid line is the northward wind and the short dashed line the eastward wind. The long dashed line in the upper panel is the yearly mean sunspot number divided by 30
are driven by these winds at somewhat higher altitudes. The geomagnetic variations were taken from the obser-vatory at Chambon-la ForeÃt (48°N, 2.5°E) and the declination (D) component was used so that changes in the latitude of the focus of the current system do not intrude. While there was a remarkably low amplitude of both lunar DD and the winds in 1986, the error bars were too large to allow any conclusions.
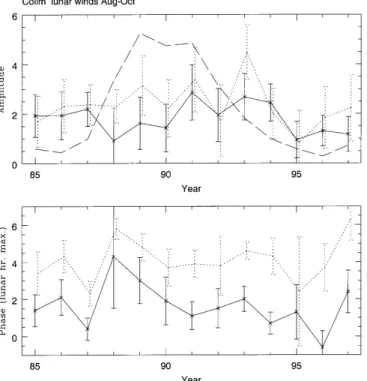
The August±October phases (Fig. 6) exhibit a large phase change from 1987 to 1988. Interestingly the Saskatoon lunar tides show a phase change for the same two years but it is more prominent in the November± February data than August±October (Fig. 7). Even the values of the Collm August±October phases are more similar to the Saskatoon November±February phases than to the Saskatoon August±October phases. It may be that the responsible phenomenon moves in longitude from month to month.
In Figs. 4, 5 and 6 we have also plotted the sunspot numbers on the amplitude graphs. There may be a slight increase in amplitude at higher sunspot numbers in May±July but not in the other seasons. Even in May± July the error bars are rather too large to be de®nite. Clearly the lunar forcing will not vary with the solar cycle but there may be some change in the in¯uence of the background atmosphere on the propagation of the lunar tide into the mesosphere/lower thermosphere. Conclusions
1. The lunar tide has been successfully isolated from the winds data recorded at Collm over 13 years. 2. There are signi®cant changes in the amplitude and
phase of the lunar tide from year to year. While some
of these were similar to those at Saskatoon, others were dierent, indicating possible longitudinal dif-ferences in the tide.
3. The uncertainties in the results are too large to eect a satisfactory comparison with lunar geomagnetic variations.
4. Although there are some aspects of agreement with theoretical simulations of the tide, the models predict much larger amplitudes of the lunar tide above 100 km altitude. This may possibly indicate a need for improvement in these models at those heights.
Acknowledgements. We thank Dr. D. KuÈrschner, Collm, for maintaining the wind measurements and for much helpful advice and discussion. Results from the GSWMwere obtained with the help of M.E. Hagan and J.M. Forbes. The analysis program was originally developed by D.M. Schlapp.
Fig. 5. As for Fig. 4, but for May±July Fig. 6. As for Fig. 4, but for August±October
Fig. 7a, b. Variation with year of the phase of the lunar tide at Saskatoon. a for January, February, November, December, and b for August to October. The data are from the 90 km region. The solid line is the northward wind and the dashed line the eastward wind
Topical Editor Doral Murtagh thanks A. D. Richmond and another referee for their help in evaluating this paper.
References
Chapman, S., and R. S. Lindzen, Atmospheric Tides, D. Reidel, Dordrecht, 1970.
Forbes, J. M., and D. F. Gillette, A compendium of theoretical atmospheric tidal structures, 1, model description and explicit structures due to realistic thermal and gravitational excitation, Rep. AFGL-TR-82-0173(1), Air Force Geophysical Laboratory Hanscom Air Force Base, Mass., USA, 1982.
Hagan, M. E., J. M. Forbes, and F. Vial, On modeling migrating solar tides, Geophys Res. Lett., 22, 893±896, 1995.
Hedin, A. E. et al., Revised global model of thermosphere winds using satellite and ground-based observations, J. Geophys. Res., 96, 7657±7688, 1991.
Jacobi, C. R., R. Schminder, and D. KuÈrschner, Measurements of mesopause region winds over Central Europe from 1983 through 1995 at Collm, Germany, Contrib. Atmos. Phys., 70, 189±200, 1997.
Kreil, K., Ein¯uss des Mondes auf die magnetisch Deklination, Denkschr. Akad. Wiss. Wien, Math.-naturw. Kl., 3, 1±47, 1850. KuÈrschner, D., Konzeption und Realisierung eines vollautomati-cischen Registriersystems zur DurchfuÈrung von nach der D1-Methode angelegten Routinebeobachtungen ionosphaÈrischer Driftparameter am Observatorium Collm, Z. Meteorol., 25, 218±221, 1975.
KuÈrschner, D., and R. Schminder, High atmosphere wind pro®les for altitudes between 90 and 110 km obtained from D1 LF measurements over Central Europe in 1983/1984, J. Atmos. Terr. Phys., 48, 447±453, 1986.
KuÈrschner, D., R. Schminder, W. Singer, and J. Bremer, Ein neues Verfahren zur Realisierung absoluter Re¯exionshoÈhenmesseng-ungen an Raumwellen amplitudenmodulierter Rundfunksender bei SchraÈgeinfall im Langwellenbereich als Hilfsmittel zur Ableitung von Windpro®len in der oberen Mesopausenregion, Z. Meteorol., 37, 322±332, 1987.
Malin, S. R. C., and D. M. Schlapp, Geomagnetic lunar analysis by least squares, Geophys. J.R. Astron. Soc., 60, 409±418, 1980.
Rawer, K., and E. Harnischmacher, Lunar in¯uence upon iono-spheric drifts near the mesopause, C.R.Acad. Sci. Paris, Sciences de la terre et des planeÁtes, 329, 233±237, 1999. Schminder, R., and D. KuÈrschner, Mean winds and tides in the 85 to
110 km region over Central Europe in 1983±1986, J. Geophys. Res., 93, 2493±2497, 1988.
Schminder, R., and D. KuÈrschner, HoÈhen-Zeit-Schnitte der Windf-elder (Grund- und Gezeitenwind) zwischen 85 und 105 km HoÈhe uÈber Mitteleuropa fuÈr 1990 aus funktechnischen D1-Windmessungen am Observatorium Collm. Kleinheubacher Ber., 35, 137±145, 1992.
Schminder, R., and D. KuÈrschner, Permanent monitoring of the upper mesosphere and lower thermosphere wind ®elds (prevail-ing and semidiurnal tidal components) obtained from LF D1 measurements in 1991 at the Collm Geophysical Observatory, J. Atmos. Terr. Phys., 56, 1263±1269, 1994.
Schminder, R., D. KuÈrschner, A. H. Manson, and C. E. Meek, Semidiurnal winds at Collm (52°N, 15°E) and Saskatoon (52°N, 107°W) over the decade 1978±1988, J. Atmos. Terr. Phys., 51, 623±626, 1989.
Sprenger, K., and R. Schminder, On some relationships between the correlation analysis and similar-fade analysis results of drift measurements in the lower ionosphere, J. Atmos. Terr. Phys., 31, 1085±1098, 1969.
Stening, R. J., and D. E. Winch, Seasonal changes in the global lunar geomagnetic variation, J. Atmos. Terr. Phys., 41, 311±324, 1979.
Stening, R. J., C. E. Meek, and A. H. Manson, Lunar tidal winds in the upper atmosphere (78±105 km) at Saskatoon, Canada, J. Atmos. Sci., 44, 1143±1151, 1987.
Stening, R. J., A. H. Manson, C. E. Meek, and R. A. Vincent, Lunar tidal winds at Adelaide and Saskatoon at 80 to 100 km heights, 1985±1990, J. Geophys. Res., 99, 13 273±13 280, 1994. Stening, R. J., J. M. Forbes, M. E. Hagan, and A. D. Richmond,
Experiments with a lunar tidal model, J. Geophys. Res., 102, 13 465±13 471, 1997a.
Stening, R. J., D. M. Schlapp, and R. A. Vincent, Lunar tides in the mesosphere over Christmas Island (2°N, 203°E), J. Geophys. Res., 102, 26 239±26 245, 1997b.
Vial, F., and J. M. Forbes, Monthly simulations of the lunar semi-diurnal tide, J. Atmos. Terr. Phys., 56, 1591±1607, 1994.