HAL Id: tel-01973521
https://tel.archives-ouvertes.fr/tel-01973521
Submitted on 8 Jan 2019
HAL is a multi-disciplinary open access
archive for the deposit and dissemination of sci-entific research documents, whether they are pub-lished or not. The documents may come from teaching and research institutions in France or abroad, or from public or private research centers.
L’archive ouverte pluridisciplinaire HAL, est destinée au dépôt et à la diffusion de documents scientifiques de niveau recherche, publiés ou non, émanant des établissements d’enseignement et de recherche français ou étrangers, des laboratoires publics ou privés.
Impacts of climate change and agricultural
managements on major global cereal crops
Xuhui Wang
To cite this version:
Xuhui Wang. Impacts of climate change and agricultural managements on major global cereal crops. Meteorology. Université Pierre et Marie Curie - Paris VI, 2017. English. �NNT : 2017PA066625�. �tel-01973521�
THESE DE DOCTORAT
DE
SORBONNE UNIVERSITÉ
(UNIVERSITÉ PIERRE ET MARIE CURIE)
ÉCOLE DOCTORALE N°129
Sciences de l'environnement d'Ile-de-France
Spécialité de doctorat : Météorologie, océanographie, physique de l'environnement Par
M. Xuhui WANG
Impacts of climate change and agricultural managements on major
global cereal crops
Titre: Impacts du changement climatique et des pratiques agricoles sur la culture des
principales céréales du monde
Mots clés: changement climatique, irrigation, phénologie, rendement, Chine Résumé:
Les terres cultivées représentent un cinquième de la surface émergée de la Terre. Elles fournissent des nutriments à l'homme, modifient le cycle biogéochimique et l'équilibre énergétique de la terre. L’évolution des terres cultivées dans le contexte du changement climatique et avec une intensification des actions anthropiques constitue un enjeu important pour la sécurité alimentaire et les exigences environnementales du développement durable. Le manuscrit de thèse s’inscrit dans cette thématique en exploitant les données de
différentes sources et la modélisation numérique. Les données utilisées sont : les statistiques de rendements, les observations agro-météorologiques à long terme, les résultats des sites d’expérimentation avec du réchauffement, les jeux de données globales issus des processus de fusion ou d’assimilation, les données climatiques historiques et de projection future. La modélisation fait appel aux modèles statistiques et aux modèles de processus. Le manuscrit est composé d’une série de travaux de détection et d'attribution. Ils explorent la phénologie, le rendement et leurs réponses aux changements climatiques et aux pratiques de gestion. Ils sont soit sur l'échelle régionale soit sur l’échelle globale, en fonction de la disponibilité des données et de leur pertinence.
Le chapitre 2 décrit la construction et l’utilisation d'un modèle statistique avec des données provinciales de rendement au Nord-est de Chine et des données climatiques historiques. Les résultats montrent un effet asymétrique de la température diurne sur le rendement du maïs. Le rendement du maïs augmente de 10.0±7.7% en réponse à une augmentation moyenne de 1oC pendant la saison de croissance quand il s’agit de la température minimale de nuit (Tmin), mais le rendement diminue de 13,4±7,1% quand il s’agit de la température maximale de jour (Tmax). Il y a une grande disparité spatiale pour la réponse à Tmax, ce qui peut s'expliquer partiellement par le fort gradient spatial de la température pendant la saison de croissance (R = -0,67, P <0,01). La réponse du rendement aux précipitations dépend aussi des conditions d'humidité. Malgré la détection d'impacts significatifs du changement climatique sur le rendement, une part importante de ses
variations n’est pas expliquée par les variables climatiques, ce qui souligne le besoin urgent de pouvoir attribuer proprement les variations de rendement au changement climatique et aux pratiques de gestion.
Le chapitre 3 présente le développement d’un algorithme d'optimisation basé sur la théorie de Bayes pour optimiser les paramètres importants contrôlant la phénologie dans le modèle ORCHIDEE-crop. L’utilisation du modèle optimisé permet de distinguer les effets de la gestion de ceux du changement climatique sur la période de croissance du riz (LGP). Les résultats du modèle optimisé ORCHIDEE-crop suggèrent que le changement climatique
affecte la LGP différemment en fonction des types du riz. Le facteur climatique a fait raccourcir la LGP du riz précoce (-2,0±5,0 jour / décennie), allonger la LGP du riz tardif (1,1±5,4 jour / décennie). Il a peu d'effet sur la LGP du riz unique (-0,4±5,4 jour / décennie). Les résultats du modèle ORCHIDEE-crop montrent aussi que les changements intervenus dans la date de transplantation ont provoqué un changement généralisé de la LGP, mais seulement pour les sites de riz précoce. Ceci compense à la hauteur de 65% le
raccourcissement de la LGP provoquée par le changement climatique. Le facteur dominant du changement LGP varie suivant les trois types de riz. La gestion est le principal facteur pour les riz précoce et unique. Ce chapitre démontre aussi qu'un modèle optimisé peut avoir une excellente capacité à représenter des variations régionales complexes de LGP. Les études futures devraient mieux cerner les défauts d'observation et documenter les différentes pratiques de gestion afin de réduire les incertitudes qui existent encore dans l'attribution de causes pour le changement de LGP. Elles devraient aussi faciliter l'intégration de la
modélisation et de l’observation.
Le chapitre 4 présente des résultats issus d’une exploration conjointe avec les données de sites, d’un côté, et la modélisation globale, de l’autre côté. L’observation est un ensemble de données avec du réchauffement contrôlé, coordonné sur 48 sites du monde pour les quatre cultures les plus répandues (blé, maïs, riz et soja). La modélisation est assise sur un ensemble de modèles de cultures sur des mailles régulières couvrant le globe. Le but est d'estimer les réponses du rendement de ces céréales au changement de température (ST), l’estimation étant contrainte par les données d’expérimentation. Le nouveau cadre avec contraintes intègre des données de sites d’observation avec un réchauffement contrôlé et la modélisation globale des cultures. Les résultats montrent, avec une probabilité > 95%, que des températures plus chaudes réduisent les rendements du maïs (-7,1 ± 2,8% K-1), du riz (-5,6 ± 2,0% K-1) et du soja (-10,6 ± 5,8% K-1). Pour les blés, ST étant moins négatif, il y a seulement 89% de probabilité pour que son rendement soit négatif (-2,9 ± 2,3% K-1). Les contraintes apportées par les observations de terrain avec du réchauffement contrôlé
permettent de réduire les incertitudes associées au réchauffement global. La réduction est de 12 à 54% pour les quatre cultures. Une principale implication de ces résultats s’applique aux évaluations des conséquences climatiques dans le cadre de l'Accord de Paris qui préconise des efforts nécessaires pour que le réchauffement global soit limité à 2 K
au-dessus du niveau de l’époque préindustrielle. Dans ce cas, les rendements des principales cultures connaissent une réduction de 3% à 13%, sans tenir compte des effets de CO2. Même si le réchauffement est limité à 1,5 K, aucun des principaux pays de ces cultures ne bénéficierait des températures plus chaudes sans une adaptation efficace. Le maïs, le riz et le soja seraient plus vulnérables à l'augmentation des températures que le blé.
Le chapitre 5 présente une estimation cohérente (une sorte de ré-analyse) sur la contribution de l'irrigation au rendement mondial du blé et du maïs, tout en poursuivant le même cadre bayésien intégrant les mesures de terrain et la modélisation des cultures. La ré-analyse ainsi obtenue a plus de précision que toutes autres estimations simples lorsque le résultat est confronté aux statistiques nationales des Etats-Unis. A l'échelle mondiale,
l'irrigation contribue respectivement à 34%±25% et 22%±23% au rendement irrigué pour le blé et le maïs. Les grandes variations spatiales de la contribution de l’irrigation au
rendement sont davantage attribuables à l'approvisionnement climatique en eau qu'à la demande. En accord avec les ressources de ruissellement disponibles, la priorité de
construire des installations d'irrigation se déplace vers l'Europe de l'Est et l'Inde pour le blé et vers le Brésil pour le maïs. Si l'on transforme les terres cultivées pluviales en terres irriguées, 30 à 47% des terres pluviales actuelles ne disposent pas de ressources locales suffisantes à la demande d'irrigation, y compris certaines régions importantes (par exemple le Nord de la Chine et le Centre-Ouest des États-Unis) qui devraient développer des projets d’extraction d'eau souterraine ou des projets de transfert d’eau inter-bassin. En considérant qu’il y a d’importantes surestimations de la contribution de l'irrigation au rendement des cultures dans la plupart des modèles antérieurs, on doit ici préconiser que les analyses, fondées sur ces résultats surestimés, concernant l'économie agricole et de l'hydrologie devrait être réexaminée.
Enfin, pour clôturer le manuscrit, une discussion est présentée autour de l'implication des résultats des chapitres précédents sur le développement continu du modèle
ORCHIDEE-crop et son application potentielle pour la modélisation couplée terre-atmosphère.
Title: Impacts of climate change and agricultural managements on major global cereal
crops
Key words: climate change, irrigation, phenology, yield, China Abstract:
Croplands accounts for one-fifth of global land surface, providing calories for human beings and altering the global biogeochemical cycle and land surface energy balance. The response of croplands to climate change and intensifying human managements is of critical importance to food security and sustainability of the environment. The present manuscript of thesis utilizes various types of data sources (yield statistics, long-term
agrometeorological observations, field warming experiments, data-driven global datasets, gridded historical climate dataset and projected climate change) and also modelling approaches (statistical model vs. process model). It presents a series of detection and attribution studies exploring how crop phenology and crop yield respond to climate change and some management practices at regional and global scales, according to data availability.
In Chapter 2, a statistical model is constructed with prefecture-level yield statistics and historical climate observations over Northeast China. There are asymmetrical impacts of daytime and nighttime temperatures on maize yield. Maize yield increased by 10.0±7.7% in response to a 1 oC increase of daily minimum temperature (Tmin) averaged in the
growing season, but decreased by 13.4±7.1% in response to a 1 oC warming of daily maximum temperature (Tmax). There is a large spatial variation in the yield response to
Tmax, which can be partly explained by the spatial gradient of growing season mean
temperature (R=-0.67, P<0.01). The response of yield to precipitation is also dependent on moisture conditions. In spite of detection of significant impacts of climate change on yield variations, a large portion of the variations is not explained by climatic variables,
highlighting the urgent research need to clearly attribute crop yield variations to change in climate and management practices.
Chapter 3 presents the development of a Bayes-based optimization algorithm that is used to optimize key parameters controlling phenological development in ORCHIDEE-crop model for discriminating effects of managements from those of climate change on rice growth duration (LGP). The results from the optimized ORCHIDEE-crop model suggest that climate change has an effect on LGP trends, but with dependency on rice types. Climate trends have shortened LGP of early rice (-2.0±5.0 day/decade), lengthened LGP of late rice (1.1±5.4 day/decade) and have little impacts on LGP of single rice (-0.4±5.4 day/decade). ORCHIDEE-crop simulations further show that change in transplanting date caused
widespread LGP change only for early rice sites, offsetting 65% of climate-change-induced LGP shortening. The primary drivers of LGP change are thus different among the three types of rice. Management is predominant driver of LGP change for early and single rice. This chapter demonstrated the capability of the optimized crop model to represent complex
regional variations of LGP. Future studies should better document observational errors and management practices in order to reduce large uncertainties that exist in attribution of LGP change and to facilitate further data-model integration.
In Chapter 4, a harmonized data set of field warming experiments at 48 sites across the globe for the four most-widely-grown crops (wheat, maize, rice and soybean) is
combined with an ensemble of gridded global crop models to produce emergent constrained estimates of the responses of crop yield to changes in temperature (ST). The new
constraining framework integrates evidences from field warming experiments and global crop modeling shows with >95% probability that warmer temperatures would reduce yields for maize (-7.1±2.8% K-1), rice (-5.6±2.0% K-1) and soybean (-10.6±5.8% K-1). For wheat, ST was less negative and only 89% likely to be negative (-2.9±2.3% K-1). The
field-observation based constraints from the results of the warming experiments reduced uncertainties associated with modeled ST by 12-54% for the four crops. The key implication for impact assessments after the Paris Agreement is that with global warming limited within 2 K above pre-industrial levels will still reduce yields of major crops by 3% to 13%,
without considering effects of atmospheric CO2 concentrations. Even if warming was limited to 1.5 K, none of the major producing countries of these crops would likely benefit from the warmer temperatures without effective adaptation. Maize, rice and soybean would be more vulnerable to increasing temperatures than wheat.
In addition to model-data integration for assessing climate change impacts, Chapter 5 reanalyzed irrigation contribution to global wheat and maize yield with the Bayesian framework integrating estimates from both field measurements and crop modelling. The reanalysis has more precision than any single estimate when confronted with US statistics. At global scale, irrigation contributes to 34%±25% and 22%±23% of irrigated yield for wheat and maize respectively. The large spatial variations in irrigation contribution to crop yield are driven more by climatic water supply than by climatic water demand. When matching with available runoff resources, the priority of building irrigation facilities shift to eastern Europe and India for wheat and to Brazil for maize. If shifting global rainfed
croplands into irrigated ones, 30% - 47% of current rainfed croplands do not have sufficient local runoff resources to meet irrigation demand, including some hotspots (e.g. northern China and mid-western US), which will have to rely on groundwater or trans-basin water transfer program. The large overestimates in crop-model-simulated irrigation contribution to crop yield suggest that previous model-based analyses of agricultural economy and
hydrology will have to be revisited.
Finally, a discussion is given around the implication of findings in previous chapters on the ongoing development of ORCHIDEE-crop and its potential application for the land-atmospheric coupled modelling.
Acknowledgements
When reviewing my thesis, I am truly grateful to many, who have significantly helped my studies and making my researches different. First, I am grateful to my advisors, Dr. Shilong Piao and Dr. Laurent Li. I have worked with Dr. Piao since my undergraduate years. The training and working experience I got from him has transferred me from an ecology student interest in science and information technology to a researcher trying to explore the cutting edge of global change studies. It is a truly great honor for me to learn from the best and to work closely with him. The guidance and training I had from him shapes my views of sciences and researches. I am deeply indebted to him. Since the first day I came to Paris, Dr. Li has been my ultimate solution for all problems I encountered. He gave me the freedom to explore and discover the question of my interest, sponsored me to participate academic conference, encouraged me and shared with me new ideas and thoughts from worldwide colleagues. The training I had for the LMDZOR model will become a powerful tool for my continuing researches. He also made my life, an English/Chinese speaker in France, possible and easier. I am also deeply indebted. Without him, I would not be able to make it.
I am also grateful to Dr. Philippe Ciais, who has provide inspiring suggestions for almost every manuscript I made, supporting me financially for researches and conference participations, and providing the opportunity to continue my researches with ORCHIDEE. Working with Dr. Ciais is also an eye-opening experience, for his broad and deep understanding on every topic I am interested in. The guidance from him has made my work detoured less and my publishing experience more enjoyable. Thanks very much for the continuous help.
The work presented in this thesis has also got help from younger students, including but not limited to Liqing Peng and Chuang Zhao, working with them is also quite a pleasure. Analyses using crop model ensembles will not be possible without the support from the colleagues in global gridded crop model intercomparison project (GGCMI), in particular Dr. Christoph Muller and Dr. Joshua Elliot. I thank them for the opportunities.
Senior colleagues in LMD, SOFIE and LSCE have made my years of PhD studies enjoyable. The list of names I should thank is very long, Shushi Peng, Tao Wang, Nicolas Viovy, Jinfeng Chang, Yue Li, Xiuchen Wu, Josefine Ghattas and Nicolas Vuichard. It is a pleasure working with them. My Chinese friends here in France has made my life more colorful. Discussions we had also help me move my researches. Thanks a lot to them, Yilong Wang, Wei Li, Chao Yue, Bo Zheng, Xin Lin, Dan Zhu, Yi Yin, Shan Li, Zun Yin…
Finally, I dedicated the thesis also to my wife, Huihui Dong, who has made my life different. Marrying her is the other big difference I made during my pursuing of the science. Thanks also to the supports from my families, and sorry for my absence in their lives because
I am either in Beijing or in Paris.
Table of contents
CHAPTER 1 INTRODUCTION ... 1
1.1THE IMPACT OF CLIMATE CHANGE ON CROPLANDS ... 2
Phenology and yield ... 2
Land surface energy and water exchange ... 6
1.2CROP MODELS, FROM SITES TO THE GLOBE ... 7
1.3OBJECTIVES AND STRUCTURE OF THIS THESIS ... 10
REFERENCES ... 11
CHAPTER 2 DETECTING CLIMATE CHANGE IMPACTS ON MAIZE YIELD IN NORTHEAST CHINA ... 18
SUMMARY ... 18
CHAPTER 3 ATTRIBUTING HISTORICAL TRENDS IN CHINA’S RICE GROWING SEASON BASED ON CALIBRATED ORCHIDEE-CROP MODEL ... 40
SUMMARY ... 40
CHAPTER 4 REANALYZING GLOBAL CROP YIELD RESPONSE TO WARMER TEMPERATURE USING MANIPULATION EXPERIMENTS AND GLOBAL CROP MODELS 88 SUMMARY ... 88
CHAPTER 5 GLOBAL IRRIGATION CONTRIBUTION TO WHEAT AND MAIZE YIELD 114 SUMMARY ... 114
Chapter 1 Introduction
Food security under changing climate is a critical global issue, with rising population projected to reach 9.6 billion ~2050s (UN, 2012). To feed such huge population, global food production has to increase by more than 70% (FAO, 2012). This estimates will have to be even larger (~110%), if considering potential change in diets (Tilman et al., 2011). The anthropogenic climate change (IPCC, 2013) has been an important factor limiting sustainable food supply and causing fluctuations of supply-demand balance global crop production (Godfray et al., 2010; Beddington et al., 2012; Lesk et al., 2016). Therefore, studying climate change impacts on crop ecosystems is vital for sustainability of the society. The human managements on croplands not only produces food, but also left its footprint on biophysics and biogeochemical cycle of the earth system. According to Ramankutty et al. (2008), croplands comprise 20% of global land surface, which accounts ~25% of greenhouse gas emission to the atmosphere (Foley et al., 2005; World Resource Institute, 2013; Tian et al., 2016). The global carbon cycle has also been modified by croplands. For example, studies have shown that, the “Green Revolution” over the past five decades has significantly change seasonal variations of atmospheric CO2 (Gray et al., 2014; Zeng et al., 2014). In addition, human management has profoundly affected the energy and water balance of the land surface. The annual water withdraw for irrigation accounts for ~70% of global water withdraw from the river runoff. Therefore, it is essential to explore the relationship between climate and croplands as the component of the earth system models.
As the Introduction of the thesis, we first overview knowledge on how climate change has influenced crop phenology, yield, energy balance and water cycle. Then we synthesize status of crop model developments. In the end, we present the objective and structure of the thesis.
1.1 The impact of climate change on croplands
Phenology and yield
The growth duration of a crop determine the time length of light interception and photosynthesis, therefore the crop yield and its water and energy balance. As sensitivity of crop to climate variations are not equally sensitive across the growing season (Porter & Semenov, 2005), which can be particularly sensitive to climate variations at certain reproductive phase (e.g. Hatfield et al., 2011; Espe et al., 2017), the timing of key phenological events are also of great importance. Thus, understanding how phenology respond to climate change is a prerequisite to understand how climate change affects crop ecosystems.
It has long been recognized that climate change has significant impacts on crop growth duration. Each 1°C of warmer temperature shorten growth duration by ~7 days by average (Muchow et al., 1990; IPCC, 2007). However, this average sensitivity cannot really represent the theories and observations. A widely-adopted theory of cardinal temperatures suggest that, crop growth accelerates with warmer temperature when it is below the optimum temperature for crop development (e.g. Hatfield et al., 2011), which shorten the growth duration. However, when temperature is above its optimum, the acceleration with higher temperature may disappear. This critical temperature threshold (the optimum temperature) may differ largely across crops and varieties ranging from 20°C to 35°C (Sanchez et al., 2014). It should be noted that how crop-climate relationship may change above the optimum temperature is largely uncertain and differ across crops (Craufurd & Wheeler, 2009). For example, some studies found rapid senescence of wheat after exposure to 32-34oC during flowering period (Asseng et al., 2011; Lobell et al., 2013). However, for rice, the limited number of researches indicate that growth duration is not responsive to temperature when it goes beyond the optimum (Yoshida, 1983). These observational evidences, however, have not been well accounted in many widely used crop models (Sanchez et al., 2014). For example, the CERES model used for assessing food security under climate change in China (e.g. Xiong et al., 2009; Xiong et al., 2010) only considers the acceleration effects of warming but not the high temperature stress (e.g. Lobell et al., 2013)。
For natural ecosystems, many studies have consistently shown that global warming over the past few decades has advanced the spring onset date (e.g. Menzel et al., 2006; Wang et al., 2015), lengthening the growing season (e.g. Garonna et al., 2014), though it may reverse over a few regions due to climate flucturations (e.g. Piao et al., 2011). However, unlike the consistency found for natural ecosystem, the trend in crop growth duration was quite diversified in different researched. For example, Siebert et al. (2012) found growth duration of oat over Germany is shortening by 0.1-0.4 day/10a over past five decades; Tao et al. (2006) found growth duration for rice over China have also shortened over past two decades. However, more recent researched over past two to three decades found growth duration for major cereal crops (rice, wheat and maize) over China has become longer (e.g. Liu et al., 2012; Liu et al., 2013; Tao et al., 2013; Xiao et al., 2013; Li et al., 2014). These results appear contradictory, but can be reconciled with adaptation measures by selecting long-duration varieties.
Crop yield can be affected by temperature change through different pathways. First, rising temperature directly drives change in photosynthetic rate (Figure 1.1). When temperature is below the optimum temperature, rising temperature will enhance photosynthetic rate, while it suppress photosynthetic rate when temperature goes beyond the optimum. Respiration processes also subject to temperature regulations. However, the optimum temperature for respiration is usually higher than that of photosynthesis and outside measurement range (Figure 1.1). It is therefore commonly believed that higher temperature will lead to higher respiration rate. The net effect of temperature on photosynthesis and respiration is the temperature effects on crop productivity. Night-time warming was believed to negatively affect crop yield as respiration increase while photosynthesis is still zero (Peng et al., 2004; Lobell et al., 2012a). However, due to potential compensation effects that enhance photosynthesis on the day (Wan et al., 2009), warmer nighttime temperature may also improve crop productivity. Second, certain phase of crop reproductive growth (e.g. silking and grain filling) is sensitivity to high/low temperature stress (e.g. Schar et al., 2004; Espe et al., 2017). For example, high temperature stress can lead to failure of flowering, grain formation and grain filling, leading to reduced crop yield (Schar et al., 2004; Porter & Semenov, 2005; Asseng et al., 2011; Teixeira et al.,
2013). Third, as mentioned in previous paragraph, temperature change will affect the length of growing duration, which affect the accumulation of photosynthesis and thus yield. Usually, higher temperature lead to shorter growing duration and lower yield (e.g. Iqbal et al., 2009; Giannakopoulos et al., 2009; Lobell et al., 2012b). Finally, increase in temperature lead to exponential increment of vapor pressure deficit, which may also stress the productivity of croplands (e.g. Lobell et al., 2013).
Figure 1.1 Schematic diagram for relationship between temperature and rates of
photosynthesis and respiration (Porter & Semenov, 2005)
The impact of precipitation change on crop yield remains more controversial. Some studies show that 20% decrease in precipitation will still have limited impacts on maize yield over USA (Lobell et al., 2013), while other studies found precipitation change as more dominant factor than change in temperature and atmospheric CO2 on crop yield (Ko et al., 2010). Probably due to expansion of irrigation, which may alleviate the water stress to crop production, the studies on impact of precipitation on crop yield is much less than that of temperature. However, climate change will lead to change in irrigation demands (Elliot et al., 2014) and spatio-temporal distribution of available water resources. Whether sufficient irrigation water can be provided is a urgent research question to answer. In addition, projected increase in exteme events, such as droughts and flood (IPCC, 2012), may also leads to fluctuations of global crop productions (Lesk et al., 2016).
Solar radiation reaching the land surface is the energy source of photosynthesis and thus crop productivity. Interannual variations of solar radiation has significant impacts on rice yield over China (Zhang et al., 2010). However, it is so commonly assumed that crop growth was more stressed by temperature and water availability (Hatfield et al., 2011), the impact of variations of solar radition on crop yield remains largely uncertain.
Despite growing knowledge on the mechanism how climate change could influence crop yield, our knowledge on the key parameters (e.g. cardinal temperature) and dominant climatic factors driving yield change remains unclear. Regional and inter-crop differences may further complex situation. Large uncertainties, therefore, still exist in quantifying climate change impacts on crop production (IPCC, 2013a). A synthesis of 66 studies on climate change impacts on crop yield (IPCC, 2013a) found that warming of 1-2 oC may lead to decline of wheat and maize yield. However, rice in tropical region and maize in temperate regions show different response to warming in different studies. As a result, even qualitative conclusions are difficult to make. Different global studies drew different conclusions on how rice yield respond to climate change. For example, Lobell et al. (2011) found climate change over past three decades may slightly enhance the yield, while recent multi-model intercomparison study (Rosenzweig et al., 2014) found climate change will reduce rice yield, without considering the CO2 fertilization effect. Therefore, detailed regional studies are warranted in order to reduce the uncertainties. However, regional studies based on statistics, long-term agro-meteorological site observations and crop models drew contrast conclusions on how climate change affects rice yield over China (Lin et al., 2005; Yao et al., 2007; Tao et al., 2008; Xiong et al., 2007; Xiong et al., 2009; Zhang et al., 2010; Welch et al., 2010; Tao et al., 2012), highlighting large uncertainties in the estimates. Single model studies are prevalent among previous ones (e.g. Lin et al., 2005; Xiong et al., 2007; Yao et al., 2007; Xiong et al., 2009; Tao and Zhang, 2012) , but the uncertainties related to model structures and parameters remains largely unexplored. Recent studies seems indicating the multi-model ensemble may improve confidence in projecting how crop yield may respond to the changing climate (Asseng et al., 2015; Martre et al., 2015; Li et al., 2015).
Land surface energy and water exchange
Irrigation accounts for ~70% of global water widraw (Shiklomanov & Rodda, 2003), which is also a key variable for projecting crop production and food security (IPCC, 2013a). The irrigation water requirements of croplands are determined by balance of precipitation and evapotranspiration, both of which are affected by climate change. Anthropogenic climate change is projected to alter the spatial distribution of annual precipitation (IPCC, 2013b), which will change the water availability over contemporary cropping area. The seasonal distribution of precipitation may also altered (IPCC, 2013b), which may induced seasonal shortage of water supply during growing season.
Climate change affect evapotranspiration through three pathways. First, it affects crop productivity, which consume water affect the rate of evapotranspiration; Second, it regulates length of growing season, which affects the annual sum of evapotranspiration; Finally, warmer temperature will directly change saturated water vapor pressure and stomatal conductance, the net effect of which may accelerate the crop evapotranspiration (e.g. Ben-Asher et al., 2008). One factor often dismissed in studies on crop evapotranspiration is the impact of solar radiation (Hatfield et al., 2011), which directly alter the energy balance of the land surface (Wild et al,. 2005). The commonly used empirical equation (Penmman-monteith) in crop models does not include effects of solar radiation, which may underestimate variations of evapotranspiration. Rising atmospheric CO2 will lead to decrease of stomatal conductance and thus reducing transpiration (Leaky et al., 2006). Across different FACE experiments, stomatal conductance by average reduce by 20% in response to enhanced CO2 at 550 ppm (Ainsworth et al., 2005). The reduction of stomatal conductance may further enhanced to 30%-40% under doubling CO2 concentration (Hatfield et al., 2011). However, at canopy level, the observed change of evapotranspiration under double CO2 is only 8%-13% (Hatfield et al., 2011), which can result from negative feedbacks result from higher CO2 induced higher leaf temperature and photosynthetic rate (Leaky et al., 2009; Burkart et al., 2011). Rising atmospheric CO2 and temperature drive change evapotranspiration in different direction, which is a hotspot for impact studies and remains largely uncertain (Liu & Tao, 2013). Complex interactions among climate change factors in affecting evapotranspiration may have not been fully understood and incorporated in the models. For example, rising CO2 may enhance vegetation growth, and thus surface
roughness, resulting in reduced wind speed (Vautard et al., 2010). The lower wind speed resulted from rising CO2 may thus reduce evapotranspiration.
Overall, experimental and model studies show that warmer temperature lead to increasing cropland evapotranspiration (e.g. Guo et al., 2010; Hoff et al., 2010; Gerten et al., 2011). Field observational studies in general agree that rising atmospheric CO2 will lead to decrease of cropland evapotranspiration (e.g. Reddy et al., 1995; Leaky et al., 2006; Bernacchi et al., 2007). Assuming no change of crop varieties, the global modelling study show the overall effect of climate change following RCP8.5 will be reducing global crop irrigation demand by 8%-15% (Elliot et al., 2014), but the sign and magnitude change across crops and regions. Uncertainties are still large, as hydrological models and crop models differ, by average two times, in the estimate of crop irrigation demand (Elliot et al., 2014).
1.2 Crop models, from sites to the globe
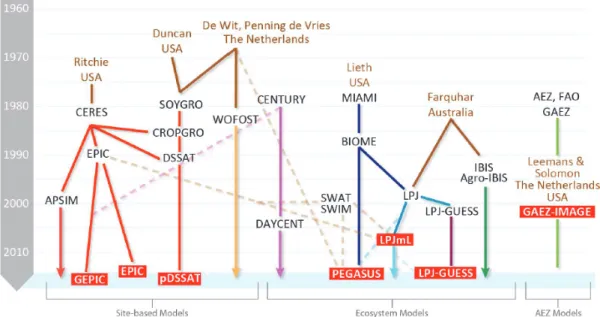
Crop models are the essential tool integrating our knowledge of climate change impacts on croplands. The field-scale crop model started from 1960s with two genres: The waegningen group led by de Wit (1965) developed crop growth model based on light use efficiency module. Crop models such as WOFOST and ORYZA(Bouman & Van Laar, 2006) are evolution of this type of models. The other genre is the CERES type of model (Ritchie et al., 1985) based on earlier work by Duncan (1967), including CROPGRO. DSSAT is the platform integrating both CERES and CROPGRO. APSIM is an Australian model also belongs to this genre. Despite the differences among these models, there are some resemblance on them, such as the use of radiation use efficiency (RUE) module or water use efficiency (WUE) module, the thermal accumulation module to drive crop phenology, the use of variants of Penman-Monteith equation for calculation of evapotranspiration. These traditional crop model have strong suits in detailed simulation of organ developments, given a large number of parameters. However, the equations used are often highly empirical. For example, the water and nutrient stress to crop phenology development, the ratio of actual to potential evapotranspiration are often empirical parameter between 0 and 1. Such formulation of equations will easily lead to over-parameterization and uniformality issues in representing physiological process. The photosynthesis in these models are semi-empirical
WUE or RUE model (Soussana et al., 2010), instead of the physiology based Farquhar(Farquhar & Sharkey, 1982). Under contemporary climate, these crop models may be parameterized to reflect the characteristics of the croplands, but its robustness to be extrapolated into future and project impacts of climate change could be dubious (Nowak et al., 2004; Soussana et al., 2010). For example, Wang et al. (2012) show WUE and RUE model may predict contrast response of productivity to climate change over China. There are a long list of this type of crop models developed by researches from different countries (e.g. STICS (Brisson et al., 2008), SIMRIW(Horie, 1987; Zhang et al., 2014), Agro-C (Huang et al., 2009), RiceGrow (Tang et al., 2009), McWLA(Tao and Zhang, 2012)), which have been developed and tuned for a certain crop-region. As a result , in recent model intercomparison of crop models for wheat, maize and rice, no models can out-perform others in four test sites at different regions of the globe (Li et al., 2015; Martre et al., 2015).
Figure 1.2 evolution of some crop models (Rosenzweig et al., 2014)
Researchers have realized the difficult in applying the site-scale model at regional and global scales (Challinor et al., 2009), at which climate change impacts and economy models have to operate. The other generation of crop models was thus developed to explore large scale crop-climate relationships, such as IMAGE (Leeman & Solomon, 1993). These model typically divide the globe into several agro-ecological zones. Empirical relationship between climate and yield was then built usually with agro-statistics. Some selective process may also be incorporated into these models for model improvements, such as
GLAM (Challinor et al., 2004). Compared with traditional crop models mentioned in previous paragraph, these models have far less input requirements and parameters and low requirement of computing resources, which facilitates large-scale applications. However, its empirical nature may hurdle further exploration on how management practices may affect the croplands’ response to climate change (Challinor et al., 2004). When climate change beyond its contemporary range of variations (Mora et al., 2013), it is hard to prove whether the contemporary empirical relationship may still apply. Similar issues also apply for different types of statistical models (e.g. Lobell et al., 2011).
Compared with previously mentioned models, terrestrial ecosystem models have more physiology-based formulations. However, previous studies often neglect or simplified representation of crop ecosystems (e.g.Piao et al., 2009). The simplified module cannot represent the generally short growth duration of crops (Smith et al., 2010) and different allocation strategy of croplands than natural ecosystems (Bondeau et al., 2007). All earth system models in CMIP5 did not include a specific crop module. As croplands role in global biogeochemical cycle being gradually brought more attentions, there are some efforts introducing crop modules into the ecosystem models (Drewniak et al., 2013). For example, Kucharik (2003) bring crop phenology, irrigation and fertilization module into IBIS model, resulting in better representation of spatio-temporal variations of maize yield over US due to climate and management differences (Kucharik, 2003; Kucharik, 2008). Levis et al. (2012) bring Agro-IBIS into community land model, finding improved representation of dynamics in leaf area index (LAI), net ecosystem exchange and thus seasonal variations of atmospheric CO2 concentration. Bondeau et al. (2007) introduce crop functional type to LPJ. The improved LPJmL model, though only introduce improvements of phenology at that time, simulated 24% less global vegetation carbon pool than original LPJ model and produce significant difference in spatio-temporal variations of net primary productivity. Similarly, ORCHIDEE has also tried to introduce STICS model for simulating crop phenology, finding the model become better representing interannual variations of LAI and net primary production. Overall, the introduction of crop module can improve ecosystem models in representing spatio-temporal variations of cropland ecosystems, making it an alternative choice to study regional and global croplands, how they may respond to climate change.
Despite the large differences in the complexity of introduced crop module, the agro-ecosystem models still have limitations in representing the crop growth dynamics, such as the morphology of crop organs, the grain quality, and the lack of nutrient cycling, particularly for micro-nutrients such as potassium. In addition, the process-based ecosystem models usually requires larger amount of computational resources following the same protocol of simulations. The consumption of computing resource by ORCHIDEE-crop is one magnitude larger than that required by pDSSAT and pAPSIM (Elliot & Wang, personal communication). It becomes a bottleneck for the application of agro-ecosystem models, though increasing computing power globally may gradually alleviate the pressure.
The Global Gridded Crop Model Inter-comparison (GGCMI) project brought different types of crop models together to perform simulations forced with consistent climate and management forcing (Elliot et al., 2015). This ongoing global effort will help us further understand the advantage and disadvantage of different crop models and reduce large uncertainties in estimating crop yield response to climate change at global and regional scale.
1.3 Objectives and structure of this thesis
The general goal of this PhD thesis is to describe the efforts using both statistical tools and processed based crop models to 1) detect climate change impacts on crop phenology and yield, identifying key climatic factors regulating crop yield variations and estimating the temperature sensitivity of crop yield, and 2) attribute the crop yield change to climate and management factors, at regional and global scale.
In Chapter 2, I built statistical models using yield statistics at prefecture scale during the past three decades over Northeast China, along with contemporary historical climate data, to explore the yield-climate relationship and its spatial variations. In addition, I explored how climate-yield relationship evolve along the climate gradient.
In Chapter 3, I developed a Bayes-based parameterization system to optimized parameters of ORCHIDEE-crop model to represent the spatio-temporal variations of rice
growing season duration during past three decades over China. The carlibrated ORCHIDEE-crop model is then driven by historical change in climate and management in order to attribute observed change in China’s rice phenology.
In Chapter 4, An emergent constraint framework was built to integrate global gridded crop models and field warming experiments in order to reanalyze and refine global crop yield response to warmer temperature. The implications for crop yield change under climate change goal of Paris Agreement and data and knowledge gap for reducing uncertainties are explored.
In Chapter 5, Using global gridded crop models and data-driven model for global rainfed and irrigated crop yield, I applied Bayesian model average to reanalyze potential contribution of irrigation to global crop yield. Based on the reanalysis, the supply-demand balance of irrigation water demand and surface runoff supply was also analyzed.
In Chapter 6, I summarized the findings of previous chapters. Implications of the studies on ongoing development of ORCHIDEE-crop model and the IPSL earth system model are explored and discussed.
References
Ainsworth EA, Rogers A, Nelson R, et al. (2004) Testing the “source–sink” hypothesis of down-regulation of photosynthesis in elevated CO2 in the field with single gene substitutions in Glycine max. Agricultural and Forest Meteorology, 122, 85-94.
Ainsworth EA & Long SP (2005) What have we learned from 15 years of free-air CO2 enrichment (FACE)? A meta-analytic review of the responses of photosynthesis, canopy properties and plant production to rising CO2. New Phytologist, 165, 351-372. Asseng S, Foster IAN & Turner NC. (2011) The impact of temperature variability on wheat
yields. Global Change Biology, 17, 997-1012.
Asseng S, Ewert F, Martre P et al. (2015) Rising temperatures reduce global wheat production. Nature Climate Change, 5, 143-147.
Ben-Asher J, Garcia AGY, Hoogenboom G. (2008) Effect of high temperature on photosynthesis and transpiration of sweet corn (Zea mays L. var. rugosa). Photosynthetica, 46 (4): 595-603.
Bernacchi CJ, Pimentel C & Long SP (2003) In vivo temperature response functions of parameters required to model RuBP-limited photosynthesis. Plant, Cell & Environment,
26, 1419-1430.
Bernacchi CJ, Kimball BA, Quarles DR, et al. (2007) Decreases in stomatal conductance of soybean under open-air elevation of CO2 are closely coupled with decreases in ecosystem evapotranspiration. Plant Physiology, 143, 134-144.
Bondeau A, Smith PC, Zaehle S, et al. (2007) Modelling the role of agriculture for the 20th century global terrestrial carbon balance. Global Change Biology, 13, 679-706.
Boote KJ, Jones JW & Hoogenboom G (1998) Simulation of crop growth: CROPGRO model.
Bouman BAM, van Laar HH (2006) Description and evaluation of the rice growth model ORYZA2000 under nitrogen-limited conditions. Agricultural Systems, 87, 249–273 (doi: 10.1016/j.agsy.2004.09.011)
Brisson N & Delecolle R (1991) Developpement et modeles de simulation de culture. Agronomie, 12, 253-263
Brisson N, Gary C, Justes E, et al. (2003) An overview of the crop model stics. European Journal of Agronomy, 18, 309-332.
Brisson N, Beaudoin N & Mary B (2008) Conceptual basis, formalisations and parameterization of the STICS crop model, Editions Quae.
Burkart S, Manderscheid R, Wittich KP, et al. (2011) Elevated CO2 effects on canopy and soil water flux parameters measured using a large chamber in crops grown with free-air CO2 enrichment. Plant Biology, 13, 258-269.
Challinor AJ, Wheeler TR, Craufurd PQ, et al. (2004) Design and optimisation of a large-area process-based model for annual crops. Agricultural and Forest Meteorology, 124, 99-120.
Challinor AJ & Wheeler TR (2008) Use of a crop model ensemble to quantify CO2 stimulation of water-stressed and well-watered crops. Agricultural and Forest Meteorology, 148, 1062-1077.
Craufurd PQ & Wheeler TR (2009) Climate change and the flowering time of annual crops. Journal of Experimental Botany, 60, 2529-2539.
De Wit CT (1965) Photo synthesis of leaf canopies. Agricultural Research Report, 663, 1-56.
Deryng D, Sacks WJ, Barford CC, et al. (2011) Simulating the effects of climate and agricultural management practices on global crop yield. Global Biogeochemical Cycles, 25(2).
Drewniak B, Song J, Prell J, et al. (2013) Modeling agriculture in the Community Land Model. Geoscientific. Model Development, 6, 495-515.
Duncan WG, Loomis RS, Williams WA, et al. (1967) A model for simulating photosynthesis in plant communities. Hilgardia, 38: 181-205.
Elliott J, Deryng D, Müller C, et al. (2014) Constraints and potentials of future irrigation water availability on agricultural production under climate change. Proceedings of the National Academy of Sciences, 111, 3239-3244.
Intercomparison: data and modeling protocols for Phase 1 (v1.0). Geoscientific Model Development, 8, 261-277.
Espe MB, Hill JE, Hijmans RJ et al. (2017) Point stresses during reproductive stage rather than warming seasonal temperature determine yield in temperate rice. Glob Chang
Biol, 23, 4386-4395.
FAO (2012) World Agriculture Towards 2030-2050, Agricultural Development Economics Division, Food and Agriculture Organization of the United Nations.
Farquhar GD & Sharkey TD (1982) Stomatal conductance and photosynthesis. Annual Review of Plant Physiology and Plant Molecular Biology, 33, 317-345.
Foley JA, DeFries R, Asner GP, et al. (2005) Global consequences of land use. Science, 309, 570-574.
Garonna I, de Jong R, de Wit AJ, et al. (2014) Strong contribution of autumn phenology to changes in satellite-derived growing season length estimates across Europe (1982-2011). Global Change Biology, 20, 3457-70.
Gerten D, Heinke J, Hoff H, et al. (2011) Global water availability and requirements for future food production. Journal of Hydrometeorology, 12, 885-899.
Giannakopoulos C, Le Sager P, Bindi M, et al. (2009) Climatic changes and associated impacts in the Mediterranean resulting from global warming. Global Planet Change, 68, 209–224.
Gray JM, Frolking S, Kort EA, et al. (2014) Direct human influence on atmospheric CO2 seasonality from increased cropland productivity. Nature, 515, 398-401.
Godfray HCJ, Beddington JR, Crute IR et al. (2010) Food security: The challenge of feeding 9 billion people. Science, 327, 812-818.
Guo R, Lin Z, Mo X. et al. (2010) Responses of crop yield and water use efficiency to climate change in the North China Plain. Agricultural Water Management, 97, 1185-1194.
Hatfield JL (2011) Climate Impacts on Agriculture: Implications for Crop Production.
Agronomy Journal, 103, 351-370.
Hoff H, Falkenmark M, Gerten D, et al. (2010) Greening the global water system. Journal of Hydrology, 384, 177-186.
Horie T, Nakagawa H, Centeno HGS, Kropff MJ (1995) The rice crop simulation model SIMRIW and its testing. In: Modeling the impact of climate change on rice production in Asia (eds Matthews RB, Kropff MJ, Bachelet D, et al.), pp. 51–56. Wallingford, Oxon, UK: CAB International in association with International Rice Research Institute.
Huang Y, Yu Y, Zhang W, et al. (2009) Agro-C: A biogeophysical model for simulating the carbon budget of agroecosystems. Agricultural and Forest Meteorology, 149, 106-129. IPCC (2013a) Food security and food production systems. in Climate Change 2014:
Impacts, Adaptation and Vulnerability (eds Field CB, Barros VR, Dokken DJ, et al.). Cambridge University Press, Cambridge, United Kingdom and New York, NY, USA, pp. 485-533.
IPCC (2013b) Climate Change 2013: The Physical Science Basis. Contribution of Working Group I to the Fifth Assessment Report of the Intergovernmental Panel on Climate Change (Cambridge University Press, Cambridge, 2013).
Iqbal J, Hu R, Lin S, et al. (2009) CO2 emission in a subtropical red paddy soil (Ultisol) as affected by straw and N-fertilizer applications: A case study in Southern China. Agriculture, Ecosystems & Environment, 131, 292-302.
Ko J, Ahuja L, Kimball B, et al. (2010) Simulation of free air CO2 enriched wheat growth and interactions with water, nitrogen, and temperature. Agricultural and Forest Meteorology, 150, 1331-1346.
Kucharik CJ (2003) Evaluation of a process-based Agro-Ecosystem model (Agro-IBIS) across the U.S. corn belt: Simulations of the interannual variability in maize yield. Earth Interactions, 7, 1-33.
Kucharik CJ (2008) Contribution of planting date trends to increased maize yields in the central United States all rights reserved. No part of this periodical may be reproduced or transmitted in any form or by any means, electronic or mechanical, including photocopying, recording, or any information storage and retrieval system, without permission in writing from the publisher. Agronomy Journal, 100, 328-336.
Leemans R & Solomon AM (1993) Modeling the potential change in yield and distribution of the earth's crops under a warmed climate. Climate Research, 3, 79-96.
Leakey AD, Uribelarrea M, Ainsworth EA, et al. (2006) Photosynthesis, productivity, and yield of maize are not affected by open-air elevation of CO2 concentration in the absence of drought. Plant Physiology, 140, 779-790.
Lesk C, Rowhani P, Ramankutty N (2016) Influence of extreme weather disasters on global crop production. Nature, 529, 84-87.
Li T, Hasegawa T, Yin X, et al. (2015) Uncertainties in predicting rice yield by current crop models under a wide range of climatic conditions. Global Change Biology, 21, 1328-1341.
Li Z, Yang P, Tang H, et al. (2014) Response of maize phenology to climate warming in Northeast China between 1990 and 2012. Regional Environmental Change, 14, 39-48. Lin E, Xiong W, Ju H, et al. (2005) Climate change impacts on crop yield and quality with
CO2 fertilization in China. Philosophical Transactions of the Royal Society B: Biological Sciences, 360, 2149-2154.
Liu L, Wang E, Zhu Y, et al. (2012) Contrasting effects of warming and autonomous breeding on single-rice productivity in China. Agriculture, Ecosystems & Environment, 149, 20-29.
Lobell DB, Schlenker W & Costa-Roberts J (2011) Climate trends and global crop production since 1980. Science, 333, 616-20.
Lobell DB, Bonfils CJ, Kueppers LM, et al. (2008) Irrigation cooling effect on temperature and heat index extremes. Geophysical Research Letters, 35, L09705.
Lobell DB & Gourdji SM (2012a) The influence of climate change on global crop productivity. Plant Physiology, 160, 1686-1697.
Lobell DB, Sibley A & Ivan Ortiz-Monasterio J (2012b) Extreme heat effects on wheat senescence in India. Nature Climate Change, 2, 186-189.
Lobell DB, Hammer GL, McLean G, et al. (2013) The critical role of extreme heat for maize production in the United States. Nature Climate Change, 3, 497-501.
Martre P, Wallach D, Asseng S, et al. (2015) Multimodel ensembles of wheat growth: Many models are better than one. Global Change Biology, 21, 911-925.
Menzel A, Sparks TH, Estrella N, et al. (2006) European phenological response to climate change matches the warming pattern. Global Change Biology, 12, 1969-1976.
Mora C, Frazier AG, Longman RJ, et al. (2013) The projected timing of climate departure from recent variability. Nature, 502, 183-187.
Muchow RC, Sinclair TR & Bennett JM (1990) Temperature and solar radiation effects on potential maize yield across locations. Agronomy Journal, 338-343.
Peng SB, Huang JL, Sheehy JE, et al. (2004) Rice yields decline with higher night temperature from global warming. Proceedings of the National Academy of Sciences of the United States of America, 101, 9971-9975.
Piao S, Cui M, Chen A, et al. (2011) Altitude and temperature dependence of change in the spring vegetation green-up date from 1982 to 2006 in the Qinghai-Xizang Plateau. Agricultural and Forest Meteorology, 151, 1599-1608.
Piao S, Ciais P, Friedlingstein P, et al. (2009) Spatiotemporal patterns of terrestrial carbon cycle during the 20th century. Global Biogeochemical Cycles, 23, GB4026.
Porter JR & Semenov MA (2005) Crop responses to climatic variation. Philosophical Transactions of the Royal Society B: Biological Sciences, 360, 2021-2035.
Priestley CHB & Taylor RJ (1972) On the assessment of surface heat flux and evaporation using large-scale parameters. Monthly Weather Review, 100, 81-82.
Ramankutty N, Evan AT, Monfreda C, et al. (2008) Farming the planet: 1. Geographic distribution of global agricultural lands in the year 2000. Global Biogeochemical Cycles, 22, GB1003.
Reddy VR, Reddy KR & Hodges HF (1995) Carbon dioxide enrichment and temperature effects on cotton canopy photosynthesis, transpiration, and water-use efficiency. Field Crops Research, 41, 13-23.
Ritchie JT & Otter S (1985) Description and performance of CERES Wheat: A user oriented wheat yield model. Willis W O. ARS wheat yield project. US: USDA-ARS, ARS238, 159-175.
Richter GM & Semenov MA (2005) Modelling impacts of climate change on wheat yields in England and Wales: assessing drought risks. Agricultural Systems, 84, 77-97.
Rosenzweig C, Jones JW, Hatfield JL, et al. (2013) The Agricultural Model Intercomparison and Improvement Project (AgMIP): Protocols and pilot studies. Agricultural and Forest Meteorology, 170, 166-182.
Rosenzweig C, Elliott J, Deryng D, et al. (2014) Assessing agricultural risks of climate change in the 21st century in a global gridded crop model intercomparison. Proceedings of the National Academy of Sciences of the United States of America, 111,
3268-3273.
Sánchez B, Rasmussen A & Porter JR (2014) Temperatures and the growth and development of maize and rice: a review. Global Change Biology, 20, 408-417.
Schar C et al. (2004) The role of increasing temperature variability in European summer heatwaves. In: Nature. pp Page, Nature Publishing Group.
Shiklomanov IA & Rodda JC (2003) World water resources at the beginning of the 21st century. International Hydrology Series (Cambridge Univ Press, Cambridge, UK). Siebert S & Ewert F (2012) Spatio-temporal patterns of phenological development in
Germany in relation to temperature and day length. Agricultural and Forest Meteorology, 152, 44-57.
Smith PC, De Noblet-Ducoudré N, Ciais P, et al. (2010) European-wide simulations of croplands using an improved terrestrial biosphere model: Phenology and productivity. Journal of Geophysical Research, 115, G01014.
Soussana JF, Graux AI & Tubiello FN (2010) Improving the use of modelling for projections of climate change impacts on crops and pastures. Journal of Experimental Botany, 61, 2217-2228.
Tao F, Yokozawa M, Xu Y, et al. (2006) Climate changes and trends in phenology and yields of field crops in China, 1981-2000. Agricultural and Forest Meteorology, 138, 82-92. Tao F, Yokozawa M, Liu J, et al. (2008) Climate-crop yield relationships at provincial scales
in China and the impacts of recent climate trends. Climate Research, 38, 83-94.
Tao F, Zhang Z, Zhang S, et al. (2012) Response of crop yields to climate trends since 1980 in China. Climate Research, 54, 233-247.
Tao F & Zhang Z (2012) Climate change, high-temperature stress, rice productivity, and water use in Eastern China: A new superensemble-based probabilistic projection. Journal of Applied Meteorology and Climatology, 52, 531-551.
Tao F, Zhang Z, Shi W, et al. (2013) Single rice growth period was prolonged by cultivars shifts, but yield was damaged by climate change during 1981-2009 in China, and late rice was just opposite. Global Chang Biology, 19, 3200-9.
Teixeira EI, Fischer G, Van Velthuizen H, Walter C, Ewert F (2013) Global hot-spots of heat stress on agricultural crops due to climate change. Agricultural And Forest
Meteorology, 170, 206-215.
Tian H, Lu C, Ciais P et al. (2016) The terrestrial biosphere as a net source of greenhouse gases to the atmosphere. Nature, 531, 225-228.
Tilman D, Balzer C, Hill J, et al. (2011) Global food demand and the sustainable intensification of agriculture. Proceedings of the National Academy of Sciences, 108, 20260-20264.
Tubiello FN, Soussana JF & Howden SM (2007) Crop and pasture response to climate change. Proceedings of the National Academy of Sciences, 104, 19686-19690.
United Nations. 2012. World population prospects: The 2012 revision.
Vautard R, Cattiaux J, Yiou P, et al. (2010) Northern Hemisphere atmospheric stilling partly attributed to an increase in surface roughness. Nature Geoscience, 3, 756-761.
Wan S, Xia J, Liu W, et al. (2009) Photosynthetic overcompensation under nocturnal warming enhances grassland carbon sequestration. Ecology, 90, 2700-2710.
Wang H, Prentice IC & Ni J (2012) Primary production in forests and grasslands of China: contrasting environmental responses of light- and water-use efficiency models. Biogeosciences, 9, 4689-4705.
Wang XH, Piao SL, Xu XT, Ciais P, Macbean N, Myneni RB, Li L (2015) Has the advancing onset of spring vegetation green-up slowed down or changed abruptly over the last three decades? Global Ecology And Biogeography, 24, 621-631.
Welch JR, Vincent JR, Auffhammer M, et al. (2010) Rice yields in tropical/subtropical Asia exhibit large but opposing sensitivities to minimum and maximum temperatures. Proceedings of the National Academy of Sciences, 107, 14562-14567.
Xiao D, Tao F, Liu Y, et al. (2013) Observed changes in winter wheat phenology in the North China Plain for 1981-2009. International Journal of Biometeorology, 57, 275-285.
Wild M, Gilgen H, Roesch A, et al. (2005) From dimming to brightening: Decadal changes in solar radiation at earth's surface. Science, 308, 847-850.
Xiong W, Conway D, Lin E, et al. (2009) Potential impacts of climate change and climate variability on China's rice yield and production. Climate Research, 40, 23-35.
Xiong W, Lin E, Ju H, et al. (2007) Climate change and critical thresholds in China’s food security. Climatic Change, 81, 205-221.
Yao F, Xu Y, Lin E, et al. (2007) Assessing the impacts of climate change on rice yields in the main rice areas of China. Climatic Change, 80, 395-409.
Zeng N, Zhao F, Collatz GJ, et al. (2014) Agricultural green revolution as a driver of increasing atmospheric CO2 seasonal amplitude. Nature, 515, 394-397.
Zhang T, Zhu J & Wassmann R (2010) Responses of rice yields to recent climate change in China: An empirical assessment based on long-term observations at different spatial scales (1981–2005). Agricultural and Forest Meteorology, 150, 1128-1137.
Chapter 2 Detecting climate change impacts on
maize yield in Northeast China
Summary
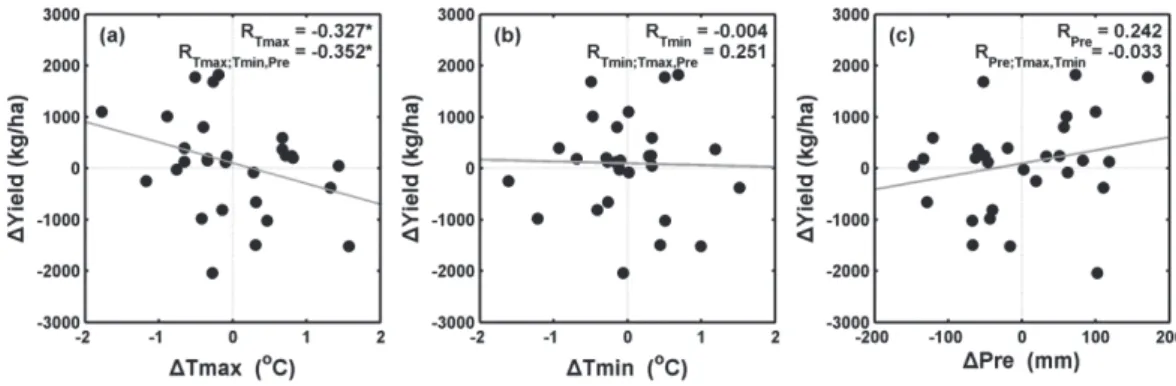
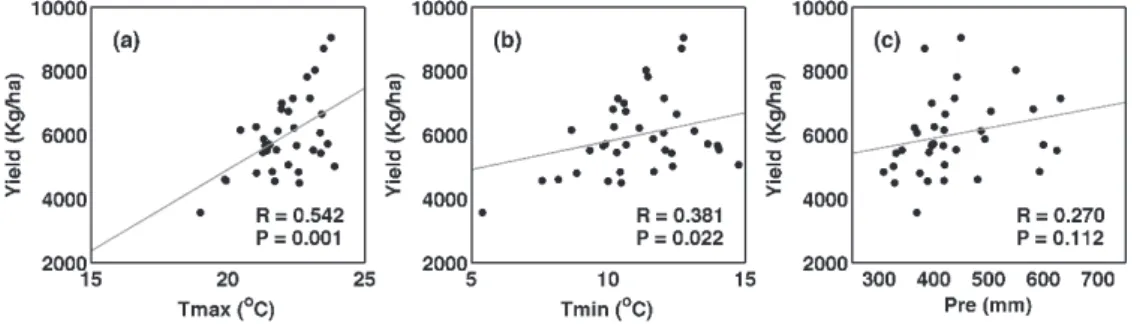
Northeast China (NEC), the most productive maize growing area in China, has experienced pronounced climate change. However, the impacts of historical climate changes on maize production and their spatial variations remain uncertain. In this study, we used yield statistics at prefecture scale over the past three decades, along with contemporary climate data, to explore the yield-climate relationship and its spatial variations. At the regional scale, maximum and minimum temperature changes had opposite impacts on maize yield, which increased by 10.0±7.7% in response to a 1 oC increase in growing season mean daily minimum temperature (Tmin), but decreased by 13.4±7.1% in response to a 1 oC increase in growing season mean daily maximum temperature (Tmax). Variations in precipitation seemed to have small impacts on the maize yield variations (-0.9±5.2 %/100mm). However, these responses of maize yield to climate variations were subject to large spatial differences in terms of both the sign and the magnitude. ~30% of the prefectures showed a positive response of maize yield to rising Tmax, which was in contrast to the negative response at the regional scale. Our results further indicate that the spatial variations in the yield response to climate change can be partly explained by variations in local climate conditions. The growing season mean temperature was significantly correlated with the response of maize yield to Tmax (R=-0.67, P<0.01), which changes from positive to negative when the growing season mean temperature exceeds 17.9±0.2 oC. Precipitation became the dominant climatic factor driving maize yield variations when growing season precipitation was lower than ~400 mm, but had a weaker influence than temperature over most of the study area. We conclude that, although NEC is a region spanning only one more millions of kilometer squares, the divergence of the yield response to climatic variations highlights the need to analyze the yield-climate relationship at fine spatial scales. This chapter has been published as Wang X et al. (2014) Divergence of climate impacts on maize yield in Northeast China. Agriculture, Ecosystems & Environment, 196, 51-58.
1. Introduction
Understanding how climate change has been affecting crop production is a prerequisite to ensure global food security and to inform adaptation decisions (IPCC, 2007; Schmidhuber and Tubiello, 2007; Godfray, 2011). Both modeling and empirical studies have indicated that maize yield is negatively affected by climate change at the global scale (IPCC, 2007; Lobell et al., 2011). However, global analyses could have hidden regional winners and losers (Godfray et al., 2010). Detailed regional analyses are thus required to explore possible mechanisms for the spatial differences in impacts of climate change on maize yield.
Maize is one of the staple food crops in China, which is currently the world’s second largest maize producer (Meng et al., 2006). Although maize is cultivated in every province in China, the three provinces in Northeast China (NEC) alone account for more than 30% of China’s maize production and 27% of its maize growing area (National Bureau of Statistics in China (NBSC), 2011). Part of this region is also the most productive maize growing area in China, known as the golden maize belt. Over the past decades, NEC has experienced faster warming than the lower latitudes of China, along with pronounced precipitation changes (Piao et al., 2010; Editorial Board of National Climate Change Assessment Report (EBNCCAR), 2011). Understanding how this historical climate change could have influenced maize production in NEC is thus critical to China’s food production and to decisions on climate change mitigation.
A variety of approaches, including statistical analyses and crop models, have been used to explore the influence of climate change on maize production in NEC (e.g. Xiong et al., 2007; Tao et al., 2008; Chen et al., 2011; Liu et al., 2012; Zhang and Huang, 2012). The estimates of the response of maize yield to climate change are, however, largely uncertain as they differ even in their signs. Some modeling studies (Xiong et al., 2007; Liu et al., 2012) indicate that warming, in particular an increase in maximum temperature, could reduce maize yield in NEC. For example, simulations by Liu et al. (2012) showed that a 1 oC warming in maximum temperature would reduce maize yield by 2 – 9% at different sites in NEC. On the contrary, another analysis indicated that 1 oC warming could improve maize yield by more than 20% in parts of NEC (Wang et al., 2007), which is in line with some
other studies indicating warming has benefited maize yield in NEC (EBNCCAR, 2011; Chen et al., 2011). Consequently, more empirical evidence is still needed to reduce the uncertainties in diagnosing and predicting the response of maize yield to climate change.
Empirical yield-climate relationships are often explored with yield statistics at province, county or farm scale (e.g. Tao et al., 2008; Chen et al., 2011; Liu et al., 2012; Zhang et al., 2012). It was found that the response of crop yield to climate change is scale-dependent (Tao et al., 2008; Zhang et al., 2010). As the relationship between maize yield and climate at prefecture scale has not yet been explored, it is of need to fill this gap. Moreover, a prefecture in NEC usually spans a relatively homogeneous geographic area from ~5 to ~54 thousand km2, covering a few grids of the high-resolution gridded climate dataset (Mitchell & Jones, 2005). The match of scale in statistics and climate data makes it suitable to explore yield-climate relationship. In addition to the scale issue, previous studies show large spatial variations in the response of crop yield to climate change (e.g. Tao et al., 2008; Chen et al., 2011), but these differences often remain unexplained or qualitatively attributed to regional differences in crop management, soils, crop varieties and other factors (e.g. Tao et al., 2008; Lobell et al., 2008). Hence, in this study, we analyzed both the yield-climate relationship and its spatial variations over 36 prefectures in NEC during 1980-2009. The objectives of this study were (1) to understand how maize yield, at regional and prefecture scale, has responded to historical climate change over the past three decades, and (2) to explore whether spatial variations in these responses can be explained by differences in local climate conditions.
2. Datasets and Methods
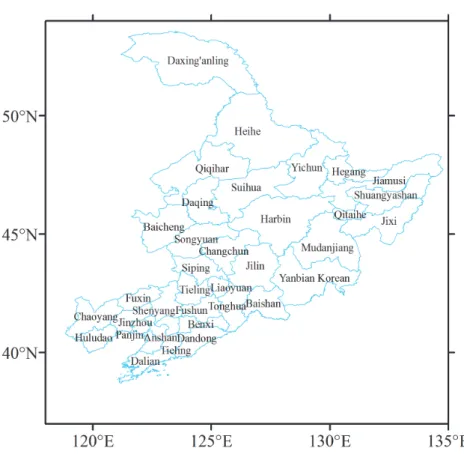
2.1 Study Area
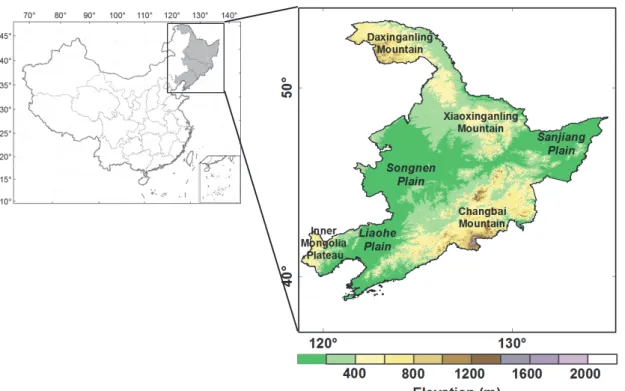
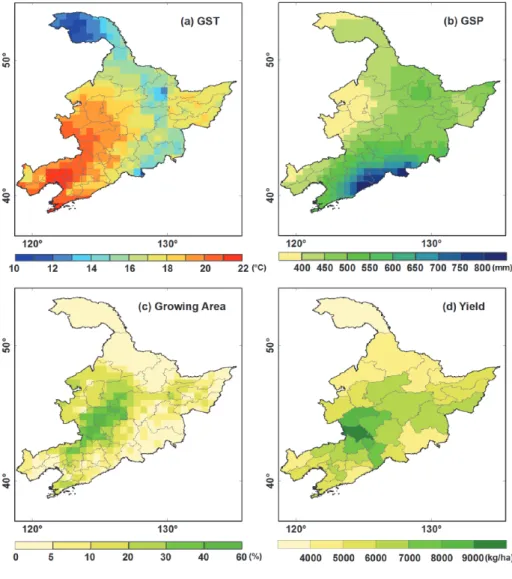
Northeast China (NEC) is located in northernmost China (38oN-54oN) (Figure 1). It has a cool summer (mean June-August temperature 20 oC) and long winter (five months), which results in a short thermal growing season (May - September) that only allows single cropping. As Figure 2a shows, the mean growing season temperature in maize planting areas generally follows a latitudinal gradient from 10 oC in the north to 22 oC in the south, except for some high-altitude mountainous areas (Daxing’anling, Xiaoxing’anling and Changbai mountain range) which are cooler than other regions on the same latitude. The growing season precipitation exhibits a southeast-northwest gradient, decreasing from more
than 800 mm to less than 400 mm (Figure 2b).
Figure 1. Geographic location of Northeast China (NEC) and spatial distribution of the
elevation over NEC.
The prefecture is a mid-level administration that is part of a province and containing several counties. The NEC is comprised of 36 prefectures with their area range from 4.8×10³ km2 (Liaoyang) to 5.44×10⁴ km2 (Heihe).
Maize is widely cultivated in NEC (Figure 2c). The total maize growing area is about 6 million hectares. The average yield is about 5000 kg/ha, ranging from 3575 to 9051 kg/ha among different prefectures with warmer area tending to have larger yield (Figure S2). The most productive area concentrated in Songliao Plain (Figure 2d).More than 90% of the maize fields over this region is rainfed (NBSC, 2011), with average precipitation more than 300mm during the maize growing season (Figure S2).
2.2 Datasets
Yield statistics for each prefecture area and in each province were obtained from the Agricultural Yearbook (1980-2009) of Liaoning Province, Jilin Province, and Heilongjiang Province, the three provinces comprising NEC (Figure S1), accessed from