HAL Id: hal-02988425
https://hal.archives-ouvertes.fr/hal-02988425
Submitted on 4 Nov 2020
HAL is a multi-disciplinary open access
archive for the deposit and dissemination of
sci-entific research documents, whether they are
pub-lished or not. The documents may come from
teaching and research institutions in France or
abroad, or from public or private research centers.
L’archive ouverte pluridisciplinaire HAL, est
destinée au dépôt et à la diffusion de documents
scientifiques de niveau recherche, publiés ou non,
émanant des établissements d’enseignement et de
recherche français ou étrangers, des laboratoires
publics ou privés.
Distributed under a Creative Commons Attribution - NonCommercial - NoDerivatives| 4.0
International License
Audrey Michaud-Dubuy, Guillaume Carazzo, Edouard Kaminski
To cite this version:
Audrey Michaud-Dubuy, Guillaume Carazzo, Edouard Kaminski. Wind Entrainment in Jets with
Reversing Buoyancy: Implications for Volcanic Plumes. Journal of Geophysical Research : Solid
Earth, American Geophysical Union, 2020, 125 (10), pp.e2020JB020136. �10.1029/2020jb020136�.
�hal-02988425�
criterion for column collapse in windy conditions. We then present new laboratory experiments on turbulent jets with reversing buoyancy rising in a crossflow in order to better constrain𝛽. Our results show that a single value of𝛽 = 0.5 can be used to describe the behavior of laboratory jets with arbitrary buoyancy. The results allow us to parameterize our 1-D model of volcanic plumes PPM and to show the crucial importance of wind gradient and profile on volcanic column dynamics through the use of the 1991 Mt. Hudson eruption as a case study. Finally, we propose a new transition diagram between the stable plume and collapsing fountain regimes, as a function of wind speed and mass discharge rate only, which can be used for the rapid assessment of major hazards during an explosive eruption.
1. Introduction
Explosive volcanic eruptions are among the most violent natural phenomena on Earth. They can cause a large variety of damages ranging from breathing difficulties to important death tolls, major air traffic disrup-tions, as well as global climate change. Plinian eruptions are characterized by the formation of a volcanic column fueled by a huge flow rate of hot gas and pyroclasts. At the vent, the hot mixture of volcanic gas and pyroclasts has a bulk density greater than the ambient, and the flow is a negatively buoyant jet driven by its initial momentum. When turbulent mixing and heating of cold atmospheric air are efficient enough, the gas rapidly expands and reduces the bulk density of the flow to values lower than the atmospheric one. The column then becomes positively buoyant and may rise up to several tens of kilometers in the atmosphere and spread volcanic fragments far from the volcano. On the other hand, if the jet consumes its initial momentum before the buoyancy reversal, it then collapses and produces deadly pyroclastic density currents (PDCs). These regimes can alternate during one single event hence the determination of the conditions leading - or not - to column collapse is crucial for volcanic hazard assessment.
Since the 1970s, numerous 1-D, 2-D, and 3-D theoretical models provided a good knowledge of the overall physics of these eruptions and have yielded a better understanding of the conditions leading to column collapse (Esposti Ongaro et al., 2008; Neri & Dobran, 1994; Sparks, 1986; Suzuki et al., 2005; Valentine & Wohletz, 1989; Woods, 1988). There is however still some discrepancies between theoretical predictions and field data, especially when the eruptions tested occurred under strong winds (Costa et al., 2016).
Wind appears indeed as an important factor in the evolution of a volcanic plume. It can cause for example a distortion of the plume trajectory by addition of horizontal momentum, which will have a strong impact on both the column maximum height (Bursik, 2001; Girault et al., 2016; Woods, 1988) and the main dispersal axis of the volcanic products (Carey & Sigurdsson, 1986; Michaud-Dubuy et al., 2019). Wind is also known to enhance the turbulent entrainment and mixing between the rising volcanic column and the atmospheric air. This influence can be quantified as follows. In a quiet environment (without wind), the inward radial velocity (ue) of ambient air within the volcanic column is defined as ue=𝛼u (Morton et al., 1956), where 𝛼
is the entrainment coefficient and u is the vertical velocity of the column. In case of a horizontal crossflow
• Table S1
Correspondence to:
A. Michaud-Dubuy, [email protected]
Citation:
Michaud-Dubuy, A., Carazzo, G., & Kaminski, E. (2020). Wind entrainment in jets with reversing buoyancy: Implications for volcanic plumes. Journal of
Geophysical Research: Solid Earth,
125, e2020JB020136. https://doi.org/ 10.1029/2020JB020136
Received 6 MAY 2020 Accepted 11 SEP 2020
Accepted article online 21 SEP 2020
©2020. The Authors.
This is an open access article under the terms of the Creative Commons Attribution-NonCommercial-NoDerivs License, which permits use and distribution in any medium, provided the original work is properly cited, the use is non-commercial and no modifications or adaptations are made.
affecting the volcanic plume, uebecomes a function of wind speed, w such as (Hewett et al., 1971):
ue=𝛼|u − w cos(𝜃)| + 𝛽|w sin(𝜃)|, (1)
where𝜃 is the inclination of the plume centerline relative to the horizontal and 𝛽 is the wind entrainment coefficient (Devenish et al., 2010; Mastin, 2014). This latter coefficient is currently not well constrained, and the range of values used in the literature varies between 0.1 and 1.0 (Bursik, 2001; Degruyter & Bonadonna, 2013; Suzuki & Koyaguchi, 2015; Woodhouse et al., 2013). This uncertainty on𝛽 leads to important discrep-ancies in predictions of maximum column heights and plume trajectories (Costa et al., 2016) and may also affect the predictions of column collapse (Degruyter & Bonadonna, 2013).
Recent laboratory experiments have provided tighter constraints on the effective value of𝛽 in turbulent jets. Aubry et al. (2017) compared the observed trajectories of positively buoyant jets rising in a windy environ-ment (Carazzo et al., 2014) to the predictions of a 1-D model in order to estimate a value for𝛽, which was found to be 0.5 ± 0.1 in all the experiments. However, these results cannot be readily used to study the impact of wind on column collapse because the key phenomenon of buoyancy reversal in volcanic eruptions is not reproduced in these experiments. Turbulent entrainment is indeed strongly reduced in the negatively buoy-ant part of a volcanic column (Carazzo et al., 2008a). A key remaining question is thus whether the value of𝛽 found for positively buoyant jets by Aubry et al. (2017) applies to the lower part of a volcanic column, the dynamics of which is known to control the stability of the entire eruptive column. To fill this gap, we present new laboratory experiments reproducing the buoyancy reversal of natural flows. For this, we com-bine the experimental procedures detailed in Kaminski et al. (2005) and Carazzo et al. (2014) to produce turbulent jets with reversing buoyancy rising in a crossflow. Our results provide the first estimate of𝛽 for both negatively buoyant jets and jets with reversing buoyancy. They are used to discuss the impact of wind on the theoretical predictions of the transition between the stable and collapse regimes of explosive volcanic eruptions.
In this work, we present a simple theoretical model to identify the control parameters on the collapse of the jet in a windy environment (section 2). In section 3, we present new laboratory experiments designed to test the predictions of our model and to estimate the value of𝛽. We present our experimental results in section 4, and we discuss the implications of this work for explosive volcanic eruptions in section 5.
2. Theoretical Criterion for Column Collapse in a Windy Environment
Turbulent jets with negative buoyancy rise to a maximum height and collapse back to their source once gravity forces have exhausted their initial momentum. Explosive volcanic jets have the ability to reverse their buoyancy by turbulent entrainment and heating of cold atmospheric air (Woods, 1988). This phenomenon is commonly investigated by modeling the flow dynamics with a set of coupled nonlinear partial differential equations (e.g., Costa et al., 2016). In this section, we develop a simplified theoretical model to investigate the main physical controls that determine whether a buoyant column can be formed and identify an analytical criterion for the collapse of explosive volcanic eruptions.
2.1. Density and Temperature
The bulk density𝜌 of a mixture of gas and particles is given by: 1 𝜌 = (1 − xg) 𝜌p +xgRgT P , (2)
where xgis the gas mass fraction,𝜌pis the particle density, P is the ambient pressure, T is the bulk tem-perature of the mixture, and Rgis the gas constant. The mass fraction of gas and temperature both depend on the rate of entrainment of ambient air. As an illustrative model, we assume that particles are at thermal equilibrium with the gas, which is valid for small particles. In this simple framework, the conservation of thermal energy may be expressed by the relationship:
xgcpg(T − Ta) = (1 − xg)cpp(Tp−T), (3)
where Tpis the temperature of the particles, Tais the temperature of the ambient air, and cpg and cppare
the specific heat of the gas and particles, respectively. Equation 3 is a simple approximation of the thermo-dynamics in a volcanic column that excludes the interaction of the kinetic and potential energies with the thermal energy and assumes that the ambient air temperature is constant.
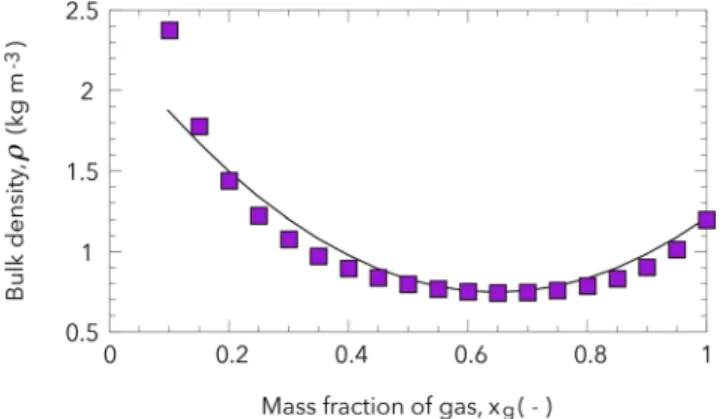
Figure 1. Evolution of the bulk density of the gas-particles mixture (in kg m−3) as a function of the mass fraction of gas (purple squares), as predicted by Equations 2 to 4. Solid line corresponds to Equation 9.
The entrainment of ambient air also causes the gas constant to vary with height. Following Woods (1988), we use this relationship:
Rg=Ra+ (Rg0−Ra) (1 − xg)
xg xg0
(1 − xg0), (4)
where Ra=287 J kg−1K−1is the gas constant for the air, and the subscript 0 denotes values at the source.
Figure 1 shows the evolution of the bulk density of the mixture as a function of the mass fraction of air in the mixture, as predicted by Equations 2 to 4. Calculations are made at𝜌p=2,000 kg m−3, cpp =
1,000 J K−1kg−1, c pg =1,600 J K −1kg−1, T a =293 K, Tp = 1200 K, Rg0 = 461 J kg −1K−1, x g0 = 0.95, and
P = 105Pa (Michaud-Dubuy et al., 2018). This result illustrates how the entrainment and heating of cold
atmospheric air lead to a reduction of the bulk density to values below the air density for xg≥ 0.25. This
peculiar evolution determines whether a column becomes buoyant (i.e., xg becomes≥0.25) or collapses
(i.e., xg< 0.25 when initial momentum is exhausted).
2.2. Conservation Equations
We follow the approach of Morton et al. (1956) and use a 1-D steady state “top-hat” formalism for a conical jet in which all the dynamical variables are considered constant inside the jet and zero outside. Equations are written in a plume-centered coordinate system, where s denotes the curvilinear abscissa along the plume centerline and𝜃 is the local inclination of the jet (Hewett et al., 1971; Hoult et al., 1969).
For “top-hat” radial dependence of the plume properties, the conservation equations of mass flux, axial and radial momentum fluxes, and particle flux of the mixture assuming no sedimentation are
d ds ( 𝜌ur2)=2ru e, (5) d ds ( 𝜌u2r2)=(𝜌 a−𝜌 ) gr2sin(𝜃) + w cos(𝜃)d ds ( 𝜌ur2), (6) ( 𝜌u2r2) d𝜃 ds = ( 𝜌a−𝜌 ) gr2cos(𝜃) − w sin(𝜃)d ds ( 𝜌ur2), (7) d ds ( xp𝜌ur2)=0, (8)
where r is the mixture radius, u is the mixture velocity, g is the acceleration of gravity,𝜌 is the bulk density of the mixture,𝜌ais the ambient density, xp =1 − xgis the fraction of pyroclasts in the mixture, w is the wind speed, and ueis the entrainment velocity at the edge of the mixture, calculated using Equation 1. To solve these equations analytically, we adopt the Boussinesq approximation, which neglects variations in density except in buoyant terms. This assumption is valid for small density contrasts (Turner, 1979), but may not be true very close to the vent (Cerminara et al., 2016). The density of the volcanic mixture may be
parameterized approximately in terms of the mass fraction of gas in the mixture according to a quadratic of the form (Kaminski et al., 2005; Woods & Caulfield, 1992):
(𝜌a−𝜌) =[1 − (1 − X)2]Δ𝜌m, (9) where Δ𝜌m=𝜌a−𝜌m, and X = xg/xm, with𝜌mthe minimum density the mixture may attain, which occurs
when xg=xm(Figure 1). This simple law (solid line in Figure 1) captures relatively well the evolution of
the bulk density of the mixture calculated using Equations 2 to 4 (symbols in Figure 1) and can be used to simplify the buoyancy terms in Equations 6 and 7. We note that our empirical fit does not reproduce very well the bulk density calculated for low gas mass fraction, which will increase the uncertainty when replacing the parameters values in the analytical solution.
This theoretical model fully describes the motion of a turbulent volcanic mixture rising in a windy environ-ment, and it can be used to calculate the conditions for the collapse of the mixture and the trajectory of the jet. In order to simplify the analytical resolution of the set of Equations 5 to 8, we assume for now that𝛼 and
ware constant with height. We then introduce a new set of dimensionless variables:
𝜁 = s r0 , (10) W∗= w u0, (11) Q = ur2 u0r2 0 , (12) M = u2r2 u2 0r 2 0 , (13) Ri0=r0g u2 0 ( 𝜌a−𝜌0 ) 𝜌a , (14)
where Ri is the Richardson number, and the subscript0denotes values at the source. Equation 8 can then be written:
XQ = X0Q0, (15)
which gives the volume flow rate of pyroclasts in the mixture at any dimensionless distance from the source𝜁.
Combining Equations 5 to 8 and inserting Equations 9 and 15 gives two dimensionless conservation equations: dQ d𝜁 =2𝛼M 1∕2−2W∗ Q M1∕2[𝛼 cos(𝜃) − 𝛽 sin(𝜃)] , (16) cos(𝜃)Md𝜃 d𝜁 +sin(𝜃) dM d𝜁 =Ri0 Δ𝜌m Δ𝜌0 Q2 M [ 1 − ( 1 −X0 Q )2] . (17)
where Δ𝜌0 = 𝜌a−𝜌0. Analytical solutions to Equations 16 and 17 are possible only when assuming two
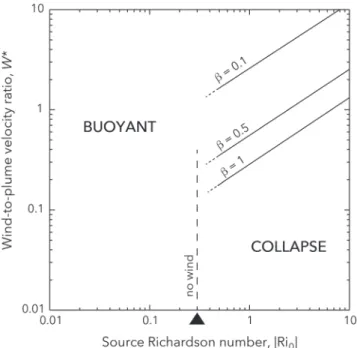
Figure 2. Theoretical criterion for the collapse of a typical volcanic jet. Dashed and solid lines correspond to predictions made for the no wind case (Equation 23), and the highly negatively buoyant jets in a windy environment with𝛽 =0.1, 0.5, and 1 (Equation 29), respectively. The critical Ri0for the no wind case (solid triangle) is represented as a vertical line for clarity.
2.3. No Wind Case
In the absence of wind, W∗=0and the inclination of the jet remains at𝜃 = 𝜋∕2. Equations 16 and 17 may
then be reduced to the classical form: dQ d𝜁 =2𝛼M 1∕2, (18) dM d𝜁 =Ri0 Δ𝜌m Δ𝜌0 Q2 M [ 1 − ( 1 −X0 Q )2] . (19)
By combining these two equations, we obtain: ( M(𝜁)5∕2−1)= 5Ri0 4𝛼 Δ𝜌m Δ𝜌0 [ X0 ( Q(𝜁)2−1)−X02(Q(𝜁) − 1)], (20) which relates Q(𝜁) to M(𝜁) at any distance from the source. As the jet rises from the source, the momentum flux decreases due to negative buoyancy forces (i.e., dM/d𝜁 < 0). If the jet is to collapse before becoming buoyant, then the momentum flux falls to zero (i.e., M = 0) and the jet forms a turbulent fountain. On the other hand, if a buoyancy reversal occurs before the initial momentum is exhausted, then the momen-tum flux increases due to positive buoyancy forces (i.e., dM/d𝜁 > 0) and a buoyant plume forms. At the plume/fountain transition, there must thus be a real solution of Equation 20 with M = 0 and dM∕d𝜁 = 0. Inserting these conditions in Equations 19 and 20 gives a criterion for the collapse of the mixture:
5Ri0 4𝛼 Δ𝜌m Δ𝜌0 [ X0 ( X2 0 4 −1 ) −X2 0 (X 0 2 −1 )] = −1, (21)
which may be rewritten as
Ri0= 4𝛼 5 Δ𝜌0 Δ𝜌m ⎡ ⎢ ⎢ ⎢ ⎣ 1 X0 (X 0 2 −1 )2 ⎤ ⎥ ⎥ ⎥ ⎦ . (22)
In the absence of wind, the criterion for the collapse of the jet corresponds to a critical Richardson number, a result consistent with previous studies (Kaminski et al., 2005; Woods & Caulfield, 1992). The value of this critical Richardson number depends on the entrainment coefficient and the properties of the volcanic mixture. Figure 1 gives xm=0.35,𝜌m=0.74 kg m−3, and𝜌a =1.2kgm−3. Considering a volcanic mixture
with a gas content of 5% at the vent, and an entrainment coefficient𝛼 = 0.06 at the base of the column (Carazzo et al., 2008a; Suzuki & Koyaguchi, 2010), the theoretical critical Richardson number becomes:
Ri0≈ −0.3, (23)
that we use in Figure 2 to draw the plume/fountain transition in the absence of wind as a vertical line for clarity. Note that in this numerical application, our empirical fit (Equation 9) gives𝜌0 = 2 kg m−3for xg = 5wt%, whereas the bulk density calculated with Equations 2 to 4 reaches a more realistic value of
3.7 kg m−3. Using the latter value in Equation 22 gives Ri
0≈ −0.8, suggesting that our calculated value of
Ri0should be taken with caution. We note however that our range of Ri0is fully consistent with the one
proposed by Aubry and Jellinek (2018) (i.e., Ri0= −0.3 to −0.9 in the absence of wind).
2.4. Negatively Buoyant Jets in a Windy Environment
We now consider the case of negatively buoyant jets at high|Ri0|, for which the value of the radial entrain-ment coefficient is predicted to fall to zero (Kaminski et al., 2005), in a windy environentrain-ment but with a low inclination angle such as𝜃 ≈ 𝜋/2. Equations 16 and 17 may then be reduced to:
dQ d𝜁 =2𝛽W ∗ Q M1∕2, (24) dM d𝜁 =Ri0 Δ𝜌m Δ𝜌0 Q2 M [ 1 − ( 1 −X0 Q )2] . (25)
By combining these two equations, we obtain: ( M(𝜁)3∕2−1)= 3Ri0 4𝛽W∗ Δ𝜌m Δ𝜌0 [ 2X0(Q(𝜁) − 1) − X02ln{Q(𝜁)}], (26) which relates Q(𝜁) to M(𝜁) at any distance from the vent. Inserting the conditions at the plume/fountain transition (i.e., M = 0 and dM∕d𝜁 = 0) in Equations 25 and 26 gives a criterion for the collapse of the jet:
−4 3𝛽W ∗=Ri 0 Δ𝜌m Δ𝜌0 [ X2 0 { 1 − ln (X 0 2 )} −2X0 ] , (27)
which may be rewritten as
Ri0= −4 3𝛽W ∗Δ𝜌0 Δ𝜌m ⎡ ⎢ ⎢ ⎢ ⎣ 1 X2 0 { 1 − ln(X0 2 )} −2X0 ⎤ ⎥ ⎥ ⎥ ⎦ . (28)
In the case of negatively buoyant jets at high Ri0in a windy environment, the criterion for the collapse of the mixture thus depends both on a critical Richardson number and a critical wind-to-plume velocity ratio. The exact values of these numbers are given by the wind entrainment coefficient and the properties of the volcanic mixture. Using the same parameters as for the no wind case, the theoretical critical Richardson number becomes:
Ri0≈ −8𝛽W∗, (29)
that we report in Figure 2 for𝛽 = 0.1, 0.5, and 1. This analytical criterion for the collapse of the jet shows that the wind increases the range of source and environmental conditions for which the volcanic mixture forms a stable plume and confirms that increasing the value of𝛽 promote the formation of a stable plume. This result is fully consistent with those of Degruyter and Bonadonna (2013) and highlights the importance of constraining the value of𝛽 in order to make accurate predictions. To that aim, we performed laboratory experiments on jets with a negative and reversing buoyancy in a windy environment.
Figure 3. Schematic diagram of the experimental apparatus and expected density profile of the EEG mixture when mixed with water.
3. Laboratory Experiments on the Impact of Wind on Column Collapse
3.1. Experimental Device
We now present laboratory experiments aimed at reproducing the ability of natural volcanic jets to reverse their buoyancy. Here we use a mixture of ethanol and ethylene glycol (EEG) that is less dense than fresh water but becomes denser when mixed with more than 40% of water (Figure S1 in the supporting information), which mimics the behavior of a natural volcanic column (Kaminski et al., 2005). The EEG density is also a known function of the degree of mixing between the EEG and the water that can be approx-imated by Equation 9 (Figure S1). The jet source is towed at a constant speed to reproduce the effect of wind, as in Carazzo et al. (2014). The wind speed is thus considered constant in the tank (i.e., no wind gradient in the jet).
All experiments are conducted at ambient temperature in a 100 × 40 × 45 cm3Plexiglas tank filled with fresh
water. Prior to an experiment, a constant head tank is filled with a mixture of pure (not diluted) colored EEG using a pump connected to a larger reservoir (Figure 3). At the start of the experiment, we open the valve of the towed jet source releasing the fluid downward from the water surface. Every injection last between 10 and 60 s and is recorded using a video camera. We vary the volumetric flow rate (Q0), the lateral speed of the
injector (i.e., the speed of the crossflow w), and the inner radius of the source (r0) from one experiment to another in order to cover the full range of conditions appropriate to insure dynamic similarity with a natural volcanic jet. We observe during each experiment whether the column forms a buoyant plume or a collapsing fountain. Table S1 gives the run conditions of the experiments (numbered 1 to 27).
We present a complementary set of laboratory experiments to reproduce the behavior of negatively buoyant jets (i.e., collapsing) in a windy environment. For this, we fill the tank with an aqueous NaCl solution, and we inject colored fresh water. We further use these experiments to measure the flow trajectory and constrain the value of𝛽 using our model (section 2.1). We perform six experiments (numbered I to VI in Table S1) in which we vary the volume flux of the injected fluid Q0, the density of the ambient fluid𝜌a (i.e., salty
water), and the crossflow speed w from one experiment to another. For each experiment, a series of recorded pictures is extracted and averaged to give a final image on which we measure the central trajectory. 3.2. Scaling Analysis
Our laboratory experiments are at reduced scale compared to the natural phenomenon and require some analysis to ensure that they adequately scale to volcanic plumes (Roche & Carazzo, 2019). Two dimension-less numbers arise from our analysis (section 2): the source Richardson number (Ri0) and the wind-to-plume
velocity ratio (W∗). Ri
0characterizes the balance between the buoyancy and inertial forces at the source and
varies from −10−3to −7 × 10⁻¹in our experiments (Table S1). The velocity scale W∗is related to the presence
of the crossflow and varies from 0 to 1.1 in our experiments (Table S1). A third important dimensionless number is the source Reynolds number (Re0) which corresponds to the ratio between inertial to viscous
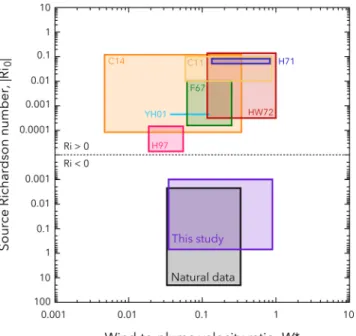
Figure 4. Review of source Richardson number (Ri0) and wind-to-plume velocity ratio (W∗) for natural volcanic
plumes and experimental works published in relation with positively buoyant jets (upper boxes) and negatively buoyant jets (lower boxes) in a crossflow. The values of Ri0for natural data correspond to those at the volcanic vent. C01: (Contini & Robins, 2001), C14: (Carazzo et al., 2014), F67: (Fan, 1967), H71: (Hewett et al., 1971), HW72: (Hoult & Weil, 1972), H97: (Huq, 1997), YH01:
(Yang & Hwang, 2001).
forces at the source. In explosive eruptions, 107≤ Re
0≤ 109, which is unattainable under laboratory
condi-tions (Re0≈103). We note, however, that our flows are at Re high enough to transition to full turbulence at
short distance from the source (Table S1, Ho & Huerre, 1984) and are conducted under Re conditions com-parable to many published studies (Burgisser et al., 2005; Carazzo & Jellinek, 2012). Increasing the value of Re to those observed in nature would only reduce the turbulence fine scale while the maximum size of the eddies would still be imposed by the geometry of the nozzle. Our laboratory flows are thus well described using the theoretical framework of Morton et al. (1956)'s set of conservation equations.
Volcanic mixtures commonly erupt from the vent at pressures that are greater than or less than the atmo-spheric pressure and velocities (u0) that are greater than the fluid sound speed (c). The Mach number
(i.e., Ma = u0∕c) typically reaches 1 to 6 in powerful explosive volcanic eruptions (Medici et al., 2014), which is unattainable under our laboratory conditions (Ma ≈ 10−5). Shock tube experiments can overcome this
problem but at the cost of neglecting buoyancy forces (i.e., Ri0< 10−5) (Kieffer & Sturtevant, 1984; Medici
et al., 2014). Another limitation of our experimental device is the lack of wind gradient (i.e., the variation of wind speed with altitude), which is also known to play an important role in volcanic plume dynamics. Its impact will however be investigated through a thorough sensitivity analysis of a more detailed theoretical model of volcanic plume in section 5.
Figure 4 shows that our experimental range of wind-to-plume velocity ratio (W∗) is consistent with values
calculated for volcanic plumes (Carazzo et al., 2014). The Richardson number at the base of volcanic jets is negative because the eruptive mixture is denser than the atmosphere at the vent. Our experimental range of Ri0is consistent with values calculated for the source of volcanic plumes (Figure 4). We note that all
previous studies designed to investigate the behavior of a turbulent jet in a crossflow were performed at Ri0 > 0 at the source, which prevents from reproducing the buoyancy reversal that controls the column collapse
transition. To the best of our knowledge, the laboratory experiments presented in this study are the first to simulate turbulent jets with reversing buoyancy (i.e, Ri0< 0 at the source and Ri > 0 far from the source)
experiment numbers reported in Table S1.
4. Results
4.1. Qualitative Observations
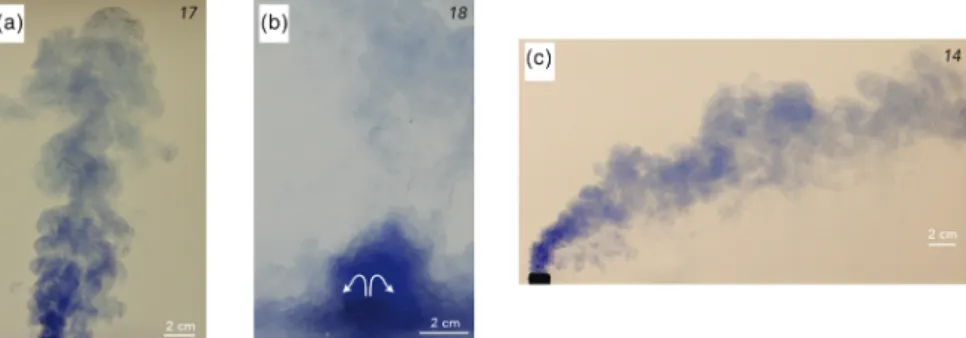
Our experiments investigate the different phenomena that occur when we vary both the crossflow rate, the exit velocity, vent radius, and density difference with ambient, which control the Richardson number and wind-to-plume velocity ratio. Although the EEG mixture is lighter than the environment at the source, its density increases as a result of turbulent entrainment and dilution to values higher than the ambient density. Resultant buoyancy forces act as to increase the initial momentum flux and drive the plume to the bottom of the tank. This behavior is shown in Figure 5a and is analog for the formation of a strong plume (Wilson, 1976).
For high density differences at the source and low flow rates, there is less entrainment of and mixing with the ambient fluid. The injected mixture remains too light to undergo a buoyancy reversal and returns to the top of the tank as a turbulent fountain feeding radial gravity current. This behavior is shown in Figure 5b and is an analog to a collapsing volcanic fountain with associated PDCs (Sparks & Wilson, 1976).
For high wind velocities (i.e., W> 0.018 m s−1, see Experiments 1 to 27 in Table S1), the jet mixes more
effi-ciently than in the strong plume case, by ingesting significant quantities of ambient fresh water through the action of wind. The centerline of the jet bends over in the wind field and reaches the bottom of the tank. This behavior is shown in Figure 5c and is analog for the formation of a weak plume (Bonadonna & Phillips, 2003). A striking observation is that the formation of a turbulent fountain could not be reached under high wind speed conditions (i.e., W ≥ 0.012 m s−1), which always lead to the formation of a stable plume
(see Experiments 1 to 27 in Table S1). 4.2. The Plume/Fountain Transition
The simple analytical expression for collapse presented in section 2 can be adapted to our laboratory experi-ments. In this framework, Equations 23 and 29 together with the mixture properties given in Figure S1 and
𝛼 ≈ 0.05 (Kaminski et al., 2005) provide a theoretical critical Richardson number Ri0= −0.3 in the absence
of wind and Ri0= −10𝛽W∗in a windy environment. These two criteria are quite close to those obtained for
a typical Plinian eruption (section 2) reflecting the good dynamic similarity between the two systems. To go further to a more stringent comparison between theory and experiments, we consider here the full numer-ical solution of the conservation Equations 1 and 5 to 9. Numernumer-ical solutions are indeed required to cope with the evolution of the entrainment coefficient with the evolving buoyancy of the jet itself.
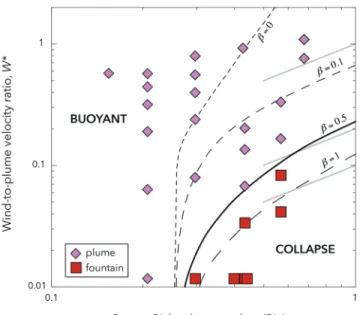
Figure 6 shows the comparison between the theoretical predictions of collapse and our experimental obser-vations using the two key parameters identified in section 2: the wind-to-plume velocity ratio (W∗) and the
source Richardson number (Ri0). A similar diagram was used in previous studies on the effect of wind on volcanic column dynamics (Aubry & Jellinek, 2018; Degruyter & Bonadonna, 2013). We calculate several theoretical thresholds W∗before collapse as a function of Ri
0, each accounting for a different value of𝛽
(Devenish et al., 2010; Mastin, 2014). Not surprisingly, increasing the value of𝛽 (and thus the entrainment due to wind) increases the range of stability conditions to form a stable plume. The theoretical threshold calculated for𝛽 = 0.5 yields the best agreement with the experimental observations.
Figure 6. Theoretical threshold wind-to-plume velocity ratio (W∗) at the transition between buoyant and collapse regimes as a function of the source Richardson number Ri0, for𝛽 =0 (small dashed line),𝛽 =0.1 (medium dashed line),𝛽 =0.5 (solid line),𝛽 =1 (large dashed line), compared with our experiments of jets with reversing buoyancy (purple and red symbols, see Table S1). Grey solid lines correspond to predictions made withRi0= −10𝛽W∗. Note that
for𝛽 =0, Equation 1 becomesue=𝛼|u − w cos(𝜃)|and the effective entrainment is increased compared to the no wind case (i.e.,ue=𝛼u) promoting the buoyant regime at high-W∗conditions.
4.3. Trajectory of Negatively Buoyant Jets
To further test whether our estimated value of𝛽 is able to capture the full dynamics of the negatively buoyant part of the jet, we calculate the predicted trajectory of negatively buoyant jets produced in the second set of experiments (I to VI in Table S1) and compare them to our observations. Figure 7a shows the comparison for three experiments (I, IV, and V) and reveals that the experiments are in good agreement with the theoretical predictions made with our numerical model when using𝛽 = 0.5 (black lines). This value for negatively buoyant jets appears to be the same as the one found by Aubry et al. (2017) for positively buoyant jets. To further strengthen the hypothesis that a single value of𝛽 could be used to describe the wind entrainment in turbulent jets with arbitrary buoyancy, we compare the single trajectories obtained by Contini and Robins (2001) for positively buoyant jets to our theoretical predictions, and also found a good agreement for𝛽 = 0.5 (Figure 7b). A constant value of𝛽 = 0.5 can therefore be used to describe wind entrainment in turbulent
Figure 7. (a) Dimensionless trajectories of jets derived from ensemble averaged video images of three experiments (black symbols, see Table S1) of jets with negatively buoyancy, compared with theoretical predictions. Calculations are made using a 1-D theoretical model accounting for a wind entrainment coefficient𝛽 =0.5 (black line). Distances are normalized by 2r0, with r0=3 mm. (b) Comparison between our theoretical predictions for a wind entrainment coefficient𝛽 =0.5 (black lines), and the trajectories of positively buoyant plumes measured by Contini and Robins (2001).
Figure 8. Predictions of column collapse made with our 1-D theoretical model PPM (see Appendix A and Michaud-Dubuy et al., 2018). (a) Threshold mass discharge rate as a function of the total gas content for the no wind case and considering a polar (black curve), midlatitude (blue curve), and tropical atmosphere (red curve). (b–d) Threshold mass discharge rate as a function of the total gas content when considering a midlatitude atmosphere and a uniform, linear or complex wind profile, respectively. The blue dotted curves correspond to the no wind case, and the red, black, and blue curves to a maximum wind speed of 10, 20, and 30 m s−1, respectively. The wind profiles are described in the main text. All simulations were made considering a magma temperature of 1200 K.
jets with arbitrary buoyancy, provided that the entrainment coefficient𝛼 varies as a function of the local buoyancy as described in Kaminski et al. (2005).
5. Volcanological Implications
5.1. Predictions of Column Collapse for Various Atmospheric Conditions
We now use the constant value of wind entrainment coefficient𝛽 found with our laboratory experiments to parameterize our 1-D theoretical model (PPM) of explosive volcanic eruption (Michaud-Dubuy et al., 2018), which is detailed in Appendix A. As described in Michaud-Dubuy et al. (2018), this model takes into account particle sedimentation, modulation of the effective amount of gas in the column (through gas entrapment and open porosity), as well as the variation of the entrainment coefficient𝛼. Our theoretical analysis and lab-oratory experiments highlight the importance of both Ri0and W∗, a result consistent with previous studies
(Degruyter & Bonadonna, 2013). The effect of wind gradient being neglected in our laboratory experiments, we perform a sensitivity analysis of a refined version of the PPM model by testing the effect of both the atmo-spheric temperature and wind profiles on the prediction of column collapse. The results are presented in Figure 8. We first test the effect of several atmospheric temperature profiles corresponding to typical condi-tions at tropical, polar, and midlatitudes (Carazzo et al., 2008b; Girault et al., 2014) in the absence of wind. The surface temperature is set at 260 K, 293 K, and 310 K for the polar, midlatitude, and tropical profiles, respectively, and decreases to a minimum value at the tropopause before increasing up to the stratopause. The altitude of the tropopause varies with the latitude: around 16–18 km-high in tropical regions, 11 km-high
at midlatitudes, and even lower in the polar regions (about 6 to 8 km-high). Woods (1995) demonstrates that the tropopause altitude has a strong effect on the volcanic plume height that can be explained by both the thermal gradient inversion, and abrupt changes in wind speed and direction at this altitude level.
Figure 8a shows that tropical atmospheric conditions favor column collapse compared to a polar or a mid-latitude ones. For a given total gas content, the threshold mass discharge rate before collapse is indeed decreased by a factor 2 and 3 when considering a tropical profile, which can be explained by the thermal gradient inversion occurring much higher in the atmosphere than for the polar or midlatitudes.
We then consider three choices of horizontal crosswind in the atmosphere together with a midlatitude tem-perature profile as in Girault et al. (2016). The “uniform wind” profile sets a constant crosswind speed from the volcanic vent up to the maximum height of the column. The “linear wind” profile corresponds to a lin-ear increase of wind speed from 0 m s−1at the Earth's surface to a maximum value at the tropopause height,
then the value remains constant up to the maximum height of the column. Finally, the “complex wind” pro-file is a parabolic propro-file, taken as a first-order model for typical wind conditions in the atmosphere (Hedin et al., 1996). The wind speed is set at 5 m s−1at the surface and increases up to a maximum value at the
tropopause, then the wind speed decreases above the tropopause until it reaches 2/3rd of its maximum value and keeps this constant speed at higher altitude. For each type of wind profile, we test three maximum wind speed (10, 20, and 30 m s−1), and we set the wind entrainment coefficient𝛽 to 0.5 as determined from the
laboratory experiments.
Figure 8b shows the major effect of a uniform wind profile on the column stability. As expected, increasing the value of maximum wind speed promotes the formation of a buoyant plume. When accounting for a max-imum wind speed of 30 m s−1, the critical mass discharge rate at which collapse occurs is indeed increased
by one order of magnitude, relative to the predictions made for the no wind case. A uniform wind profile, that is, with a constant value of wind speed over the entire atmosphere, is however not very common in nature. When using a linear wind profile, the effect of a horizontal crosswind is considerably reduced, espe-cially for low values of total gas content at the vent (Figure 8c). This result can be explained by the low values of wind speed near the vent, which decrease the entrainment velocity to values close to those calculated for the no wind case (in the lowest levels of the atmosphere). We finally test a complex wind profile and show in Figure 8d that it has an intermediate effect between the two previous end-members, probably because of the higher wind speed at the source and at low altitudes (where column collapse occurs).
These results thus demonstrate, in addition to the effect of both Ri0and W∗, the strong effect of wind gradient
on column collapse and highlight the necessity to use the exact wind profile when comparing data from historical volcanic eruptions with theoretical predictions. However, such cases are less than common. 5.2. The Case Study of Mt. Hudson (Chile) Eruption in 1991
We now seek to compare our model predictions with a historical eruption providing well-constrained source values (i.e., gas content, mass discharge rate, total grain-size distribution, and temperature) and environ-mental (i.e., wind data) conditions. In addition, we wish to select a case with a strong mass discharge rate so it would be close to the critical threshold calculated for the no wind case (blue dotted curve in Figures 8b–8d), in order to clearly emphasize the effect of wind on the column stability. Among the historical events available in the literature (Aubry et al., 2017; Mastin, 2014) only the 14 August 1991 eruption of the Mt. Hudson in Chile meets all the requirements with high quality data.
The paroxysmal phase of the volcanic activity was reached between the 12 and 15 of August during the 1991 Hudson eruption. On 14 August, the observed volcanic column was stable, steady and reached 15 km above the vent (i.e., 16.9 km a.s.l., Mastin, 2014). The mass discharge rate was estimated to 7 × 10⁷kg s−1
(Mastin, 2014), for which we assume an uncertainty of a factor of 2, and we consider a magma temperature of 1, 245 ± 26 K (Kratzmann et al., 2009). Kratzmann et al. (2009) estimated the dissolved water content to 2 ± 1 wt%. We correct this value for the presence of crystals and lithics fragments, which do not contain volatiles (Kaminski & Jaupart, 2001). Considering a proportion of crystal and lithic contents of 9.8 ± 2.0 wt% (Kratzmann et al., 2009) and 20% (Scasso et al., 1994), respectively, and assuming complete degassing, we deduce a total gas mass fraction in the mixture of 1.4 ± 0.7 wt% (see Appendix A). We use the wind profile obtained by Mastin (2014) from NCEP/NCAR Reanalysis 1 data (Figure 9a). We note the strong winds near the volcano surface that day (≈20 m s−1), and a maximum wind speed reaching>40 m s−1higher in the
Figure 9. Case study of the Mt. Hudson eruption in 1991. (a) Wind profile used for the simulations with PPM (see Appendix A), from Mastin (2014). (b–d) Evolution of the column velocity, column radius, and density difference between the volcanic column and the atmosphere with altitude, respectively. The blue curves correspond to simulations made with𝛽 =0.5, the green curves with𝛽 =0.9, the orange curves with𝛽 =0.1, and the pink curves to the no wind case. All calculations are made considering an initial mass discharge rate of 7×10⁷kg s−1(Mastin, 2014),
a total gas content of 1.4 wt% (see main text), a vent altitude of 1,905 m, a midlatitude atmosphere, and a magma temperature of 1245 K.
Panels b to d in Figure 9 show the evolution of the column velocity, the column radius, and the density difference between the column and the atmosphere as a function of altitude, respectively, for several values of wind entrainment coefficient𝛽 (i.e., 0.1, 0.5, and 0.9) in order to cover the large range of values used in the literature. A striking result is that the strong winds allow the turbulent jet to form a buoyant plume whereas in the absence of wind the model predicts a column collapse. A low value of𝛽 provides predictions of column collapse (𝛽 = 0.1; orange curves) with a low fountain height (i.e., ≈4 km a.s.l.). For 𝛽 = 0.9, meaning a strong effect of wind, our model predicts a stable plume rising up to 12.9 km a.s.l., which is almost 4 km smaller than the observations made during the eruption. When taking𝛽 = 0.5 as suggested by our laboratory experiments, we predict a stable plume rising up to 15.2 km a.s.l. similar to the one observed on 14 August 1991. These results show that our estimation of𝛽 best captures the behavior of this eruption.
To strengthen this conclusion, we used a Monte Carlo method to generate a set of 100 initial conditions by accounting for their uncertainties. For each parameter (e.g., mass discharge rate, temperature, and total gas mass fraction), we assume a Gaussian distribution centered on the measured value with standard deviation chosen to match the estimated 95% confidence interval. We then draw 100 samples of each variable and run the model for𝛽 = 0.1, 0.5, 0.9 and no wind conditions. Our calculations show that a stable plume forms in all cases with a maximum height of 15.1 ± 1.1 km a.s.l. when𝛽 = 0.5, and 12.8 ± 0.8 km a.s.l. when 𝛽 = 0.9. A column collapse occurs with a fountain height of 3.6 ± 0.5 km a.s.l. in 80% of the cases when𝛽 = 0.1, and 3.6 ± 0.6 km a.s.l. in 90% of the cases for no wind conditions. These results confirm that𝛽 = 0.5 provides the best predictions, and further emphasize that a not well enough constrained value of𝛽 prevents all predictive abilities of the model.
The comparison between our model predictions and field data clearly shows that the strong winds (i.e.,>30 m s−1over ≈80% of the total column height) prevented the volcanic column to collapse. This
erup-tion, although overshadowed by the more powerful Pinatubo eruption at the time, also had a strong effect on climate as it injected important amounts of SO2in the atmosphere (3,720 kT in total during the 9 to 15
August eruptions, and 400 kT on the 14th; Constantine et al., 2000). We thus can expect that the strong winds occurring that day had an impact all the more important by stabilizing the volcanic plume. In case of weakest winds, the column would most probably have collapsed, thus producing potential deadly pyroclas-tic density currents, but preventing the cooling effect associated with the injection of sulfur aerosols in the stratosphere.
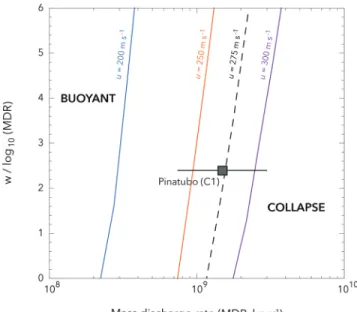
Figure 10. Ratio of the threshold wind speed (in m s−1) and mass discharge rate at the transition between buoyant
(left domain of each curve) and collapse (right domain of each curve) regimes, as a function of the mass discharge rate (in kg s−1). Each color represents a different value of the plume velocity at the vent. Calculations are made with an
initial exsolved gas content of 3 wt%. We consider a linear wind profile, a tropical atmosphere, and a magma temperature taken as the average of andesitic magma (T0=1200 K). The grey square corresponds to the eruptive conditions of the 1991 Pinatubo eruption (phase C1, see main text). Error bars are either shown by a black line or are comprised within the symbol.
5.3. New Regime Diagram for Column Collapse in Case of Wind
To go further, we calculated the wind speed (w) required to prevent a volcanic column to collapse and there-fore propose a new transition curve based on the relationship between the mass discharge rate (MDR) and
w/log10(MDR) (Figure 10). Contrary to Ri0and W∗, these two parameters can be easily determined from
maximum column height and wind measurements for historical eruptions (Mastin et al., 2009) or from the downwind to crosswind ratio of the distribution of lithic fragments (isopleths) for past eruptions (Carey & Sigurdsson, 1986). The threshold ratio w/log10(MDR) is calculated as a function of MDR for different plume
velocity at the vent and all calculations were made using a gas content of 3 wt%. A volcanic plume with this amount of gas is likely to have an exit velocity>200 m s−1. We consider a linear wind profile (see section 5.1)
characterized by a maximum value of w at the tropopause and a tropical atmosphere. Under no wind condi-tions, a volcanic plume becomes buoyant regardless of its initial velocity as long as the MDR is smaller than ≈2 × 10⁸kg s−1(Figure 10), thus defining a minimal mass discharge rate below which there is no column
collapse. If wind blows during the eruption, the threshold ratio w/log10(MDR) steadily increases with MDR.
We compare this new regime diagram with an eruptive event characterized by similar eruptive and environ-mental conditions: the 1991 Pinatubo eruption (Philippines). This event is one of the most powerful eruption of the XXth century since it propelled a column of hot gas and pyroclasts up to a maximum height of 39 km in the atmosphere (Holasek et al., 1996). We consider here the transitional phase C1 of this eruptive event, characterized by the formation of a partially stable column occasionally producing pyroclastic density cur-rents (Koyaguchi & Ohno, 2001). The MDR and exit velocity of this phase are estimated to be 1.5 × 10⁹kg s−1
and 275 m s−1, respectively (Costa et al., 2016), and the wind profile retrieved from NCEP/NCAR Reanalysis
1 data by Mastin (2014) shows a linear profile with a maximum wind speed of ≈22 m s−1. For such
super-sonic velocity at the vent, decompression effects involving shock waves and transient dynamics of turbulent eddies affect the efficiency of air entrainment (Carcano et al., 2013). Suzuki and Koyaguchi (2010) showed that our model does not reproduce the fine variation of the entrainment coefficient𝛼 near the vent, but the impact on the jet dynamics is relatively limited as the fraction of entrained air near the vent is very small com-pared to the MDR. Using these estimated values and considering an uncertainty of a factor of 2 for the MDR (see Michaud-Dubuy et al., 2018 for discussion) allow us to calculate the w/log10(MDR) ratio for the C1
6. Conclusion
We presented a theoretical model of a volcanic plume to identify an analytical criterion for the collapse of explosive volcanic eruptions. Our results highlight the importance of the source Richardson number on column collapse in the absence of wind, and of the wind-to-plume velocity ratio and wind entrainment coefficient𝛽 in the presence of wind. In order to better constrain the value of 𝛽, we presented new labo-ratory experiments simulating turbulent jets with reversing buoyancy rising in a windy environment. The results on plume/fountain transition and jet trajectory show that the entrainment coefficient due to wind is𝛽 = 0.5, provided that 𝛼 varies as in Kaminski et al. (2005). We then parameterized the 1-D model PPM (Michaud-Dubuy et al., 2018) with this value of𝛽 and performed a sensitivity analysis of the predictions of column collapse. We showed for the first time the importance of the wind gradient for the stability of vol-canic columns, as the chosen wind profile has a strong impact on the overall dynamics of the plume. We then confronted our model to a well-constrained historical eruption: the 1991 Mt. Hudson event. We showed that the model captures accurately the behavior and maximum column height of the plume when using𝛽 = 0.5, constrained by our laboratory experiments. Finally, we propose a new regime diagram for column collapse in case of wind requiring information only about the mass discharge rate of the eruption and the maximum wind speed measured during the eruptive event. Comparing this regime diagram with field data from the 1991 Mt. Pinatubo eruption suggests that winds had a nonnegligible impact on turbulent entrainment and mixing during this event.
This study highlights the necessity of considering a realistic wind profile in theoretical models in order to be able to correctly predict the behavior of a volcanic column, and thus opens a new perspective on the strong importance of winds at every stage of an eruption from the inner column dynamics to the dispersion of volcanic products in the atmosphere. These two aspects are crucial for volcanic hazard assessment.
Appendix A: PPM—A Model of Explosive Volcanic Plumes
We implement the model of Michaud-Dubuy et al. (2018) using a “top-hat” formalism in a plume-centered coordinate system. The conservation laws of mass, axial and radial momentum, and energy fluxes are given by (Bursik, 2001; Girault et al., 2016):
d ds ( 𝜌ur2)=2𝜌 arue− N𝛷 ∑ 𝜙=1 pQ𝜙 r · V𝜙 u, (A1) d ds ( 𝜌u2r2)=(𝜌 a−𝜌 ) gr2sin𝜃 + w cos 𝜃d ds ( 𝜌ur2)−u N𝛷 ∑ 𝜙=1 pQ𝜙 r · V𝜙 u, (A2) ( 𝜌u2r2) d𝜃 ds = ( 𝜌a−𝜌 ) gr2cos𝜃 − w sin 𝜃d ds ( 𝜌ur2), (A3) d ds ( 𝜌cpTur2 ) =2𝜌acaTarue−𝜌agur2sin𝜃 − c pT N𝜙 ∑ 𝛷=1 pQ𝜙 r · V𝜙 u , (A4)
where𝜋Q𝜙is the mass flux of𝜙-sized particles, p = 0.27 is a probability of sedimentation, V𝜙is the terminal fall velocity corresponding to the size of particles, and caand cpare the specific heat of the atmosphere and
the mixture, respectively. The rate of turbulent entrainment is calculated using Equation 1 together with
𝛽 = 0.5 and 𝛼 such as (Kaminski et al., 2005):
𝛼 = 0.0675 +(1 − 1
A
)
Ri, (A5)
where Ri = g(𝜌a−𝜌)r∕𝜌au2is the local Richardson number and A is a dimensionless parameter that depends
on the flow structure (see Appendix A of Michaud-Dubuy et al., 2018 for more details).
Constitutive equations for the evolution of the thermodynamic properties of the column with altitude include Equations 2 and 4, and (Woods, 1988):
cp=ca+ ( cp0−ca )(1 − xg 1 − xg0 ) , (A6)
where the subscript0refers to initial values of the variables at the vent. The terminal fall velocity is calculated using:
V𝜙= ⎧ ⎪ ⎪ ⎨ ⎪ ⎪ ⎩ [3.1gd 𝜙Δ𝜌 𝜌a ]1∕2 for Rep≥ 500, d𝜙[225g2Δ𝜇𝜌𝜌2 a ]1∕3 for 0.4 ≤ Rep≤ 500, [ d2 𝜙gΔ𝜌 18𝜇 ] for Rep≤ 0.4. (A7)
where Δ𝜌 =(𝜌p−𝜌), Rep=𝜌d𝜙V𝜙∕𝜇 is the particle Reynolds number, d𝜙is the particle diameter,𝜇 is the dynamic viscosity of air, and𝜌pis the particle density.
The total grain-size distribution is described by a power-law distribution (Girault et al., 2014):
N(Rp≥ rp) =𝜆rp−D, (A8)
where N(Rp≥ rp) is the number of fragments of size Rp larger than or equal to rp,𝜆 is a normalization constant, and D is the power-law exponent. The latter is used to calculate the amount of gas exsolved and trapped in large particles, which we use together with the open porosity to calculate the effective amount of gas in the turbulent jet at the vent (see Michaud-Dubuy et al., 2018 for calculation details). Here we use in all simulations a power-law exponent D = 3.3, and an open porosity of 65%.
Data Availability Statement
Experimental data are provided in the supporting information and in open access online (https://doi.org/ 10.6084/m9.figshare.12902393.v1).
References
Aubry, T., Carazzo, G., & Jellinek, A. (2017). Turbulent entrainment into volcanic plumes: New constraints from laboratory experiments on buoyant jets rising in a stratified crossflow. Geophysical Research Letters, 44, 10,198–10,207. https://doi.org/10.1002/2017GL075069 Aubry, T., & Jellinek, A. (2018). New insights on entrainment and condensation in volcanic plumes: Constraints from independent
observations of explosive eruptions and implications for assessing their impacts. Earth and Planetary Science Letters, 490, 132–142. https://doi.org/10.1016/j.epsl.2018.03.028
Aubry, T., Jellinek, A., Carazzo, G., Gallo, R., Hatcher, K., & Dunning, J. (2017). A new analytical scaling for turbulent wind-bent plumes: Comparison of scaling laws with analog experiments and a new database of eruptive conditions for predicting the height of volcanic plumes. Journal of Volcanology and Geothermal Research, 343, 233–251.
Bonadonna, C., & Phillips, J. (2003). Sedimentation from strong volcanic plumes. Journal of Geophysical Research, 108(B7), 2340. https:// doi.org/10.1029/2002JB002034
Burgisser, A., Bergantz, G. W., & Breidenthal, R. E. (2005). Addressing complexity in laboratory experiments: The scaling of dilute multiphase flows in magmatic systems. Journal of Volcanology and Geothermal Research, 141, 245–265.
Bursik, M. (2001). Effect of wind on the rise height of volcanic plumes. Geophysical Research Letters, 28, 3621–3624.
Carazzo, G., Girault, F., Aubry, T., Bouquerel, H., & Kaminski, E. (2014). Laboratory experiments of forced plumes in a density-stratified crossflow and implications for volcanic plumes. Geophysical Research Letters, 41, 8759–8766. https://doi.org/10.1002/2014GL061887 Carazzo, G., & Jellinek, A. M. (2012). A new view of the dynamics, stability and longevity of volcanic clouds. Earth and Planetary Science
Letters, 325-326, 39–51.
Carazzo, G., Kaminski, E., & Tait, S. (2008a). On the dynamics of volcanic columns: A comparison of field data with a new model of negatively buoyant jets. Journal of Volcanology and Geothermal Research, 178, 94–103. https://doi.org/10.1016/j.jvolgeores.2008.01.002
Acknowledgments
The authors warmly thank E. Rossi and T. Esposti Ongaro, and the editor, S. Parman, for their constructive comments which greatly improved the original version of this manuscript. We thank H. Bouquerel, A. Limare, T. Rivet, and A. Souilah for technical support and A. Pennacchioni and A. Sarelli for helping with preliminary experiments. This work was partially funded by the RAVEX Project (ANR contract ANR-16-CE03-0002), the STRAP Project (ANR contract ANR-14-CE03-0004) and is part of A. Michaud-Dubuy's PhD thesis. This study contributes to the IdEx project “Université de Paris” (ANR-18-IDEX-0001).
Degruyter, W., & Bonadonna, C. (2013). Impact of wind on the condition for column collapse of volcanic plumes. Earth and Planetary
Science Letters, 377–378, 218–226. https://doi.org/10.1016/j.epsl.2013.06.041
Devenish, B., Rooney, G., Webster, H., & Thomson, D. (2010). The entrainment rate for buoyant plumes in a crossflow. Boundary-Layer
Meteorology, 134, 411–439.
Esposti Ongaro, T., Neri, A., Menconi, G., de'Michieli Vitturi, M., Marianelli, P., Cavazzoni, C., et al. (2008). Transient 3D numerical simulations of column collapse and pyroclastic density current scenarios at Vesuvius. Journal of Volcanology and Geothermal Research,
178(3), 378–396. https://doi.org/10.1016/j.jvolgeores.2008.06.036
Fan, L. N. (1967). Turbulent buoyant jets into stratified or flowing ambient fluids (KH-R-15). Pasadena, CA, USA: W.M. Keck Laboratory of Hydrology and Water Resources, California Institute of Technology.
Girault, F., Carazzo, G., Tait, S., Ferrucci, F., & Kaminski, E. (2014). The effect of total grain-size distribution on the dynamics of turbulent volcanic plumes. Earth and Planetary Science Letters, 394, 124–134. https://doi.org/10.1016/j.epsl.2014.03.021 Girault, F., Carazzo, G., Tait, S., & Kaminski, E. (2016). Combined effects of total grain-size distribution and crosswind on the rise of
eruptive volcanic columns. Journal of Volcanology and Geothermal Research, 326, 103–113. https://doi.org/10.1016/j.jvolgeores.2015. 11.007
Hedin, A., Fleming, E., Manson, A., Schmidlin, F., Avery, S., Clark, R., et al. (1996). Empirical wind model for the upper, middle and lower atmosphere. Journal of Atmospheric and Solar-Terrestrial Physics, 58(13), 1421–1447.
Hewett, T., Fay, J., & Hoult, D. (1971). Laboratory experiments of smokestack plumes in a stable atmosphere. Atmospheric Environment,
5, 459–461.
Ho, C. M., & Huerre, P. (1984). Perturbed free shear layers. Annual Review of Fluid Mechanics, 16, 365–424.
Holasek, R., Self, S., & Woods, A. (1996). Satellite observations and interpretation of the 1991 Mount Pinatubo eruption plumes. Journal
of Geophysical Research, 101, 27,635–27,655.
Hoult, D. P., Fay, J. A., & Forney, L. J. (1969). A theory of plume rise compared with field observations. Journal of the Air Pollution Control
Association, 19, 585–590.
Hoult, D. P., & Weil, J. C. (1972). Turbulent plume in a laminar cross flow. Atmospheric Environment, 6, 513–531. Huq, P. (1997). Observations of jets in density stratified crossflows. Atmospheric Environment, 31, 2011–2022.
Kaminski, E., & Jaupart, C. (2001). Marginal stability of atmospheric eruption columns and pyroclastic flow generation. Journal of
Geophysical Research, 106(B10), 21,785–21,798.
Kaminski, E., Tait, S., & Carazzo, G. (2005). Turbulent entrainment in jets with arbitrary buoyancy. Journal of Fluid Mechanics, 526, 361–376.
Kieffer, S. W., & Sturtevant, B. (1984). Laboratory studies of volcanic jets. Journal of Geophysical Research, 89(B10), 8253–8268. Koyaguchi, T., & Ohno, M. (2001). Reconstruction of eruption column dynamics on the basis of grain size of tephra fall deposits. 2.
Application to the Pinatubo 1991 eruption. Journal of Geophysical Research, 106, 6513–6533.
Kratzmann, D., Carey, S., Scasso, R., & Naranjo, J. A. (2009). Compositional variations and magma mixing in the 1991 eruptions of Hudson volcano, Chile. Bulletin of Volcanology, 71, 419–439.
Mastin, L. G. (2014). Testing the accuracy of a 1-D volcanic plume model in estimating mass eruption rate. Journal of Geophysical
Research: Solid Earth, 119, 2474–2495. https://doi.org/10.1002/2013JD020604
Mastin, L. G., Guffanti, M., Servranckx, R., Webley, P., Barsotti, S., Dean, K., et al. (2009). A multidisciplinary effort to assign realistic source parameters to models of volcanic ash-cloud transport and dispersion during eruptions. Journal of Volcanology and Geothermal
Research, 186, 10–21.
Medici, E., Allen, J., & Waite, G. (2014). Modeling shock waves generated by explosive volcanic eruptions. Geophysical Research Letters,
41, 414–421. https://doi.org/10.1002/2013GL058340
Michaud-Dubuy, A., Carazzo, G., Kaminski, E., & Girault, F. (2018). A revisit of the role of gas entrapment on the stability conditions of explosive volcanic columns. Journal of Volcanology and Geothermal Research, 357, 349–361. https://doi.org/10.1016/j.jvolgeores.2018. 05.005
Michaud-Dubuy, A., Carazzo, G., Tait, S., Le Hir, G., Fluteau, F., & Kaminski, E. (2019). Impact of wind direction variability on hazard assessment in Martinique (Lesser Antilles): The example of the 13.5 ka cal BP Bellefontaine Plinian eruption of Mount Pelée volcano.
Journal of Volcanology and Geothermal Research, 381, 193–208. https://doi.org/10.1016/j.jvolgeores.2019.06.004
Morton, B., Taylor, G., & Turner, J. (1956). Turbulent gravitational convection from maintained and instantaneous sources. Philosophical
Transactions of the Royal Society A, 234, 1–23.
Neri, A., & Dobran, F. (1994). Influence of eruption parameters on the thermofluid dynamics of collapsing volcanic columns. Journal of
Geophysical Research, 99(B6), 11,833–11,857. https://doi.org/10.1029/94JB00471
Roche, O., & Carazzo, G. (2019). The contribution of experimental volcanology to the study of the physics of eruptive processes, and related scaling issues: A review. Journal of Volcanology and Geothermal Research, 384, 103–150.
Scasso, R., Corbella, H., & Tiberi, P. (1994). Sedimentological analysis of the tephra from the 12-15 August 1991 eruption of Hudson volcano. Bulletin of Volcanology, 56, 121–132.
Sparks, R. S. J. (1986). The dimensions and dynamics of volcanic eruption columns. Bulletin of Volcanology, 48, 3–15. https://doi.org/10. 1007/BF01073509
Sparks, R. S. J., & Wilson, L. (1976). A model for the formation of ignimbrite by gravitational column collapse. Journal of the Geological
Society, 132, 441–451. https://doi.org/10.1144/gsjgs.132.4.0441
Suzuki, Y. J., & Koyaguchi, T. (2010). Numerical determination of the efficiency of entrainment in volcanic eruption columns.
Geophysical Research Letters, 37, L05302. https://doi.org/10.1029/2009GL042159
Suzuki, Y. J., & Koyaguchi, T. (2015). Effects of wind on entrainment in volcanic plumes. Journal of Geophysical Research: Solid Earth,
120, 6122–6140. https://doi.org/10.1002/2015JB012208
Suzuki, Y. J., Koyaguchi, T., Ogawa, M., & Hachisu, I. (2005). A numerical study of turbulent mixing in eruption clouds using a three-dimensional fluid dynamics model. Journal of Geophysical Research, 110, B08201. https://doi.org/10.1029/2004JB003460 Turner, J. S. (1979). Buoyancy effects in fluids: Cambridge University Press.
Valentine, G. A., & Wohletz, K. H. (1989). Numerical models of Plinian eruption columns and pyroclastic flows. Journal of Geophysical
Research, 94(B2), 1867–1887.
Wilson, L. (1976). Explosive volcanic eruptions: III. Plinian eruption columns. Journal of the Royal Astronomical Society of Canada, 45, 543–556.
Woodhouse, M. J., Hogg, A. J., Phillips, J. C., & Sparks, R. S. J. (2013). Interaction between volcanic plumes and wind during the 2010 Eyjafjallajökull eruption, Iceland. Journal of Geophysical Research: Solid Earth, 118, 92–109. https://doi.org/10.1029/2012JB009592 Woods, A. W. (1988). The fluid dynamics and thermodynamics of eruption columns. Bulletin of Volcanology, 50, 169–193.
Woods, A. W. (1995). The dynamics of explosive volcanic eruptions. Reviews of Geophysics, 33, 495–530.
Woods, A. W., & Caulfield, C. P. (1992). A laboratory study of explosive volcanic eruptions. Journal of Geophysical Research, 97(B5), 6699–6712.
Yang, W. C., & Hwang, R. R. (2001). Vertical buoyant jets in a linearly stratified ambient cross-stream. Environmental Fluid Mechanics, 1, 235–256.