DESIGN OF A PERCOLATION REACTOR
by Perla Issa
B. Eng. Mechanical Engineering (1997) McGill University
Submitted to the Department of Mechanical Engineering In Partial Fulfillment of the Requirements for the Degree of
Master of Science in Mechanical Engineering at the
Massachusetts Institute of Technology February 2000
© 2000 Massachusetts Institute of Technology All rights reserved
Signature of Author...
Department of Mechanical Engineering December 17, 1999
C ertified by...
Mehmet Toner Associate Professor Harvard-MIT Division of Health Science and Technology Thesis Supervisor
A ccepted by ...
Ain A. Sonin Chairman, Department Committee on Graduate Students
MASSACHUSETTS INSTITUTE OF TECHNOLOGY
DESIGN OF A PERCOLATION REACTOR
by Perla Issa
Submitted to the Department of Mechanical Engineering on December 17, 1999 in Partial Fulfillment of the Requirements for the Degree of Master of Science in
Mechanical Engineering ABSTRACT
Liver failure is a major cause of mortality. A Bioartificial Liver (BAL) device employing isolated hepatocytes can potentially provide temporary support for liver failure patients. We have designed and manufactured a small-scale BAL device that attempts to mimic some of the elements of the flow conditions observed in the liver by creating a well-defined 3D porous matrix. The proposed reactor consists of perforated discs stacked on top of each other. The holes of two consecutive discs are misaligned in a specific manner to create a similar fluid flow configuration as the one seen in the liver. The advantages of such a design are numerous: high flow rates can be achieved while
still minimizing the local shear stress levels, cells are cultured on a flat-plate as seen in the liver, and all cells are directly exposed to flow in order to supply oxygen and
nutrients. Two prototypes of the proposed reactor were manufactured with two different disc spacing: 565 gm and 127 pm. The perforated discs were produced by injection-molding and their biocompatibility demonstrated using hepatocyte cultures under static conditions (i.e. no flow). A theoretical analysis of the fluid flow conditions was
developed using porous media theory. The reactors (without cells) were then operated over a wide range of flow rates to experimentally characterize the fluid flow conditions. The flow was shown to be uniformly distributed across the reactor and the shear stress values were minimal (0.028 dyne/cm2 to 0.18 dyne/cm2 for flow rates ranging from 2 ml/min to 12 ml/min). The reactor was also tested with hepatocytes for two different flow rates: 0.2 ml/min and 0.5 ml/min. The final percentage of attached cells ranged from 98% to 76% and their associated viability ranged between 87% and 78%. The results indicate that the cells adequately sustain attachment and viability in the percolation reactor under the flow conditions tested in this study. Finally, it is worth noting that further
optimization of the percolation structure is needed to increase the performance of the reactor substantially.
Thesis Supervisor: Mehmet Toner Title: Associate Professor
Center for Engineering in Medicine
Massachusetts General Hospital and Harvard Medical School
ACKNOWLEDGEMENTS
I would like to express my gratitude to Professor Mehmet Toner for his expert guidance and insightful discussions. As well, I am grateful for his continued
encouragement throughout the course of this project. Furthermore, I would like to thank Albert Folch for his knowledgeable advice and assistance.
Special thanks is extended to Arno Tilles, Junji Washizu, George Pins, and Ul Balis for their most valuable help, time and suggestions.
The completion of this project would not have been possible without the patience and attention I received from certain people. I would like to offer special thanks to everyone in the lab that has helped me in some way: Pat Walton and Kyongbun Lee for their patience and assistance in the computer lab, Octavio Hurtado for his help in the microfabrication facility, Jeanne Classen, Bharath Dwarakanath, William Jastromb, Annette McDonald, and Molly Williams for their support of the tissue culture facility, Bob Crowther and Ali Eroglu for their help in microscopy, and finally Linda Huffer and Lynne Stubblefield for handling all administrative issues. What I came to find in Boston extended beyond any of my expectations. I developed friendships that will last a lifetime. Thank you all for making this experience such a memorable one.
Finally I would like to thank my family for their constant encouragement, support and understanding throughout my graduate years.
Financial support was provided by the Harvard-MIT Division of Health Science and Technology, Shriners Hospital for Children, Fonds pour la Formation des Chercheur et l'Aide a la Recherche (FCAR) of the government of Quebec, and finally Mom and Dad.
ABSTRACT
2
ACKNOWLEDGMENTS
3
TABLE OF CONTENT
4
LIST OF FIGURES
6
LIST OF TABLES
8
NOMENCLATURE
9
CHAPTER
1
INTRODUCTION
11
1.1. LIVER FAILURE AND BIOARTIFICIAL LIVER DEVICES 11
1.2. LIVER GEOMETRY 12
1.2.1. Organization of the liver 12
1.2.2. Blood supply 15
1.2.3. The liver acinus as a porous bed of hepatocytes 15
1.3. THE OVERALL GOAL OF THIS STUDY 16
REFERENCES 19
CHAPTER 2
DESIGN AND MANUFACTURE OF THE
PERCOLATION REACTOR
20
2.1. INJECTION-MOLDING 20
2.2. MOLD MAKING 21
2.3. DESIGN OF THE REACTOR BODY 25
CHAPTER 3
MATERIALS AND METHODS
28
3.1. BIOCOMPATIBILITY STUDIES 28
3.1.1. Cell culture 28
3.1.2. Attachment experiments 28
3.1.3. Functional assay 30
3.2. EXPERIMENTAL FLOW CHARACTERIZATION OF THE REACTOR 30
3.2.1. Flow circuit 30
3.2.2. Fluid flow characterization 31
Fluid flow uniformity across the reactor 31
Velocity profile and shear stress experiments 33 3.2.3. Experimental characterization of the reactor with cells 34
REFERENCES 35
CHAPTER 4
FLUID FLOW ANALYSIS
36
4.1. PERCOLATION REACTOR PROPERTIES 36
4.1.2. Specific surface 37
4.1.3 Tortuosity 37
4.1.4 Permeability 38
4.2. FLUID FLOW ANALYSIS 38
4.2.1. Flow conditions 38
4.2.2. Pressure drop estimation: Navier Stokes equation 39
4.2.3. Pressure drop estimation: Darcy's Law 41
4.2.4. Shear stress estimation 42
REFERENCES 43
CHAPTER
5
MODEL PREDICTIONS AND EXPERIMENTAL
CHARACTERIZATION
44
5.1. BIOCOMPATIBILITY STUDIES UNDER STATIC CULTURES 44
5.1.1. Cell attachment studies 44
5.1.2. Albumin secretion 46
5.2. THEORETICAL FLUID FLOW ANALYSIS 47
5.2.1. Percolation reactor properties 47
5.2.2. Flow conditions 48
5.2.3.Pressure drop estimation: Navier Stokes equation 48
5.2.4. Pressure drop estimation: Darcy's law 49
5.2.5. Shear stress estimation 50
5.3. EXPERIMENTAL CHARACTERIZATION OF THE FLUID FLOW 52
5.3.1. Fluid flow uniformity across the reactor 52
5.3.2. Velocity profile and shear stress experiments 55
5.3.3. Experimental characterization of the reactor with cells 62
REFERENCES 64
CHAPTER 6
DISCUSSION AND OUTLOOK
65
CONCLUSION AND OUTLOOK 69
LIST OF FIGURES
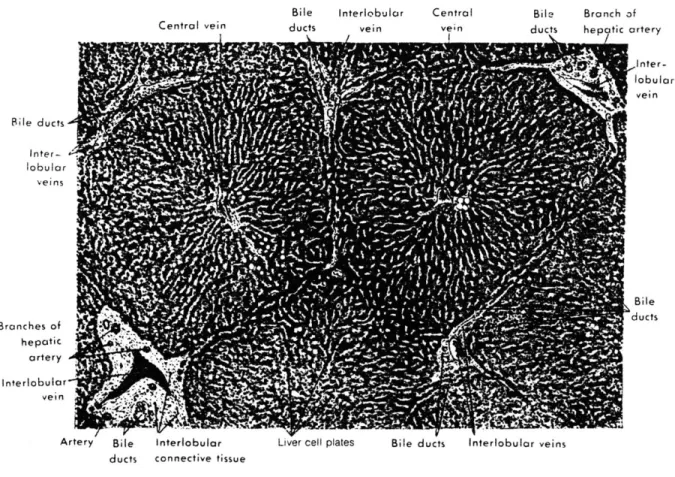
Figure 1.1: Portion of a histological section showing the radiating cell plates in
two classical lobules and the portal areas. 13
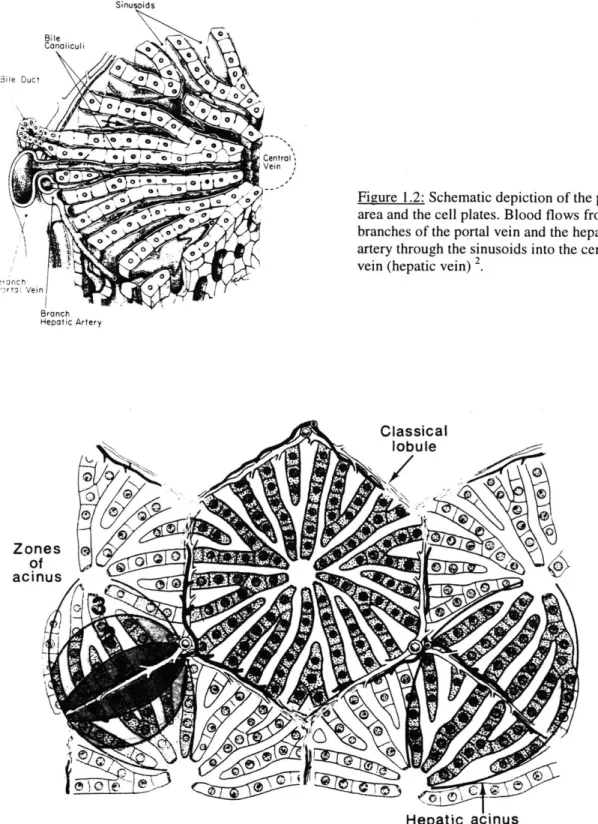
Figure 1.2: Schematic depiction of the portal area and the cell plates. Blood flows from branches of the portal vein and the hepatic artery through the
sinusoids into the central vein (hepatic vein). 14
Figure 1.3: Schematic representation of the classical lobule and the ellipsoidal acinus. At the left the three zones of the hepatic acinus are designated. 14 Figure 1.4: Hole pattern on perforated discs. Solid lines represent holes on the upper disc while dashed lines represent holes on the lower disc. 17 Figure 2.1: Mold template. Dark area indicates posts. Scale 1:0.73 22 Figure 2.2: Picture of the aluminum mold producing the perforated discs.
Rhomboidal posts can be seen in the middle as well as the polished surface
underneath. Scale 1:1.2 23
Figure 2.3: Picture of the aluminum ring lifting a transparent perforated disc,
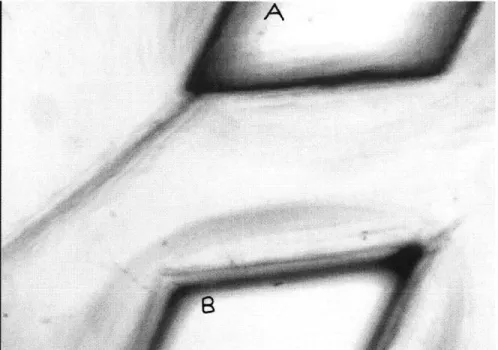
as a result of tightening four screws. Scale 1:0.93 24 Figure 2.4: Picture of five different perforated discs. Scale 1:1.5 24 Figure 2.5: Picture of assembled percolation reactor. Scale 1:1.125 27 Figure 2.6: Picture depicting the bottom of the reactor. Scale 1:1.8 27 Figure 2.7: Picture depicting the top of the reactor. Scale 1:1.8 27 Figure 3.1: Microscope view at 4x magnification. A portion of a hole in the
upper disc (A) and a portion of another hole (B) on a disc 565 pm below are
shown. 32
Figure 4.1: Flow regions in porous medium characterized by the modified Reynolds number, Rem. Remc is the critical value at which the flow transits
from Darcy's regime to Forcheimer's. 41
Figure 5.1: Kinetics of hepatocyte attachment. Comparison between tissue culture polystyrene dishes (TCPS) with plasma-treated and untreated discs. Error bars represent the standard deviation of five different measurements. 45 Figure 5.2: Albumin production of hepatocytes cultured with fibroblasts using
Figure 5.3: Schematic representation of an outlet hole with three corresponding inlet holes. Solid lines represent holes on the upper disc while dashed lines
represent holes on the lower disc. 52
Figure 5.4: Average velocity per outlet as a function of radial position for
the reactor with 565gm disc spacing. A) Qtotai = 8.8ml/min,
B) Qtotai = 13ml/min, C) Qtotail=16.1ml/min 54
Figure 5.5: Average velocity per outlet as a function of radial position for the
reactor with 127gm disc spacing. Qtotai = 2ml/min,. 55
Figure 5.6: Fluid velocity profile between two percolating discs separated by a spacing of 565 gm with a total fluid flow rate of
A) 7.8ml/min, V(y) = -13.2y3 + 0.6y2 + 4y + 0.04,
B) 12.5 ml/min V(y) = 82.6y3 - 101.7y2 + 34.4y - 1.6. Error bars represent
the standard deviation of five different measurements. 56
Figure 5.7: Comparison between theoretical and experimental fluid flow rates
for a disc spacing of 565 gm. 58
Figure 5.8: Fluid velocity profile between two percolating discs separated by 127 pm. A) Qtotai = 6.82ml/min, V(y) = -19252y3 + 2804.8y2 - 45.7y +
0.3, B) Qtotai = 2.3ml/min, V(y) = 5876.3y3 + 811.2y
2 - 7.7y + 0.08.
Error bars represent the standard deviation of five different measurements. 59
Figure 5.9: Comparison between theoretical and experimental fluid flow rates for
a disc spacing of 127 pm. 60
Figure 5.10: Experimental and theoretical wall shear stress as function of
LIST OF TABLES
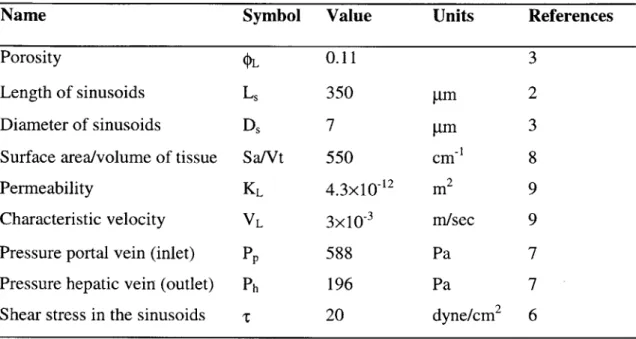
Table 1.1: Physiological parameters of the liver. 16
Table 5.1: Percolation reactor properties. 47
Table 5.2: Estimated pressure drop and Rem for the percolation reactor. 49 Table 5.3: Pressure drop according to Darcy's law for different flow rates. 50
Table 5.4: Shear stress estimations for different flow rates. 51 Table 5.5: Comparison between the parallel-plate reactor and the percolation
reactor when subjected to a flow rate of 0.2 ml/min and 0.5 ml/min. The percentage of the remaining attached cells at the end of the experiment and
NOMENCLATURE
a: hole side length (1.154x 1 03m)
Ahole: hole cross-sectional area (1.154x10- m2)
Adisc: disc cross-sectional area (2027x10-6m2)
Di,: horizontal distance between an outlet and an inlet hole on two consecutive discs (2.66x 10⁻³m)
Hs: Spacer height (565gm, 127gm)
ISAP: Interstitial surface area of pores (M2)
K: permeability (m2
)
if: flow path length (m)
lu: unit length (m)
nh: number of holes per disc (50 holes)
qtotal: cross-sectional average, axial velocity (m/sec)
qest: pump flow rate divided the number of holes (mm3/sec)
qmeas: experimentally measured flow rate through one hole (mm3/sec)
Q:
fluid flow rate (m3/sec)R: disc radius (25.4x10³im) Sd: surface area of disc (m2
) Sh: surface area of holes (M2) S,: surface area of spacer (m2
) td: disc thickness (I.1x10-3 )
T: tortuosity
THA: Terminal hepatic arteriole TPV: terminal portal venule
V(y): best curve-fit to the velocity profile obtained experimentally Vp: Volume of pores (M3)
V: Total volume of unit (m3)
y: vertical distance starting from the bottom disc in the reactor
E: porosity
g: dynamic fluid viscosity (10-3kg/msec)
CHAPTER 1
INTRODUCTION
1.1. LIVER FAILURE AND BIOARTIFICIAL LIVER DEVICES
Each year approximately 30,000 individuals develop severe hepatic failure. Less than 3,000 of these patients will undergo orthotopic liver transplantation, the only
available method for the clinical management of severe hepatic failure13. For the patients who are not selected for transplantation there is no adequate treatment available and it is estimated that 375 prospective recipients die each year while waiting for a transplant. Those suffering from cirrhosis fight the seventh leading cause of death in the USA and those suffering from acute liver failure face a mortality greater than 80% 1. The livers of acute liver failure patients undergo a regenerative process. Stabilization of these patients during this regenerative period with an extracorporeal device, would allow liver
regeneration and circumvent the need for transplantation. An extracorporeal device consists of an enclosed casing containing functioning mammalian hepatocytes subjected to fluid flow. The fluid is either culture medium, blood or plasma. An extracorporeal device could also be used as a useful bridge-to-transplantation for potential transplant recipients. Furthermore, 25% of liver transplant recipients undergo post-surgical
complications and require a second surgical procedure, these patients are also candidates for an extracorporeal device.
Presently Bioartificial Liver assist (BAL) devices used in clinical trials are based on hollow-fiber designs. These bioreactors contain bundles of small-diameter fibers enclosed in a rigid housing. The fibers are porous allowing the passage of molecules.
Cells are inoculated in the extrafiber space while the appropriate fluid is pumped through the fiber lumen7. There are two important shortcomings to hollow-fiber based liver devices. In hollow fiber reactors only a small fraction of packed multilayered cells are in direct contact with fibers, thereby the majority of cells experience oxygen limitation. It is also noteworthy that hepatocytes in liver are organized in a planar like geometry in sinusoids, and not as packed cylinders as in the hollow fiber devices. This issue is further described in the next section.
1.2. LIVER GEOMETRY
The liver is the largest gland in the body and is situated in the upper abdominal cavity. The liver has multiple functions essential to maintain life including carbohydrate metabolism, synthesis of proteins, amino acid metabolism, urea synthesis, lipid
metabolism, drug biotransformation, and waste removal.
1.2.1. Organization of the liver
The internal architecture of the liver consists of repeating pattern of hexagonal areas in which plates of cells are arranged radially around a central vein (see figure 1.1). At three corners of these polygonal areas there is a small triangular area of connective tissue enclosing a small bile duct, a branch of the hepatic artery (the terminal hepatic arteriole, THA), and a branch of the portal vein (the terminal portal venule, TPV). This complex is referred to as the portal area (see figure 1.2). Blood enters the unit via the THA and the TPV, exchanges solutes with the cells and exits via the Terminal Hepatic
Venule (THV) into the central vein. This polygonal unit, about 700 pm in diameter and 2mm long, is called the classical lobule 2 (see figure 1.3).
More recent investigations defined the hepatic acinus as the structural and
functional unit of the liver . It is irregular in size and shape and lies between two central veins (see figure 1.3). Blood enters the unit through lateral branches of the portal vein and the hepatic artery and exits via the central vein. The liver acinus is divided into zone 1, 2 and 3 according to the quality of portal blood 4 (see figure 1.3). The cells in zone 1 have first access to the incoming oxygen and nutrients. The cells of zone 2 receive processed blood from zone 1 and those of zone 3 receive blood after being processed in zone 1 and 2. Bile Interlobular ducts vein Central vein Bile Branch of ducts hepatic artery
nter-lobular vein Bile ducts Inter-lobular veins Branches of hepatic-artery Interlobular vein
Artery Bile Interlobular L ducts connective tissue
I
iver cell plates Bile
I
U
Bile
ducts
ducts Interlobular veins
Figure 1.1: Portion of a histological section showing the radiating cell plates in two classical lobules and the portal areas ".
Central vein t4 A
r
W ie
t %,6 OIAq jl 0.4, /, 3' Oft -; , 41 -k4 4. j A or ; 7\ -Z t 7 r IP-:J iillfiSinusoids HenaticuAe 00 3ile Duct 0 0~ 0 arto Vein -rOnch Hepatic Artery
Figure 1.2: Schematic depiction of the portal area and the cell plates. Blood flows from branches of the portal vein and the hepatic artery through the sinusoids into the central vein (hepatic vein) 2
Classical lobule Zones of- acinus--Hepatic acinus
Figure 1.3: Schematic representation of the classical lobule and the ellipsoidal acinus. At the left the three zones of the hepatic acinus are designated2.
1.2.2. Blood supply
The liver is situated between the portal vascular system and the general
circulation. It receives well-oxygenated blood (13-14ml/dl during the fasting state)' from the general circulation via the hepatic artery, which represents 25% of the total liver flow. The remaining 75% is supplied by the portal vein which carries poorly oxygenated blood
(4-5ml/dl during the fasting state)' that has already circulated through the intestines, the pancreas and the spleen 1. Blood from these two sources mix in the hepatic sinusoids
which form an elaborate three-dimensional network, presenting an enormous surface area
(550cm2
/cm3)7 for exchange of metabolite between the blood and the cells. Most cells in
the radially-arranged cellular plates are exposed on both sides to blood flowing through the sinusoids. Finally the blood leaves the sinusoids through numerous openings in the thin wall of the central vein.
1.2.3. The liver acinus as a porous bed of hepatocytes
In order to create a structure which properly imitates liver conditions, we need a more quantitative description of the liver acinus and its flow conditions. The fluid flow through the hepatic acinus is quite complex. From a global view, flow appears to be unidirectional occurring from the TPV and the THA through the sinusoids to the central vein. However, this is not the case at the microcirculatory level. Numerous branches and interconnections between sinusoids coupled with the irregular geometry of the acinus increases the complexity of the flow. Studies have also shown that richly interconnected channels form the sinusoids', indicating that fluid flow through the acinus traverses a tortuous path. From these observations, the liver acinus is often characterized as a porous
bed of hepatocytes 7 for analytical studies. Characteristic parameters of porous medium are obtained from previous investigations and their values are shown in table 1.1.
Name Porosit Length Diamel Surface Permea Charac Pressur Pressur Shear s
Table 1.1: Physiological parameters of the liver.
Symbol Value
y 0.11
of sinusoids Ls 350
er of sinusoids Ds 7
area/volume of tissue Sa/Vt 550
bility KL 4.3X10⁻¹²
teristic velocity VL 3x10⁻³
e portal vein (inlet) Pp 588 e hepatic vein (outlet) Ph 196 tress in the sinusoids t 20
Units gm gm cm-1 m2
m/sec
Pa Pa dyne/cm2 References 3 2 3 8 9 9 7 7 6Major differences are found between the hollow-fiber geometry and the liver. In in-vivo conditions hepatocytes are in a plate arrangement and not packed in layers inside fibers. The liver also possess multiple inlets and outlets which minimizes local shear stress while providing adequate oxygen and nutrient supply. Our goal is to create a new reactor to address some of these issues.
1.3. THE OVERALL GOAL OF THIS STUDY
The present study is an attempt to mimic some of the elements of the flow conditions observed in the liver by creating a well-defined 3D porous matrix. The proposed device consists of perforated circular discs stacked on top of each other. The
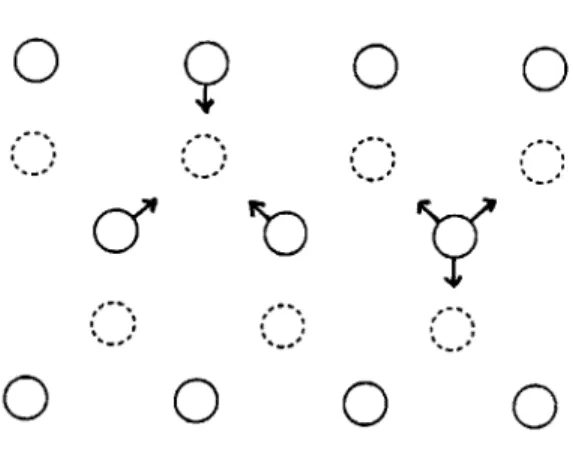
discs contain an array of holes in a hexagonal pattern. The holes of two consecutive discs are misaligned in a specific manner to create a percolating flow. A hexagonal pattern is chosen so that every outlet is supplied by three inlets and every inlet supplies three outlets (figure 1.4.). This geometry is selected to create a similar configuration seen in the liver: the central vein (the outlet) is supplied through the sinusoid by three portal areas (the inlets), and every portal area supplies three central veins. The hole size, the spacing between two holes and the spacing between two discs alter the flow of fluid through the device.
o
O
o
0 0 0Figure 1.4: Hole pattern on perforated discs. Solid lines represent holes on the upper disc while dashed lines represent holes on the lower disc.
The present study consists of designing, manufacturing and optimizing the percolation reactor. Chapter 2 describes the design and manufacture of the percolation reactor. The production of the perforated discs by injection molding and the manufacture of the outside casing are described in detail. Chapter 3 goes through the materials and methods of 1) the biocompatibility tests performed on the injected-molded surfaces using static cell cultures, 2) the experimental characterization of the fluid flow as well as the experimental comparison with a parallel-plate reactor. In chapter 4 the theoretical fluid
flow analysis using porous media theory is described, the percolation reactor properties, the flow regime, the pressure drop, and the shear stress are defined. Chapter 5 presents the model predictions and the experimental characterization. The biocompatibility studies results, the theoretical fluid flow predictions, and the experimental characterization of the bioreactor (with and without cells) are reported. Finally chapter 6 discusses the findings
REFERENCES
1. Arias, H. Popper, D. Schachter and D.A. Shafritz (Editors), The liver: Biology and Pathobiology, pp 916-920, Raven Press, New York (1983).
2. Fawcett, A textbook of Histology. 12th Edition, pp 652-657, Chapman & Hall, New York (1994).
3. Goresky, and B.E. Nadeau, Uptake of materials by the intact liver: the exchange of glucose across the cell membranes, J. Clin. Invest. 53, pp 634-646 (1974).
4. Gumucio, Functional and anatomic heterogeneity in the liver acinus: impact on transport, Am. J. Physiol. 244, pp G578-G582 (1983).
5. A. Kamlot, J. Roozga, F.D. Watanabe and A.A. Demetriou, Review: Artificial liver
support systems, Biotechnol. Bioeng. 50, pp 382-391 (1996).
6. Kan, H. Miyoshi, K. Yanagi, and N. Ohshima, Effects of shear stress on metabolic function of the co-culture system of hepatocyte/nonparenchymal cells for a
bioartificial liver, ASAIO J. 44, pp M441-M444 (1998).
7. Lee and B. Rubinsky, A multi-dimensional model of momentum and mass transfer in the liver, Int. J. Heat & Mass Transfer, 32, pp 2421-2434 (1989).
8. Miller, C.S. Zanolli and J.J. Gumucio, Quantitative morphology of the hepatic acinus,
Gastroent. 76, pp 965-969 (1979).
9. Nakata, C.F. Leong and R.W. Brauer, Direct measurement of blood pressures in minute vessels of the liver, Am. J. Physiol. 199, pp 1181-1188 (1960).
10. Popper, C.S. Davidson, C.M. Leevey and F. Schaffner, The social impact of the liver disease, N. Eng. J. Med. 281, pp 1455 (1969).
11. Rappaport, The microcirculatory hepatic unit, Microvasc. Res. 6, pp 212-228 (1973). 12. Sobotta, Atlas of Human Anatomy VOL II, G.E. Stechert & Co. New York (1936) 13. Trey, D.G. Burns and S.J. Saunders, Treatment of hepatic coma by exchange blood
CHAPTER 2
DESIGN AND MANUFACTURE OF THE
PERCOLATION REACTOR
The percolation reactor consists of perforated discs which are stacked on top of each other and enclosed in a casing. A hexagonal hole pattern is chosen so that every outlet is supplied by three inlets and every inlet is supplied by three outlets, as seen in the liver. The discs are produced by injection molding.
2.1. INJECTION MOLDING
The production of discs perforated by an array of holes presents a number of challenges. Reproducibility is essential, scaling-up should be straightforward and production time must be reasonable. Manually drilling holes was rejected because replication is difficult and time-consuming; instead, the injection molding option is selected. Injection molding is a process in which plastic is melted and injected at high pressure into a cavity. This cavity molds and contains the plastic until it solidifies into the desired shape. The injection molding machine used in the present study is a Morgan-Press G-IOOT (Morgan Industry, Long Beach, California), it is equipped with a preheat-plate, an injection speed controller and an anti-drool nozzle. The chosen material is polystyrene due to its widespread use in cell culture, excellent molding characteristics (high melt flow rate 13.3g/10min and low burn rate) and its transparent appearance. Polystyrene beads (Styron 615) are purchased from the Dow Chemical Company
(Cranbury, New Jersey). Drying the beads is essential, because any residual moisture absorbed by the beads causes the material to foam and affects part quality. To ensure complete drying, the material is spread in one inch layers in trays and placed in a vacuum oven for at least two hours at 80'C. Once ready, the material is fed into the top of the melt cylinder heated to 200'C, followed by a three-minute hold. The melted material is injected at a pressure of 7000 psi into a cold mold. Finally, the part is removed using an ejection system described in the next section.
2.2.
MOLD MAKING
For our device, we found the fabrication of the mold to be the most challenging part of the manufacturing step. The mold consists of "posts" whose height and diameter respectively correspond to the thickness of the disc and the diameter of the holes. Several techniques are considered such as 1) nickel plating, 2) chemical etching of metal and 3) conventional machining.
1) The first option is photolithography followed by nickel plating. The process consists of depositing a layer of photoresist on a silicon wafer, with a thickness equal to the desired disc thickness, exposing it to UV light through a mask, developing it, plating the exposed areas with nickel and finally removing the rest of the photoresist.
Unfortunately, this process had to be abandoned due to technical difficulties encountered while electroplating nickel.
2) The second alternative consists of chemically etching metal. In this process a sheet of metal is coated with photoresist, exposed to UV light with a mask and
with Fotofabrication (Chicago, Illinois) a stainless steel template is created by isotropic etching. Unfortunately, the etching process produces a rough surface which replicates into a rough translucent plastic surface unsuitable for microscopic phase-contrast examination
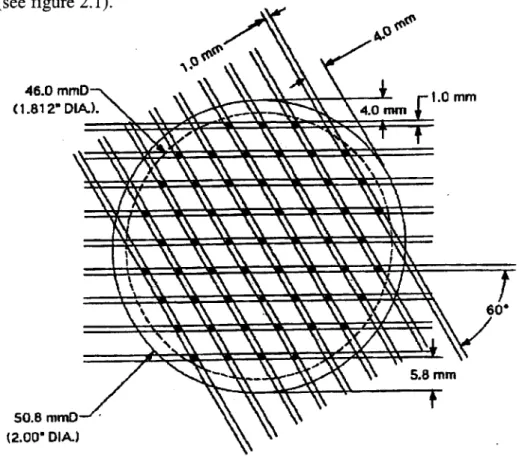
3) Finally, the molds were manufactured by conventional machining. First a two-inch aluminum cylinder is cut, then 1 mm deep and 4 mm wide straight cuts are made with a 1 mm spacing. The cylinder is then rotated by 60 degrees and the same cuts are made (see figure 2.1).
46.0 mmD 1.0 MM
(1.812" DIA) 4.0 mm
V % 60'
50.8 mmD-/ '\ (2.00" DIA.)
Figure 2.1: Mold template. Dark area indicates posts. Scale: 1:0.73
This process creates an array of 1 mm high rhomboidal posts with a 4 mm
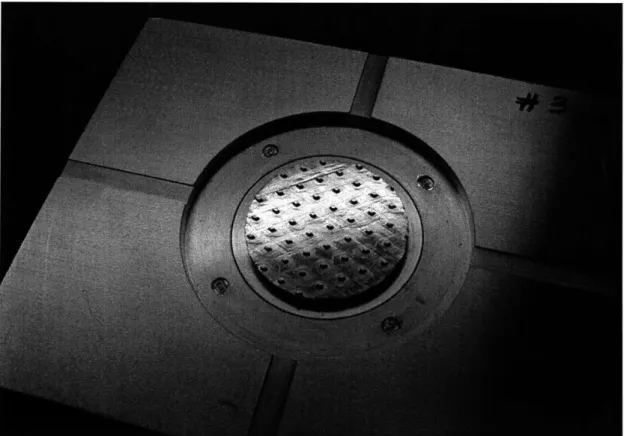
spacing. The mold is then manually polished with a lot of attention to the posts to create a mirror-finish surface (figure 2.2). The last step of mold making consists of integrating an ejection system that will release the plastic part from the mold. A removable aluminum
ring surrounds the cavity where the plastic part is situated. The inner side is underneath the part while the outer area has threaded holes in which screws are tightened allowing the ring to lift with the plastic part on top of it (see figure 2.3). A groove is created on the edge of the ring, which once filled with plastic creates a spacer integrated with the disc. Grooves of 565 pm deep and 127 pm deep and 500 pm wide are made. Figure 2.4 displays a series of perforated discs made with the above mold. As can be seen in the picture perfect reproducibility is achieved. Another observation is the presence of cracks. After being injected the material cools down and shrinks in the mold, inducing internal stress that are relieved by the creation of cracks. These cracks are only partial, they do not extend from one hole to the other. They do not decrease the structural integrity of the discs.
Figure 2.2: Picture of the aluminum mold producing the perforated discs. Rhomboidal posts can be seen in the middle as well as the polished surface underneath. Scale 1:1.2
Figure 2.3: Picture of the aluminum ring lifting a transparent perforated disc , as a result of tightening four screws. Scale 1:0.93
2.3. DESIGN OF THE REACTOR BODY
The next step in the production of the percolation reactor is the design of the reactor body. The percolating discs must be held in a jacket that would encapsulate flow. This jacket has to meet a number of requirements:
1. The fluid flow conditions must be uniform across the perforated discs. 2. It needs to be leak-proof.
3. Inlet and outlet tubing should not obstruct the field of view.
4. Axial transparency is necessary to be able to see through from top to bottom.
5. The lower disc needs to be positioned at 2.5 mm or less from the microscope
platform to ensure proper focus of the microscope on the lower disc with magnifications of 4x, lOx and 20x. This feature is essential for proper bead observation.
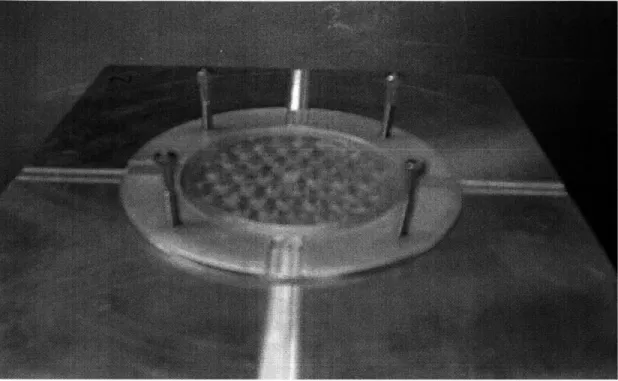
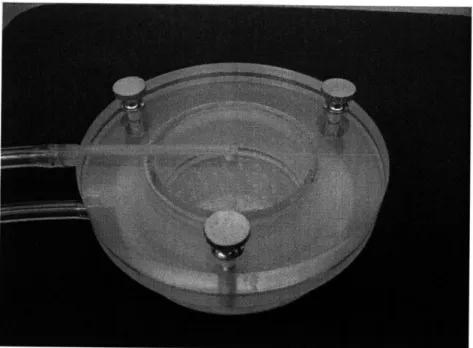
A picture of the reactor is shown in figure 2.5. The bottom of the reactor consists of three parts: the bottom disc, the ring and the cylinder (figure 2.6), while the top part includes two units: the cover and the disc holder (figure 2.7). Everything, except the bottom disc, is made of polymethylmethacrylate (PMMA) and the bottom disc is made of polystyrene. The percolating discs fit into the cylinder and sit on top of a step, which is supported by three feet (1mm high). These feet create three grooves underneath the discs allowing the fluid to exit radially. This fluid is then collected in the ring where the outlet tubing is located. Finally, the ring and the cylinder are sealed at the bottom by a 1mm thick transparent polystyrene disc. The three parts are glued together for proper sealing with methylchloride. The top of the reactor consists of a perfectly transparent PMMA disc glued with a PMMA cylinder. The bottom of the cylinder sits on the edges of the
disc keeping pressure on them, preventing any motion. The fluid is brought into the reactor through a groove in the PMMA disc, going from the edge to the center of the reactor. Finally, three thumbscrews are used to fasten the top and the bottom reactor together.
1) To comply with the first requirement a 2 cm gap is inserted between the percolating discs and the fluid inlet. The fluid has a chance to maintain a uniform inlet velocity across the discs, which will be verified experimentally. 2) To comply with the second requirement all the parts are glued together while
an O-ring is inserted into a slot situated on the outer edge of the cylinder to properly seal the reactor once the top and bottom parts are brought together. 3) To comply with the third requirement the inlet and outlet tubing are situated
on the side of the reactor.
4) To meet with the fourth requirement the top and the bottom discs are made of perfectly transparent plastics.
5) The fifth requirement is meet as a result of this design. The lower perforated
disc is at 2.5mm from the ground: the polystyrene disc is 1 mm thick, the feet are 1 mm high and the step is 0.5 mm thick, totaling 2.5 mm.
Figure 2.5: Picture of assembled percolation reactor. Scale 1:1.125
Figure 2.6: Picture depicting the bottom of the reactor. Scale 1:1.8
CHAPTER 3
MATERIALS AND METHODS
3.1. BIOCOMPATIBILITY STUDIES
The biocompatibility of the injected molded is tested by measuring attachment and function of hepatocytes under static culture conditions.
3.1.1. Cell culture
Hepatocytes were isolated from 2 to 3-month old adult Lewis rats (Charles River, Cambridge) by a modified procedure of Seglen4. Detailed procedures for isolation and purification of hepatocytes were previously described by Dunn et a12. Routinely, 200-300
million cells were isolated with viability between 85% and 95%, as judged by Trypan blue exclusion. Culture medium was Dulbecco's modified Eagle's Medium (DMEM, Gibco) supplemented with 10% fetal bovine serum (FBS, JR Scientific), 0.5 U/ml insulin, 7 ng/ml glucagon, 20 ng/ml epidermal growth factor, 7.5 pg/ml hydrocortisone, 200 U/ml penicillin, 200gg/ml streptomycin and 50gg/ml gentamycin' .3T3 fibroblast culture medium consisted of DMEM (Gibco) with high glucose, supplemented with 10% bovine calf serum (BCS , JRH Biosciences) and 200 U/ml penicillin and 200gg/ml
streptomycin'.
3.1.2. Attachment experiments
The kinetics of hepatocyte attachment on PSD is compared to that on ordinary tissue culture polystyrene dishes (TCPS). Three-inch diameter solid PSD are made by injection
molding, they are then manually washed in a Sparkleen detergent solution (Fisher Scientific Co, Pennsylvania), air-dried and separated into two groups. The first group is treated by 02-plasma exposure for 5 minutes at 200 W (PX250 Plasma etcher, March, Concord, California) while the second is left untreated. They are then rinsed with 70% ethanol, placed in P100 tissue culture dishes (Corning, New York) and left overnight under UV light for sterilization. Prior to use, the PSD and the TCPS are coated with type
I collagen solution prepared from rat tail tendoms2. The procedure consists of:
1) mixing four parts of distilled water with one part of collagen prepared from rat tail tendons.
2) adding ten milliliters of this solution into the P100 tissue culture dishes. 3) incubating at 37'C for 30 minutes.
4) the solution is then removed and the dishes are rinsed twice with media.
Approximately six million freshly isolated hepatocytes are seeded in 10 ml of media per dish. A shaker is placed in the tissue culture hood to prevent attachment prior to
completion of the seeding procedure. Time zero begins when shaking is stopped. All dishes are placed in an incubator at 37'C and six time points are studied: 10, 20, 30, 45,
60 and 90 minutes. At each of these time points, unattached cells are removed by immersing (once) and shaking the PSD and the TCPS in a phosphate buffered saline (PBS) solution at 37oC and pictures are taken of the remaining attached cells. The number of cells in each picture is counted and the viewing area is measured. Cell density is
therefore obtained at each time point and for each condition. The measured cell density is normalized to the seeding density leading to a percentage of attached cells.
3.1.3. Functional assay
Albumin is used to assess the functionality of hepatocytes on various surfaces. We used hepatocyte co-cultures with 3T3 fibroblasts as a standard methodology for long term culture of hepatocytes'. In the present study two ratios of hepatocyte to fibroblast (H:F) are tested: 2:1 and 1:6. Both plasma treated and collagen coated PSD are used, while the control consists of standard P100 TCPS coated with collagen. When H:F = 2:1,
4.5 million hepatocytes and 2.25 million fibroblasts are seeded, whereas in the case of H:F = 1:6, 0.75 million hepatocytes and 4.5 million fibroblasts are seeded. The seeding procedure is the same in both cases; it consists of first coating the surface with collagen as described previously. Thereafter, on day 0, freshly isolated rat hepatocytes are seeded in 10 ml of their proper media and incubated at 37'C to allow proper attachment and spreading. The media is removed twenty-four hours later (day one) and fibroblasts are seeded in 10 ml of medium containing 10% BCS (see above) to increase attachment. On day 2, the fibroblast medium is replaced by hepatocyte medium and is changed every 24 hours. Samples of 1 ml are taken every other day starting on day 3 and kept at 4'C. Albumin content is measured by enzyme linked immunosorbent assays (ELISA)3.
3.2. EXPERIMENTAL CHARACTERIZATION OF THE REACTORS
3.2.1 Flow circuit
The percolation reactor is subjected to flow and observed under the microscope for the next experiments. A peristaltic pump (Masterflex® LIS@ from Cole-Parmer Instruments Co, Illinois) and Masterflex® Silicone tubing US® 16 are used in all
experiments. Nylon tube connectors are purchased from Small Parts Inc, Florida, to join the tubing to the reactor. Finally the fluid reservoir consists of two 50ml Falcon conical tubes (Becton Dickinson Labware. New Jersey). A Nikon Diaphot microscope (Nikon) equipped with a Hg lamp and power supply (Nikon) is used in all experiments. It is equipped with a CCD camera (optitronics CCD V 1470). Metamorph Image Analysis System (Universal Imaging) is used for digital image acquisition and a Panasonic AG-6730 video cassette recorder (Panasonic) is used for video recording.
3.2.2. Fluid flow characterization
The bioreactor is first tested for the uniformity of the fluid flow across the discs. The second series of experiments consists of obtaining the velocity profiles across two discs and the wall shear stress. The fluid flow experiments are based on a two disc reactor, which is observed under the microscope.
Fluid flow uniformity across the reactor
The aim of this series of experiments is to check the uniformity of the flow across the perforated discs by studying the displacement of beads within the reactor. Polystyrene blue dyed microspheres (Polysciences, Pennsylvania) are used as beads. For the discs with a 565 gm spacing 10 pm beads are used, while for the discs with a 127 pm spacing 3 gm beads are used. The polystyrene beads have a density of 1.05g/cm 3, very close to that of water. The fluid flow conditions can be inferred from the motion of the beads. Their inertia can be neglected, due to their small size, and no buoyancy or sinking effects is present since their density is equal to that of water.
The first series of experiments are performed with a disc spacing of 565 Rm. Using a magnification of 4x, one is able to look at a hole on the upper disc and at a hole on the lower disc at the same time (figure 3.1). Indeed, at 4x the depth of focus is large enough to include both discs at a spacing of 565 gm. Thus 10 gm beads can be visualized leaving a hole on the upper disc and going into a hole on the lower disc. Their trajectory can therefore be studied. For the uniformity studies several units are video recorded all across the disc. The video recording is then replayed and five random beads are timed as they leave the upper disc and go into the lower hole. Every unit therefore has five
different measurements to average. The horizontal distance is measured by taking pictures of the unit and the vertical distance is known to be 565 Rm. An average velocity is therefore obtained and compared with others across the reactor. This experiment is performed for a range of flow rates going from 8.8ml/min to 16. 1ml/min.
,3A
Figure 3.1: Microscope view at 4x magnification. A portion of a hole in the upper disc (A) and a portion of another hole (B) on a disc 565 pm below are shown.
The experimental set-up is slightly altered with a disc spacing of 127 pm. A
magnification of lOx is used to properly see 3 ptm beads. The inlet and the corresponding outlet hole can no longer be seen on the same viewing area. Instead a region in between the inlet and the outlet hole is observed and again five random beads in focus are timed. The distance crossed by the beads is assumed horizontal since only beads that stay in focus from the beginning to the end of the viewing area are timed. It is easily measured by taking pictures of the unit.
Velocity profile and shear stress experiments
The goal is to obtain the velocity profile between the two discs. Thus, local velocities at various vertical distances need to be obtained. This can be achieved by inferring vertical distances from the degrees of angular rotation of the focus knob on the
microscope. The experiment consists of focusing on a given plane, knowing the vertical distance from the lower disc, and timing five different beads that are in focus.
Magnifications of lOx and 20x are used to decrease the depth of focus, which increases the sensitivity in the height measurements. The distance crossed by the beads is assumed horizontal since the beads stay in focus from beginning to end, and is easily measured by taking pictures. The local velocity at a certain vertical distance is therefore obtained. The wall shear stress is calculated by multiplying the fluid viscosity by the velocity difference of the first two data points and dividing them by the difference of their corresponding vertical distances.
=Y 2 -(1) Y2 -11
where V, and V2 are the first and the second velocities obtained experimentally and yi and Y2 are the corresponding vertical distance. These experiments are performed for a number of flow rates and both disc spacing.
3.2.3. Experimental characterization of the reactor with cells
Experiments are also performed to test the percolation reactor with hepatocytes subjected to flow. The percolation reactor with 127 ptm disc spacing was selected for these studies. The reactor consisted of two perforated discs with the lower disc collagen coated and seeded with hepatocytes. The perforated disc to be seeded was placed in a P60 tissue culture dish (Falcon, Lincoln Park, New Jersey), collagen coated as previously described
and seeded with 2x10⁶ hepatocytes in 3 ml of medium. The culture was incubated at 37'C and allowed to stabilize for 24 hours prior to its use in the experiment. A
comparison was also made with a parallel-plate reactor with the same surface area (same number of cells) and the same channel height. The parallel-plate reactor was described elswhere4. The experiments consisted of running the two reactors simultaneously at a given flow rate for six hours. Cell density before and after was measured by taking picture, at a 20x magnification, of each seeded plate at different random locations. Finally the overall cell viability was determined by Calcein AM/Ethidium homodimer- 1 assay (Viability/Cytotoxicity Kit, Molecular Probes L-3224, Eugene, Oregon)
Experiments were ran at two different flow rates 0.2 ml/min and 0.5 ml/min. Each experiment was repeated twice.
REFERENCES
1- S.N. Bhatia, U.J. Balis, M.L. Yarmush, and M. Toner, Effect of cell-cell interactions in preservation of cellular phenotype: cocultivation of hepatocytes and
nonparenchymal cells, FASEB J. 13, pp 1883-1899 (1999).
2- J.C.Y. Dunn, M.L. Yarmush, H.G. Koebe, R.G. Tompkins, Hepatocyte function and extracellular matrix geometry: long-term culture in a sandwich configuration, FASEB
J. 3, pp 174-177 (1989).
2- J.C.Y. Dunn, R.G. Tompkins and M.L. Yarmush, Long term in vitro function of adult hepatocytes in a collagen sandwich configuration, Biothechnol. Prog. 7, pp 237-245 (1991).
3- P.O. Seglen, Preparation of isolated rat liver cells, Methods Biol, 13 pp 29-83 (1976). 4- A.W. Tilles, U.J. Balis, Y. Choi, H. Baskaran, M.L. Yarmush, and M. Toner, Internal
membrane oxygenation removes substrate oxygen limitations in a small-scale hepatocyte bioreactor, (in preparation).
CHAPTER 4
FLUID FLOW ANALYSIS
A detailed understanding of the flow conditions acting on hepatocytes in the percolation reactor is necessary for proper functioning of the device. Given that a porous material is defined as a solid containing holes or voids, either connected or
non-connected, dispersed within it in either a regular or random manner3, the percolation
reactor used in this study is modeled using the porous media theory.
4.1. PERCOLATION REACTOR PROPERTIES
Macroscopic properties of the percolation reactors which are important in the study of the fluid flow through porous materials are defined in the following section.
4.1.1. Porosity E
Porosity is the fraction of the total volume of the unit that is occupied by void. It .3
is equal to the void volume divided by the total volume of the unit
VP
= (2)
Vt
where V is the pore volume and Vt is the total volume of the unit.
The void volume and the total volume are calculated for the present reactors as follows.
Vp Aholetdfln + AdiscHs (3)
where Ahole is the hole cross-sectional area, Adic is the disc cross-sectional area, td the disc thickness, nh the number of holes and H, the spacer height.
4.1.2. Specific surface I
The specific surface of a porous material is defined as the interstitial surface area
3
of the pores per unit of total volume
ISAP (5)
Vt
where ISAP is the interstitial surface area of pores. ISAP = Sh +Sd + S,
= 4tdanh + 2(Ad-nhAh) + 27rRH, (6)
where Sh is the holes surface area, Sd the disc surface area, S, the spacer surface area, a the hole side length and R the disc radius.
4.1.3. Tortuosity T
Tortuosity accounts for the fact that the path length of the flow is greater than the length of the sample of porous material. It is equal to the flow path length divided by the
unit length 3
T =L (7)
Lu
where Lf is the flow path length and Lu the unit length.
Lf td +(HS2 + Dio2 pm (8)
LU= td + Hs (9)
where Dio is the horizontal distance between an outlet hole and an inlet hole on two consecutive discs.
4.1.4. Permeability K
The definition of permeability of a porous medium is the volume of a fluid of unit viscosity passing through a unit cross-section of the medium per unit time under the action of a unit pressure drop ". It quantifies the ease with which a fluid flows though the
material due to an applied pressure gradient. In other words, permeability is the "fluid conductivity" of the porous material 3. The permeability must be determined by the geometry of the porous material and must be entirely independent of the nature of the fluid. Many theories were developed to link the porous structure to permeability. The theory that best applies to our structure is the Kozeny theory 3. It treats the porous
medium as a bundle of capillary tubes of equal length. These tubes are not necessarily of circular cross-section. A modification of the Kozeny theory was proposed to account for the fact that the tubes of flow are not straight, and hence the path length of flow is greater than the length of the unit. The modified Kozeny equation is 3
K = (10) 2TX2
4.2. FLUID FLOW ANALYSIS
4.2.1. Flow conditions
The first step in the analysis of the reactor's fluid flow consists of determining the flow conditions, mainly whether the flow is laminar or turbulent. Laminar flow of a fluid is characterized by stationary streamlines 6. In other words a fluid element which at one
point is traversing the same path as another element must follow the path of this element throughout its course. The flow regime in a porous material may be characterized by the Reynolds number as defined below 1,2:
Re = uK 2 (11)
where u is the area average fluid velocity through a column of porous material and y is the kinematic viscosity. Experimental evidence 0 has shown that laminar flow in porous media is characterized by a Reynolds number of less than 10. The critical velocity U, below which the flow would be laminar may be expressed as:
Ucr e 102 (12)
K= K1/
This critical velocity can be used to obtain a critical flow rate Qc, that can be compared to the flow rates used in the experiments:
Qcr= UcrAdisc (13)
4.2.2. Pressure drop estimation: Navier-Stokes equation
Of importance also in the analysis of the reactor's fluid flow is the pressure drop between inlet and outlet. Steady incompressible laminar flow in porous media was
studied by Liu et al 8,9 and DuPlessis et al 5. Using the volume averaging technique on the Navier-Stokes equation and the Kozeny-Carman theory, they developed equations to predict the pressure drop for flow through porous media taking viscous and inertial effects into account. These equations assume that the fluid is incompressible and that the solid matrix is incompressible, immobile and not supported by the fluid 9. These
assumptions are all met in our study. The proposed equations by Liu et al 8,9 and
DuPlessis et al 5 are 8:
AP fvpq(1-) 2
- = 13 (14)
where d, is the equivalent spherical diameter of the particles forming the porous structure, q the axial velocity andf, the normalized pressure drop. They are defined below.
d 6Vp(1- E) (15) ISAP x E
Q
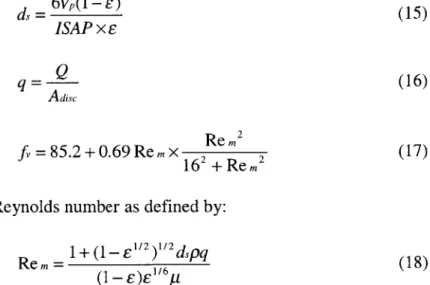
q = (16) Adisc Re r22 fv =85.2+0.69 Re m X 2 2 (17) 162+ Rem2 where Re.. is the modified Reynolds number as defined by:+ (1- E 2271(2dspq
Re m = (18)
(1 - e'o
Figure 4.1 shows the variation of the normalized pressure drop as a function of the modified Reynolds number. Two flow regimes are depicted in the graph: Darcy's regime and Forcheimer's regime. Darcy's regime is characterized by low flow rates in which viscous and inertial effects are negligible. Forcheimer flow regime is characterized by higher flow rates in which viscous effects and inertial effects are no longer negligible. The above equations are valid for both Darcy and Forcheimer flow regimes. Liu et al 9 estimated the critical value for the flow to transit from Darcy's regime to Frocheimer's regime to be Rem,= 7.2, and from Forcheimer's regime to the turbulent regime to be Rem
a E
E
Darcy's flow
Forchheimer flow region
Ree
Figure 4.1: Flow regions in porous medium characterized by the modified Reynolds number, Rem. Rem is the critical value at which the flow transits from Darcy's regime to Forcheimer's9.
4.2.3. Pressure drop estimation: Darcy's Law
In the case where viscous and inertial effects are not important we can obtain pressure drop values using Darcy's law. A one-dimensional model in porous media was introduced by Darcy (1856)7 with a simple linear relationship between pressure gradient and flow rate. Darcy's law is expressed as:
Qtotal KAP
(19)
Adisc 11
where Qotai is the total fluid flow rate, y the dynamic fluid viscosity, Adise the disc area, K the permeability and AP the pressure drop. Darcy's law was empirically derived and does not take viscous and inertial effects into account. The pressure drop AP across the reactor can be calculated with the following formula:
Al - 1l
(20)
4.2.4. Shear stress estimation
Low shear stress in a bioreactor is of paramount importance since hepatocytes in vivo are not exposed directly to flow. By increasing the number of holes in a disc the local flow rate in each hole decreases which in turn decreases the shear stress. When looking at one unit consisting of one outlet hole and three inlet holes (see figure 1.4) the
flow can be modeled as radial flow between two parallel discs. The associated wall shear stress for this type of flow is expressed as4:
= 3pqWhle (21)
7(Hs2r
where r is the horizontal distance from the center of the outlet hole to the point of interest
and qhole is the local flow rate going through one hole. In the present study the shear stress
will be evaluated midway between the outlet and the corresponding inlet hole; r=0.5Di0 where Dio is the horizontal distance between an outlet hole and an inlet hole on two consecutive discs. Therefore r = 1.33 mm. The local flow rate qhole is equal to the total
flow rate divided by the number of holes:
qhole -= Qtotal (22)
n h
This concludes the theoretical fluid flow analysis. The next section will present both experimental and theoretical characterization studies.
REFERENCES
1- A. Bejan and D.A. Nield, Convection in porous media, Springer, New York, 2nd pp 9
(1999).
2- A. Bejan, Convection heat transfer, John Wiley & Sons Inc., New York, pp 521
(1995).
3- R.E. Collins, Flow offluid through porous media, Reinhold chemical engineering series, Reinhold publishing corporation, New York (1961).
4- G.A. Ledezma, A. Folch, S.N. Bhatia, U.J. Balis, M.L. Yarmush, and M. Toner, Numerical model of fluid flow and oxygen transport in a Radial-Flow Microchannel containing hepatocytes, J. Biomech. Eng., 121, pp 58-64 (1999).
5- J.P. DuPlessis, J.H. Masliyah, Flow through isotropic granular porous media, Transp.
Porous Media,6, pp 207-221 (1991).
6- F. James, Introduction to fluid mechanics, MIT Press, Cambridge, MA (1994). 7- M. Muskat, Flow of homogenous fluids through porous media, McGraw Hill, New
York (1937).
8- S. Liu, J.H. Masliyah, Principles of single-phase flow through porous media,
Advances in chemistry series, n 251, American Chemical Society, Washington D.C,
pp 227 (1996).
9- S. Liu, J.H. Masliyah, Steady incompressible laminar flow in porous media, Elsevier
Science Ltd, pp 3565-3586 (1994).
10- J.C. Ward, Turbulent flow in porous media, J. Hydraul. Div. Am. Soc. Civ. Eng. 90, pp 1-12 (1964).
CHAPTER 5
MODEL PREDICTIONS AND EXPERIMENTAL
CHARACTERIZATION
5.1. BIOCOMPATIBILITY STUDIES UNDER STATIC CULTURES
In this section, we summarize a series of studies performed to evaluate the effectiveness of the injection molded surfaces for cell culture. Primary rat hepatocyte were used in the studies due to their relevance to the development of a bioartificial liver
device. Cell attachment and long-term function are used to assess the biocompatibility of injection molded surfaces as described next.
5.1.1. Cell attachment studies
Among the key steps in determining the interaction of cells seeded on a given surface is the kinetics of cell attachment onto the surface of interest. We chose to study the kinetics of attachment on injection molded polystyrene surfaces as compared to standard tissue culture polystyrene dishes (TCPD). The polystyrene discs made in-house are divided into plasma treated and non-treated groups. The remainder of the preparation parameters are identical among the two groups of surfaces. Figure 5.1, shows the
100-90 -80 -1
50 _ _- Plasma treated discs coated with
0 4) 70
1age
V ca o. 20- 10- 30-4) 0 10 20 30 40 50 60 70 80 90 Time [minutes]Figure 5.1: Kinetics of hepatocyte attachment. Comparison between tissue culture polystyrene dishes (TCPS) with plasma treated and untreated discs. Error bars represent. the standard deviation of five different measurements.
For the TCPD coated with collagen, the percentage of attached cells reaches 90% within 10 minutes and remains constant at that level for the remainder of the experiment. The plasma treated discs coated with collagen start with a lower percentage of attached cells, only 58% of the cells are attached after 10 minutes, however the number of
attached cells reaches that of the control after 60 minutes. The untreated discs coated with collagen start at much lower percentages; they reach 29% after 10 minutes and it is only after 90 minutes that 75% of cells attach and thus approach the control and plasma treated cells. These studies indicate that the injection molded surfaces do provide an adequate surface for cell attachment. Given that the plasma treated surfaces performed slightly better than the non treated surfaces, we used plasma treated and collagen coated surfaces for the remainder of the study.
5.1.2. Albumin secretion
To determine the long-term function of hepatocytes on a given surface, we measured albumin secretion in co-cultures. Figure 5.2 shows albumin production levels when the hepatocyte to fibroblast ratio H:F = 1:6 and the culture length is 25 days.
240 200 0 160 -- w- Control TCPS with 1 20 collagen
- Plasma treated discs
with collagen S 80- --40 4) cc 40 07 5 9 13 17 21 25 Days
Figure 5.2: Albumin production of hepatocytes cultured with fibroblast using a ratio of 1 hepatocyte for 6 fibroblasts.
It is evident by examining the graph that the production of albumin by
hepatocytes cultured on TCPS or on plasma treated discs is equivalent. Similar results were found in co-cultures where the ratio of hepatocytes to fibroblast H:F = 2:1 (data not shown). These results clearly suggest that the injection molding approach used to create polystyrene dishes for hepatocyte culture is compatible with long-term functioning of hepatocytes on these surfaces.
5.2.
THEORETICAL FLUID FLOW ANALYSIS
In this section we will describe results from the theoretical fluid flow modeling. First the porous media properties of the percolation reactors are conveyed. Second, the flow conditions, the pressure drop values, and the shear stress levels are estimated.
5.2.1. Percolation reactor properties
Porosity, specific surface, tortuosity and permeability are macroscopic properties which characterize the structure of the percolation reactors. They are defined in section 4.1. and their values are given below.
Table 5.1 : Percolation reactors properties
Properties Units 565 gm disc spacing 127 gm disc spacing
Porosity 36% 13%
Specific surface m1 1270 1691
Tortuosity 2.3 3.1
Permeability m2 6.29x10⁻⁹ 1.24x10¹⁰
Decreasing the spacer height by a factor of five affects the properties of the percolation reactor. Porosity and permeability values decrease while tortuosity and specific surface values increase. A lower porosity results in a smaller fluid volume since porosity is the ratio of the void volume (fluid volume) to the total volume. The reactor therefore maintains the same number of cells with less fluid which increases its efficiency. A higher value for the specific surface improves the performance of the reactor since it implies that there is more surface area available per unit volume. There is therefore more space for cells. A lower permeability and a higher tortuosity value depict a more intricate structure. The fluid would require higher pressures to flow through a
reactor with a higher tortuosity. By creating a structure with a higher specific surface value we require larger pressure drops which may adversely affect cells.
5.2.2. Flow conditions
Determining whether the flow regime is laminar or turbulent is important. A critical flow rate (Qcr) can be calculated representing the transition from laminar to turbulent flow (see section 4.2.1. equation (12) and (13)). For the reactor with 565 gm disc spacing the critical flow rate equals 1581 ml/min, while for the reactor with a disc spacing of 127 gm the critical flow rate equals 10945 ml/min. The critical flow rates are extremely high compared to the flow rates encountered in this experimental study (2ml/min to
20ml/min). Therefore the flow regime in the present study is laminar.
5.2.3. Pressure drop estimation: Navier-Stokes equation
The pressure drop across the reactor can be obtained by the Navier-Stokes equation where viscous and inertial effects are taken into account. A series of equations to predict the pressure drop for flow through porous media is presented in section 4.2.2. Table 5.2 shows the modified Reynolds number (Rem) and the pressure drop across the percolation reactor for different flow rates. These flow rates are within the range used in the