HAL Id: cea-02500845
https://hal-cea.archives-ouvertes.fr/cea-02500845
Submitted on 6 Mar 2020
HAL is a multi-disciplinary open access
archive for the deposit and dissemination of
sci-entific research documents, whether they are
pub-lished or not. The documents may come from
teaching and research institutions in France or
abroad, or from public or private research centers.
L’archive ouverte pluridisciplinaire HAL, est
destinée au dépôt et à la diffusion de documents
scientifiques de niveau recherche, publiés ou non,
émanant des établissements d’enseignement et de
recherche français ou étrangers, des laboratoires
publics ou privés.
reactor instrumentation - source definition and
renormalization to physical values
V. Radulovic, L. Barbot, D. Fourmentel, J.-F. Villard, G. Zerovnik, L. Snoj,
A. Trkov
To cite this version:
V. Radulovic, L. Barbot, D. Fourmentel, J.-F. Villard, G. Zerovnik, et al.. Multi-step Monte Carlo
cal-culations applied tonuclear reactor instrumentation - source definition and renormalization to physical
values. ANIMMA 2015 - 4th International Conference on Advancements in Nuclear Instrumentation,
Measurement Methods and their Applications, Apr 2015, Lisbonne, Portugal. �cea-02500845�
Multi-step Monte Carlo calculations applied to
nuclear reactor instrumentation - source definition
and renormalization to physical values
Vladimir Radulovi´c, Lo¨ıc Barbot, Damien Fourmentel, Jean-Franc¸ois Villard, Gaˇsper ˇ
Zerovnik, Luka Snoj,
and Andrej Trkov
Abstract—Significant efforts have been made over the last
few years in the French Alternative Energies and Atomic Energy Commission (CEA) to adopt multi-step Monte Carlo calculation schemes in the investigation and interpretation of the response of nuclear reactor instrumentation detectors (e.g. miniature ionization chambers - MICs and self-powered neutron or gamma detectors - SPNDs and SPGDs). The first step consists of the calculation of the primary data, i.e. evaluation of the neutron and gamma flux levels and spectra in the environment where the detector is located, using a computational model of the complete nuclear reactor core and its surroundings. These data are subsequently used to define sources for the following calculation steps, in which only a model of the detector under investigation is used. This approach enables calculations with satisfactory statistical uncertainties (of the order of a few %) within regions which are very small in size (the typical volume of which is of the order of 1 mm3).
The main drawback of a calculation scheme as described above is that perturbation effects on the radiation conditions caused by the detectors themselves are not taken into account. Depending on the detector, the nuclear reactor and the irradiation position, the perturbation in the neutron flux as primary data may reach 10 to 20%. A further issue is whether the model used in the second step calculations yields physically representative results. This is generally not the case, as significant deviations may arise, depending on the source definition. In particular, as presented in the paper, the injudicious use of special options aimed at increasing the computation efficiency (e.g. reflective boundary conditions) may introduce unphysical bias in the calculated flux levels and distortions in the spectral shapes.
This paper presents examples of the issues described above related to a case study on the interpretation of the signal from dif-ferent types of SPNDs, which were recently irradiated in the Joˇzef Stefan Institute TRIGA Mark II reactor in Ljubljana, Slovenia, and provides recommendations on how they can be overcome. The paper concludes with a discussion on the renormalization of the results from the second step calculations, to obtain accurate physical values.
Index Terms—
V. Radulovi´c, D. Fourmentel, L. Barbot, and J-F. Villard are with the CEA, DEN, DER, Instrumentation Sensors and Dosimetry Laboratory, Cadarache, F-13108 St Paul-Lez-Durance, France.
G. ˇZerovnik is with the Joˇzef Stefan Institute, Reactor Physics Department, Jamova cesta 39, SI-1000 Ljubljana, Slovenia, currently at EC-JRC-IRMM, Geel, Belgium.
L. Snoj is with the Joˇzef Stefan Institute, Reactor Physics Department, Jamova cesta 39, SI-1000 Ljubljana, Slovenia.
A. Trkov is with the IAEA, Vienna International Centre, PO Box 100, A-1400 Vienna, Austria.
I. INTRODUCTION
The detection of neutrons is generally based on the detection of secondary charged particles which originate from neutron induced nuclear reactions. There are two major types of detectors. The most common are ionization chambers with small amounts of fissile material (fission chambers - FCs) or absorptive material which upon neutron capture emits heavy charged particles (e.g. boron, due to the very high cross-section for the(n, α) reaction of the isotope10
B). The second detector type are self-powered neutron detectors (SPNDs), in whichβ
particles originating from the product nuclei of neutron capture reactions are detected directly as a small electric current. SPNDs have an important advantage as their construction is intrinsically robust and they are completely passive, i.e. they do not require an external power source.
With state of the art Monte Carlo particle transport codes (in this work the MCNP6 [1] code was employed) it is possible to perform criticality and transport calculations for neutrons, coupled with the creation of photons, electrons and heavy charged particles and the interactions which they undergo. This enables the calculation of quantities like electron currents through surfaces and charge deposition rates within cells, through which assessments of the response of neutron detec-tors in terms of the electric currents can be made. Generally a multi-step calculation process is required for multiple reasons. The sensitive regions of the neutron detectors are typically very small in size (of the order of 10 mm3), which means that achieving a satisfactory statistical uncertainty of the tallied quantities in calculations with a full computational model of a reactor can be prohibitive in terms of the required computation time. Furthermore, depending on the detector type, different mechanisms give rise to the predominant part of the electric current, e.g. Compton scattering or β-decay; the latter, as
described below, requires a further calculation step in which
β particles are transported within the detector geometry.
The multi-step process is outlined as follows:
• Step 1: neutron detectors and possible irradiation devices
are explicitly modelled in the irradiation location in the computational model of the reactor; neutron and gamma spectra and flux levels are calculated in its vicinity,
• Step 2: a model of the detector including its
imme-diate vicinity is created, neutron and gamma sources are defined using the calculated spectra from Step 1,
and electron currents are performed,
• Step 3:β sources are created within the detector model,
the intensity of which follows the calculated reaction rates from Step 2, calculations of charge deposition rates and electron currents are performed.
Explicit modelling of detectors and irradiation devices in Step 1 enables taking into account the perturbation effect on the experimental conditions caused by the presence of the detectors themselves. As shown in Section 2 of this paper, depending on the detector properties and the irradiation location, this effect may be significant.
Section 3 focuses on the physical representativeness of the Step 2 calculations, depending on the particle source definitions. It is seen that injudicious use of special options aimed at increasing the computation efficiency may have a detrimental effect by introducing unphysical bias in the flux levels and significant distortions in the spectral shapes.
In Section 4 indications are given on the renormalization of the calculated results from Step 2 and Step 3 calculations in order to obtain accurate physical values.
The examples presented in this work are related to a case study in which different types of SPNDs have been irradiated in the core of the JSI TRIGA Mark II reactor in Ljubljana, Slovenia. The experimental campaign is described more in detail in the conference paper [2].
II. PERTURBATION EFFECT
Depending on the design and material composition of the neutron detector, on insertion into a reactor core or irradiation facilities in its vicinity, a perturbation effect generally arises, wherein the presence of the detector locally affects the neutron flux which is to be measured. This is especially true for larger detectors and detectors which feature relatively large quantities of strong neutron absorbing material, which is generally true for SPNDs. It is possible to obtain experimental indications on the magnitude of the perturbation effect e.g. by observing the change in the critical control rod positions before and after detector insertion, or, if the reactor is equipped with a sensitive online reactivity meter (e.g. [3]), by observing the reactivity change upon insertion of the detector when the reactor is critical, keeping the control rod positions unchanged. In the latter case, if a decrease in the reactor power on insertion is observed, this is a clear indication of a large magnitude of the perturbation effect.
The perturbation effect can be investigated more in detail through Monte Carlo calculations using a computational model of the reactor into which a detector in question has been modelled explicitly, by performing calculations of neutron flux levels / neutron spectra or reaction rates inside the detector regions and in its vicinity for two cases:
1) with the detector materials explicitly modelled,
2) with all the detector materials replaced by the material as for the unperturbed case (typically water or air for light water reactors).
The effect is quantifiable by taking the ratios of the quan-tities calculated in the first and second case.
D1 D6 D5 D4 D3 D2 D11 D10 D9 D7 D15 D14 CC A1 B1 B6 B5 B4 B3 B2 C1 C6 C5 C4 C3 C2 C6 C6 C9 C8 C7 C12 C11 C10 S P E1 E5 E4 E3 E2 E13 E8 E7 E6 E12 E9 E17 E16 E15 E14 E20 E19 E18 E24 E23 E22 E21 F1 F5 F4 F3 F2 F8 F7 F6 F11 F10 F9 F15 F14 F13 F12 F19 F18 F17 F16 F20 F23 F22 F21 F26 F25 F24 F30 F29 F28 F27 D13 D12 D18 D17 D16 R C NS PT FPTS IC IC IC CC
Fuel element
Control rod
Irradiation channel
Neutron source
Measurement position
D8 E10 E11MP20
MP17
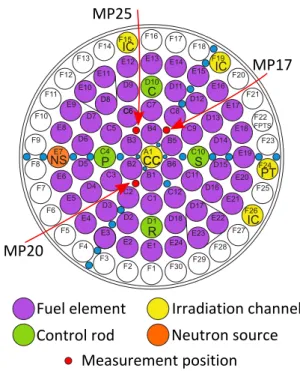
Fig. 1. Schematic view of the JSI TRIGA Mark II reactor core. Labeled are the Measurement Positions used in the SPND irradiation campaign.
The perturbation effect has been investigated for two types of standard SPNDs with Rh and Co emitters, irradiated in the core of the JSI TRIGA Mark II reactor. The reactor core consists of cylidrical fuel elements, 4 control rods, a neutron source and several irradiation channels (aluminium tubes filled with air) held in place by two aluminium grid plates. A schematic view of the core configuration is displayed in Figure 1.
Three Rh and three Co SPNDs have been modelled ex-plicitly in the MP17, MP20 and MP25 positions, along with aluminium guide tubes, used to perform the irradiations, in the computational model of the JSI TRIGA Mark II reactor which was previously verified and validated for neutronics calculations. The validation first begun with calculation of
kef f and the comparison with the criticality benchmark
ex-periment, performed in 1991 [4]. Subsequently, in order to expand the applicability of the computational model, compar-isons were made between calculated and experimentally de-termined reaction rate distributions for the197Au(n, γ)198
Au and 27Al(n, α)24
Na reactions in the irradiation channels of the reactor [5] and more recently for the197Au(n, γ)198Au
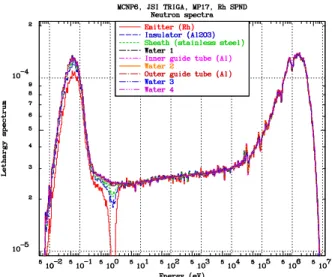
reaction within the reactor core [6]. Neutron spectra in the standard SAND-II 640 energy group structure have been calculated in the emitter, insulator and sheath of the SPNDs and several concentric water and aluminium cylindrical shells - the surrounding water and guide tubes. Calculations have been performed for the perturbed and unperturbed cases, as described. Vertical sections of the computational model containing the Rh SPNDs are shown in Figure 2.
Figures 3 and 4 display the calculated neutron spectra in the Rh SPND components and surrounding water shells and aluminium guide tubes for the case in which the SPND was modelled explicitly and for the unperturbed case, respectively.
Emitter
Insulator
Sheath
Inner guide tube
Outer guide tube
Water shells (1-4)
SPND and inner guide
tube modelled
SPND and inner guide
replaced by water
Water
Fuel
Water
Fuel
Fig. 2. Side views of a Rh SPND in the MP17 position in the computational model of the JSI TRIGA Mark II reactor. Left: SPND with materials explicitly modelled. Right: SPND with all materials replaced by water.
Fig. 3. Neutron spectra in Rh SPND components, SPND explicitly modelled
By comparing the neutron spectra for the two cases, the effect of the SPND presence becomes visible. In the SPND regions, a decrease in the thermal spectrum component and a significant distortion in the spectra at around 1 eV, due to the resonance in the neutron capture cross-section of 103Rh
are clearly observed. The presence of the SPND does affect the spectra in its vicinity as well. In Table I the values of the thermal flux in the energy group around 0.0253 eV, which corresponds to the conventional thermal flux (at 2200 m/s) are compared for the innermost water shell surrounding the SPND (labelled ”Water 1” in Figures 3 and 4) and the outermost water shell (labelled ”Water 4” in Figures 3 and 4).
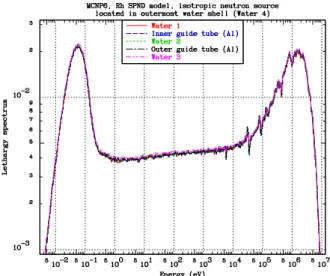
Fig. 4. Neutron spectra in Rh SPND components, SPND materials replaced by water
TABLE I
RELATIVE DIFFERENCES IN THERMAL NEUTRON FLUX IN THE INNERMOST AND OUTERMOST WATER SHELLS SURROUNDING THESPNDS, RH AND
COSPNDS
SPND type Region Relative difference in thermal flux Rh Water 1 -10 %
Water 4 -5 %
Co Water 1Water 4 -15 %-7 %
In the water shell in the immediate vicinty of the SPND the decrease in the thermal neutron flux is relatively large (10 and 15% for the Rh and Co SPNDs, respectively) and drops to about one half in the outermost water shell in the model. In order to predict the detector response accurately using multi-step Monte Carlo calculations, this effect needs to be investigated and taken into account in the further calculation steps. The calculations with the full computational model of the reactor as described above were criticality calculations (KCODE calculations in MCNP terminology). The calculated impact of the presence of three SPNDs of one type in the measurement positions MP17, MP20 and MP25 on the effective multiplication factor of the system is given in Table II
III. REPRESENTATIVENESS
Step 2 calculations are performed with a model of the neutron detector and neutron and gamma sources defined in its the vicinity. Reaction rates are calculated in the detector
TABLE II
CALCULATED IMPACT OF THE PRESENCE OF THREESPNDS OF ONE TYPE INSERTED INTO MEASUREMENT POSITIONSMP17, MP20ANDMP25ON
THE EFFECTIVE MULTIPLICATION FACTOR OF THE SYSTEM SPND type ∆kef f
Rh -44 pcm Co -63 pcm
Rh SPND Water 1
Emitter (Rh) Inner guide tube Outer guide tube
Insulator (Al2O3)
Closeup: Rh SPND Water 2
Water 3 Water 4
Gas gap 1 (Ar-5%He) Gas gap 2 (Ar-5%He) Sheath (stainless steel)
Fig. 5. Cross-section of the computational model used in Step 2 calculations.
Top: whole model, Bottom: Rh SPND. The outside diameter of the outermost
water shell is 31 mm.
Fig. 6. Neutron spectra in the vicinity of a Rh SPND for a Step 2 calculation using an isotropic neutron source located in the outermost water shell (Water 4), with energy spectrum calculated in Step 1.
regions, which serve as entry data for Step 3 calculations in whichβ particles are transported, originating from the regions
where they are created.
The cross-section of the model of a Rh SPND used in Step 2 calculations is presented in Figure 5. An isotropic neutron source is defined in the outermost water shell (labelled Water 4); the neutrons spectrum is taken directly from the calcu-lations perfomed in Step 1. Figure 6 displays the calculated neutron spectra in the vicinity of the SPND in the Step 2 calculations.
By comparing Figure 6 with Figure 3 it can be seen that the calculated spectra within the water and aluminium shells surrounding the SPND model bear close resemblance to one another. The relative magnitudes of the thermal and fast
Fig. 7. Neutron spectra in the vicinity of a Rh SPND for a Step 2 calculation using an inward directed source located in the outermost water shell (Water 4), with energy spectrum calculated in Step 1.
components in the spectra are about the same and the slope of the epithermal spectrum component is slightly positive, which corresponds to a slightly negative α parameter in the
commonly used 1/E1+α parametrization. This indicates that
the neutron transport calculations in Step 2 are realistic, i.e. representative of the physical situation.
In order to increase the computational efficiency of the Step 2 calculations one may define the neutron source in a different way. For example, instead of an isotropic source one may choose a source in which the initial neutron directions are predominantly oriented inwards, i.e. towards the SPND. In MCNP this is possible using the NRM -1 card in conjunc-tion with a particular surface (in the present case outermost cylindrical surface). Using this source definition, the angle of the source neutron directions with respect to the surface normal is distributed according to a cosine distribution. Figure 7 displays the neutron spectra in the water and aluminium shells, calculated using a source defined as described.
We immediately notice that important differences arise in the calculated values of the neutron flux in the regions (ob-tained by integrating the neutron spectra over the whole energy interval) and that the spectrum shapes do not correspond to the reference shapes in Figure 3. The effect of the resonance of the103Rh(n, γ) in the spectra reaction (the dip at around
1 eV) extends much further into the SPND vicinity than in the reference case. This is due to the definition of the initial direction distribution, for which seemingly a larger fraction of neutrons interacts with the SPND than in the refence case.
Another choice for the source definition aimed at increasing the computational efficiency is the use of reflective boundary conditions on the outermost surface in the model geometry. The neutron source is still isotropic; the incurred advantage is that all the neutrons which would otherwise escape from the system are reflected back, and a smaller number of neutron histories is needed in the calculations to achieve results
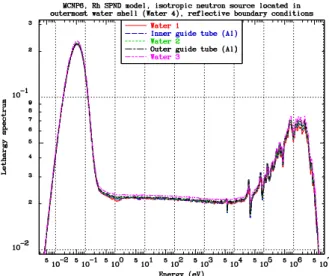
Fig. 8. Neutron spectra in the vicinity of a Rh SPND for a Step 2 calculation using an isotropic neutron source located in the outermost water shell (Water 4), with energy spectrum calculated in Step 1, with reflective boundary conditions on the outermost surfaces of the model.
with satisfactory statistical uncertainties. Figure 8 displays the calculated neutron spectra in water and aluminium shells around a Rh SPND, using a source defined as described. This time the epithermal and fast spectrum components are affected: the slope of the epithermal spectrum component is negative, which corresponds to a slightly positive α parameter and the
magnitude of the fast spectrum component is greatly reduced. The use of reflective boundary conditions causes neutrons to be excessively ”thermalized”. The fraction of neutrons which would otherwise escape from the system and not be registered in the calculated results are being reflected back and forced to interact with the materials in the model; it is these multiple reflections and interactions with the medium that are at the root of this effect. The detectors under investigation are sensitive to the thermal spectrum component, however, in the investigation of fast neutron detectors, the use of reflective boundary conditions is to be avoided absolutely.
IV. RENORMALIZATION
The general aim of the presented calculations is the de-termination of the electric currents originating from neutron detectors under irradiation. The absolute neutron flux levels in the detector regions are determined in Step 1 calculations by normalizing the calculated values according to the reactor power as per Equation 1 [7]:
φabs = φcalc
P ν wkef f
, (1)
where φcalc are the raw values from Step 1 calculations, P
is the reactor power,ν is the average number of neutrons per
fission, w is the average energy released as heat per fission
and kef f is the calculated effective multiplication factor in
the Step 1 calculations.
Monte Carlo particle transport codes generally yield re-liable results for the neutron flux, which are typically in
agreement with results obtained from activation measurements within 5-10%. Ideally in neutron detector testing, activation measurements are performed as well (e.g. measurements of
59Co(n, γ)60Co or 197Au(n, γ)198Au reaction rates), from
which a correction factor for the neutron flux is obtained and applied to the results of the calculations in Step 1.
A similar approach is used for the calculation of the gamma flux. The raw values from Step 1 calculations are normalized as per Equation 1, however in this case the situation is more complex. Coupled neutron-photon calculations enable the determination of the prompt gamma flux levels and spectra. It is possible to calculate the delayed contribution to the total gamma flux by creating gamma sources in the reactor model, determined by the reactor operating history. At present, investigations and calculations of the delayed gamma field in the JSI TRIGA Mark II reactor using the MCNP6 code are in progress. Recent measurements of the signal of miniature ionization chambers (MICs) developed at the CEA (French Atomic Energy and Alternative Energies Commission) fol-lowing reactor SCRAMs (shutdown with rapid insertion of control rods) in three nuclear reactors have demonstrated that the magnitude of the delayed contribution to the gamma field is on average of the order of 30% for light water reactors [8] [9]. Analogously as for the neutron flux, MIC measurements can provide a correction factor for the total gamma flux, which can be applied to the results of the calculation in Step 1.
The results determined in the Step 2 and Step 3 calculations using a computational model of the detector and its close vicinity, e.g. reaction rates, electron currents, charge deposition rates, have to be scaled according to the total neutron and gamma flux levels. LetX denote the quantity to be calculated
in a particular region of the neutron detector, denoted by the index i. The following approach is hereby proposed to
accurately scale the calculated values:
Xabs,i= Xcalc,i
φ∗ abs,i
φcalc,i
, (2)
where Xcalc,i is the calculation result in region i, φ∗abs,i
is the absolute neutron or gamma flux in region i as in
Equation 1, possibly including a correction factor determined from activation measurements for the neutron flux or by MIC measurements for the gamma flux (hence the notation with the asterisk as a superscript) andφcalc,i is the neutron or gamma
flux in regioni from the same calculation. The proposed
renor-malization requires the calculation of the neutron and gamma flux levels inside the detector regions in the calculations with the computational model of the detector and its close vicinity (Step 2 and Step 3 calculations). The ratioXcalc,i/φcalc,i can
be viewed as the sensitivity of the quantityX to the neutron
or gamma flux for the neutron detector in question. V. CONCLUSIONS
This paper presents several issues in the determination of the signals originating from neutron detectors under irradiation through the use of Monte Carlo calculations. It is shown that the presence of the detector itself generally causes a perturbation of the conditions to be measured which can be
Possibilities for quantifying this effect experimentally as well as through Monte Carlo calculations are discussed. The multi-step calculation process in use at the CEA for the calculation of SPND currents is outlined; examples of issues arising in the multistep process from the use of particular options in the source definitions are presented. Finally a discussion is given on how to renormalize the calculated results in the multistep process to obtain accurate physical values.
REFERENCES
[1] D. B. Pelowitz et al., MCNP6 User’s Manual, Version 1.0, May 2013, LA-CP-13-00634.
[2] L. Barbot, V. Radulovic, D. Fourmentel, L. Snoj, M. Tarchalsky and F. Malouch, Calculation to Experiment Comparison of SPND Signals In
Various Nuclear Reactor Environments, International Conference
ANI-MMA2015, 20-24 April 2015, Lisbon, Portugal.
[3] A. Trkov, M. Ravnik, H. B¨ock, and B. Glumac, Reactivity measurements
in a close-to-critical TRIGA reactor using a digital reactivity meter,
Kerntechnik, 57, 1992, pp. 296-300.
[4] M. Ravnik, R. Jeraj, ”Research reactor benchmarks,” Nucl. Sci. Eng. 145(2003)145-152.
[5] L. Snoj et al., Analysis of neutron flux distribution for the validation of computational methods for the optimization of research reactor utilization, Appl. Radiat. Isot. 69, 136-141.
[6] V. Radulovi´c et al., Validation of absolute axial neutron flux distribution calculations with MCNP with197
Au(n, γ)198
Au reaction rate distribu-tion measurements at the JSI TRIGA Mark II reactor, App. Rad. Isot. 84, 2014, 57-65.
[7] G. ˇZerovnik, M. Podvratnik, L. Snoj, On normalization of fluxes and
reaction rates in MCNP criticality calculations, Annals of Nuclear
Energy, 63, 2014, 126-128.
[8] V. Radulovi´c, et al., Measurements of miniature ionization chamber
currents in the JSI TRIGA Mark II reactor demonstrate the importance of the delayed contribution to the photon field in nuclear reactors,
paper submitted in 2015 to Nuclear Instruments and Methods in Physics Research Section A.
[9] D. Fourmentel et al., Delayed Gamma Measurements in Different
Nu-clear Research Reactors Bringing Out the Importance of the Delayed Contribution in Gamma Flux Calculations, International Conference