Thalamic Atrophy in Huntington’s Disease
Co-varies with Cognitive Performance: A
Morphometric MRI Analysis
Jan Kassubek1, Freimut D. Juengling2, Daniel Ecker1 and G. Bernhard Landwehrmeyer1
1
Department of Neurology, University of Ulm, Germany and 2
Department of Nuclear Medicine, University of Bern, Switzerland
The pattern of motor, behavioral and cognitive symptoms in Huntington’s disease (HD) implicates dysfunction of basal-ganglia-thalamo-cortical circuits. This study explored if cognitive performance in HD is correlated with localized cerebral changes. Psychomotor functions were investigated by verbal fluency, Stroop color word and Digit Symbol tests in 44 HD patients and 22 con-trols. Three-dimensional magnetic resonance imaging (MRI) data were analyzed with regard to regional gray matter changes by use of the observer-independent whole-brain-based approach of voxel-based morphometry (VBM). Using statistical parametric mapping, the MRI data of the HD patients were analyzed in an ANCOVA including the individual results of the neuropsychological tests. Besides striatal areas, symmetrical regional atrophy of the thal-amus was found to co-vary significantly with cognitive performance (P < 0.001, corrected for multiple comparisons). In particular, thalamic subnuclei projecting to prefrontal areas (dorsomedial subnucleus) and connected to the striatum (centromedian/ parafascicular and ventrolateral nuclear complex) displayed volume loss, in agreement with neuropathological studies. These results suggest that thalamic degeneration contributes in an important way to the impairment of executive function in early HD. Patients who are impaired in executive tests display structural double lesions of the basal-ganglia-thalamo-cortical circuitry both at the striatal and at the thalamic level.
Keywords: basal ganglia, executive functions, neurodegenerative disease, thalamus, voxel-based morphometry
Introduction
The clinical syndrome of Huntington’s disease (HD) is thought to reflect dysfunction of the motor, associative and limbic basal-ganglia-thalamo-cortical circuits (Joel, 2001). Timed psycho-motor tests, such as the verbal fluency task and the Stroop color word test, are part of the Unified Huntington’s Disease Rating Scale (UHDRS) and have been shown to be sensitive neuro-psychological tools for the assessment of cognitive function in HD in cross-sectional and longitudinal studies (Paulsen et al., 2001; Snowden et al., 2001). The cerebral network activated during verbal fluency and Stroop tasks is well established and includes prefrontal and thalamic regions (Ravnkilde et al., 2002). Since the brunt of the neuronal loss in HD is found in the striatum, i.e. the caudate nucleus and putamen (Vonsattel et al., 1985; Vonsattel and DiFiglia, 1998), HD is generally taken as a prime example of a disorder disrupting basal-ganglia-thalamo-cortical circuitry at the level of the striatum (Joel, 2001). However, a disruption at levels other than the striatum may well result in similar cognitive dysfunction (Van der Werf et al., 2000; Schuurman et al., 2002). In particular, there is convincing evidence from human lesion studies that the
thalamus is functionally important for performance in executive tests. For example, in a recent study in 22 patients with circumscribed vascular thalamic lesions, executive dysfunction-ing was shown to result from lesions especially of the medial dorsal, midline and intralaminar nuclei (Van der Werf et al., 2003). In a study of nine patients with localized thalamic strokes, performance in tasks probing executive function (e.g. verbal fluency) was found to be impaired in five subjects (Annoni et al., 2003). For HD, a subgroup analysis of three-dimensional magnetic resonance imaging (3-D MRI) in cogni-tively severely impaired HD patients suggested that thalamic atrophy might be associated with impaired cognitive functions in HD (Kassubek et al., 2004a). The present study attempts to clarify, using an observer-independent whole-brain-based ap-proach, if cognitive performance in HD patients is correlated with extrastriatal regional structural changes in volume-render-ing MRI.
Patients and Methods
All data are given as arithmetic mean
±
standard deviation. Forty-four patients with genetically confirmed HD in early clinical stages [I and II according to the classification of Shoulson (Shoulson and Fahn, 1979)] were investigated (male/female ratio 21/23; mean age 44.7±
10.7 years, range 25--66 years). None of the patients were treated with psychotropic drugs at the time of scanning. The mean number of CAG repeats in the mutant allele was 45.5±
7.8. The age of onset was assessed as the onset of motor signs; this information was obtained through self-reports of patients and their relatives. The mean interval between onset of motor symptoms and imaging was 5.1±
3.3 years. Patients were independently rated within one week prior to the studies by two experienced neurologists, using the motor score of the UHDRS and the Total Functional Capacity score (TFC). On the motor subscore of the UHDRS, the mean value was 24.1±
12.1. The TFC mean value was 10.9±
1.4.The neuropsychological tests were performed in all 44 HD patients and in 22 age-matched volunteers who constituted the control group both here and in the morphometric MRI analysis. The volunteers (male/female ratio 10/12; mean age 44.1
±
16.9 years, range 25--68 years) had no history of central nervous system disorders and displayed no symptoms and signs of neurological and psychiatric diseases at the time of examina-tion. They were matched to the patients with respect to years of school education. Three timed psychomotor tests, which are part of the UHDRS assessment battery, were used. First, a letter fluency test (LF, Controlled Oral Word Association test) was administered to assess verbal fluency by cueing the subjects with a particular letter and asking them to generate as many words as possible within 1 min (Benton and Hamsher, 1989). Cerebral Cortex June 2005;15:846--853doi:10.1093/cercor/bhh185
Second, the subjects performed the Stroop Color Word test to assess selective attention, perceptual interference and informa-tion processing speed (Treisman and Fearnley, 1969). This test consists of reading words, naming colors and then naming the color of ink of the words describing colors. The score is the number of correctly identified items within 45 s for each condition. Third, the Digit Symbol test (DS) from the Wechsler Adult Intelligence Scale — Revised (WAIS-R) (Wechsler, 1981) was employed under standard rules for administration, and the test was scored according to WAIS-R criteria. The results of the three tests (as scores adjusted for age, sex and education) were summed to generate a global cognitive score as is generally used for the cognitive subscore of the UHDRS. The summary score (as an index of three seperate test among which one — the Stroop test — is in itself composed of three subtests which tap differentially on ‘executive functions’) is referred to as an indicator of ‘executive functioning’. This is in line with the (arguably loose) definition of ‘executive function’ in the clinical literature to emphasize the fact that the common denominator of all tests used is that some aspects of ‘executive function’ are challenged.
High-resolution whole head 3-D MRI data of all patients were collected on a 1.5 T clinical scanner (Siemens, Erlangen, Germany). Images were acquired using a T1-weighted magne-tization-prepared rapid-acquisition gradient echo sequence (MP-RAGE) in the sagittal plane (160--180 partitions, repetition time 9.7 ms, echo time 3.93 ms, flip angle 15°, matrix 2563256 mm2, field of view 250 mm, voxel size 13 1 31 mm3). For setting up an age-matched MRI normal data base, 3-D MRI data of the above 22 healthy volunteers were acquired using the same scanning protocol. All MRI data were processed in the same way using methods implemented in the Statistical Para-metric Mapping software (SPM99, Wellcome Department of Imaging Neuroscience Group, London). Voxel-based morpho-metric analysis (VBM) was performed according to the princi-ples first described by Ashburner and Friston (Ashburner and Friston, 2000; Ashburner et al., 2003). The MRI data were spatially normalized to map each structural MRI to a template in the same standard 3-D stereotaxic space. Since the best matched templates are created from the study group itself so that the template can be considered as customized to the local MRI scanner and disease population, the customized templates in this study were created from the patients and controls (22 subjects each) in order to minimize the degree of non-linear warping required, as previously described as the so-called optimized protocol (Good et al., 2001, 2002). As a result of non-linear spatial normalization, the volumes of certain brain regions may grow, whereas others may shrink. In order to preserve the amount of a particular tissue (gray matter) within a voxel, a further processing step was incorporated. This involved modulating voxel values by the Jacobian determinants derived from the spatial normalization step (Ashburner and Friston, 2000). Modulation effectively converts values of gray and white matter concentration into gray matter mass, i.e. rendering the inferences about the absolute amounts (volume) of gray matter in a voxel as opposed to the relative amounts (concentration) (Good et al., 2001). Further data processing included automatic segmentation (into gray matter, white matter, cerebrospinal fluid) and smoothing (6 mm isotropic Gaussian kernel). After smoothing, each voxel represents the local average amount of gray matter in the surrounding region, the size of which is determined by the smoothing kernel. The
gray matter images of the HD patients were then statistically compared to the gray matter maps of the normal data base in a parametric group analysis to detect whether each voxel had a greater or lesser gray matter density than the controls. Within this approach, the flexible General Linear Model framework allows effects to be partitioned between different explanatory variables in a principled manner. This comparison between the entire patient group and the control group was performed within SPM99 as an analysis of covariance (ANCOVA) using the individual cognitive sum scores for each patient and each control. As nuisance variables, the individual values for age, total gray matter volume, disease duration and UHDRS motor score were included (being 0 for the latter two confounding covariates in the controls); that way, these variables were covaried out. Contrasts were chosen in such a way that the interaction between group and cognitive performance was examined.
As a different approach, a second ANCOVA was performed within SPM99 using only the gray matter images of the patients and individual cognitive scores (including age, total gray matter volume, UHDRS motor score and disease duration as confound-ing covariates). Finally, an additional ANCOVA was calculated within SPM99 for control purposes as a voxel-based comparison between the patient group and the control group using the individual UHDRS motor scores for the patients (and 0 for controls) as covariates without including the cognitive scores.
Resulting parametric maps were transformed to normal distribution. All data presented were corrected for multiple comparisons by the error correction implemented in SPM99 and were thresholded at a P-value P < 0.001, representing a conservative estimate. The coordinates of significant foci derived from the Montreal Neurological Institute template were transformed to the 3-D standard coordinate system of Talairach and Tournoux for anatomical identification using the appropri-ate algorithm (Brett et al., 2002). The identification of neuro-anatomical regions, e.g. specific thalamic subnuclei, was based on these stereotaxic coordinates as provided by the MNI or Talairach 3-D grid, respectively, gained from the voxel clusters with maximal Z-values (at P <0.001, corrected).
To further control for possible effects of atrophy on a group analysis of spatially normalized brains, an additional processing step was included: after analysis, the significant voxel clusters were registered back onto individual subjects’ brains. For that purpose, the spatial deformation fields applied during the spatial normalization of individual brain data were written out. These deformation fields were then inverted and consecutively applied to the significant voxel clusters. These inversely normalized voxel clusters were then superimposed onto the individual, original structural MRI data (i.e. which were not spatially normalized and thus in native space). This procedure was performed for all patients separately and anatomical local-izations of the thalamic clusters were checked for consistency. In addition, the brain parenchymal fractions (BPF) were calculated from the segmented 3-D MRI data for all HD patients according to a previously described largely automated protocol (Kassubek et al., 2003, 2004b). BPF, defined as the proportion of brain parenchymal volume to total intracranial volume, is a size-normalized quantification of brain volume and may serve as a marker of global brain atrophy if compared to age-matched healthy volunteers (Juengling and Kassubek, 2003). Further statistical analysis was performed using the Statistical Package for the Social Sciences software (SPSS, Version 9.0, Chicago, IL).
Results
Mean values in all three timed psychomotor tests indicated moderate impairment in the cohort of patients compatible with early stages of HD. The mean value of the summed cognitive score was 196
±
63 (range 120--364). In the control group, the mean cognitive sum score was 303±
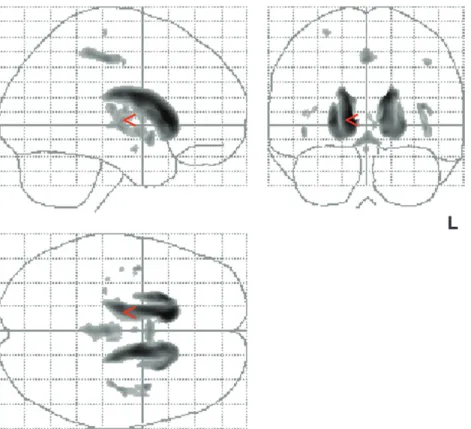
47 (range 235--389). Differences between the two groups were statistically signifi-cant both for each subscore and for the summed score (P <0.001, Mann--Whitney U-test). The values of the summed cognitive scores and all subtests in HD patients and controls are displayed in Table 1.Comparing HD patients and controls by use of VBM, including cognitive performance in an ANCOVA, regional decreases of gray matter density indicative of atrophy were found at high significance levels (thresholded at P < 0.001, corrected for multiple comparisons). Locally increased concentrations of gray matter were not found at P <0.001. Several areas of regional decrease in gray matter density were observed (Fig. 1A). The largest voxel clusters of significantly decreased gray matter density were localized in the caudate nucleus and in the putamen bilaterally and almost symmetrically, in agreement with the results of a previous VBM study in HD patients (Kassubek et al., 2004a) and neuropathological findings (Vonsattel and DiFiglia, 1998). Outside the striatum, gray matter density was markedly decreased bilaterally in the thalamus (P < 0.001, corrected; Fig. 1A--C). In addition, small voxel clusters of decreased gray matter density were localized in the opercula and in the paracentral lobule. In Figure 1A, maximum intensity projections of all areas with significantly decreased gray matter density are shown as an overlay on the SPM standard glass brain template.
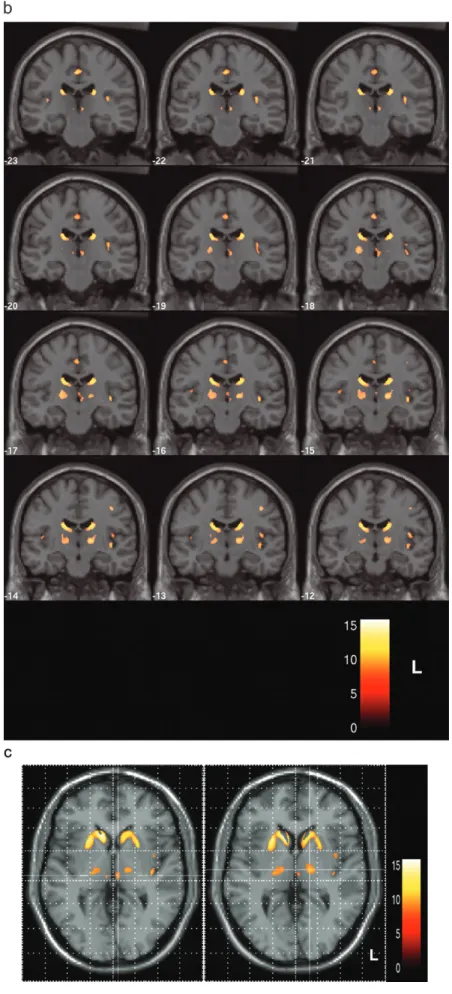
The thalamic gray matter changes were fairly symmetrical; they covered relatively large subregions of the thalamus, with two distinct intrathalamic voxel clusters. [Thalamic nuclear divisions are named according to the Jones nomenclature (Macchi and Jones, 1997).] A first cluster was found in the medial aspects of the thalamus, extending ventrally towards the hypothalamus (Fig. 1B and left part of Fig. 1C). The Talairach coordinates (x, y, z) of the area within the cluster displaying the highest significance values were 6 (--18) 2, indicating a localiza-tion within the dorsomedial nuclear complex (DM). A second, more laterally and ventrally localized cluster was identified (Fig. 1B and right part of Fig. 1C); the Talairach coordinates of the area within the cluster displaying the highest significance values were 15 (–14) 3, indicating a localization within the ventro-lateral complex (VLa). This cluster also covered in part the areas of the centromedian/parafascicular complex (CM; Fig. 1B). The areas of highest significance within the thalamus were localized within the ventrolateral group of both sides. The gray matter intensity values at these centers differed significantly between
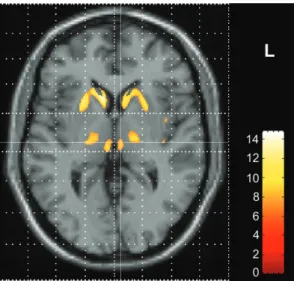
patients and controls (P <0.001; Mann--Whitney U-test, SPSS). The ANCOVA within SPM99 using only the gray matter images of the patients showed a nearly identical result pattern with regionally decreased gray matter in the striatum and in the thalamus including CM/VLa and DM (Fig. 2). The SPM-based analysis comprising the comparison between patients and controls using only the motor scores as covariates, which had been performed for control purposes, demonstrated significant gray matter changes mainly in striatal areas, but not in the thalamus (results not shown).
Following the inverse transformation of statistically signifi-cant clusters, the overlay onto each individual patient’s brain in native space demonstrated in all cases that thalamic changes were localized essentially in the same thalamic subnuclei as described for the group analysis. An illustrative example is given in Figure 3, showing significant gray matter changes in the dorsomedial as well as in the ventrolateral thalamic nuclear complexes in an individual HD patient.
Next, we analyzed the interdependence of the various factors included in the ANCOVA. The bivariate correlations, calculated between the different factors using SPSS, demonstrated a signifi-cant correlation between cognitive and motor scores (P <0.001). Correlations between age and cognitive or motor scores, respectively, and disease duration and cognitive or motor scores, respectively, were not statistically significant.
Mean BPF in the HD patients (mean age 44.7 years) was 0.7629
±
0.0303 (range 0.6980--0.8338). This value was signifi-cantly decreased both in comparison to the mean BPF of the age-matched normal data base used for the VBM analysis (0.8292±
0.0392) and compared to the mean BPF value of healthy controls at ages 40--49 years in a previous study (0.8295±
0.0055) (Kassubek et al., 2003), indicating substantial global cerebral atrophy. A bivariate correlation analysis between BPF values and overall cognitive performance (including performance in the cognitive subtests separately) did not disclose statistically significant correlations (SPSS).Discussion
In this voxel-based morphometric MRI study, which was designed to identify areas exhibiting regional atrophy depen-dent on cognitive deficits, decreases of gray matter density in the dorsomedial (DM) and centromedian/ventrolateral (CM/ VLa) nuclear groups of the thalamus bilaterally were identified to co-vary with cognitive performance, but not with other clinical features, e.g. motor impairment. This result suggests that structural changes outside the striatum contribute in an important way to a decline of psychomotor function in HD and indicates that the clinical phenotype of HD reflects a multi-system neurodegeneration.
From a methodological point of view, the VBM approach allows for a whole-brain based analysis without a priori assumptions about areas of alteration, in contrast to region-of-interest based approaches. Inherent to VBM, however, there are several properties that may render the interpretation of VBM studies challenging. The individual features of brains, i.e. gyral and sulcal patterns, are not preserved but blurred in the VBM technique by the steps of normalization to a template and smoothing — although the anatomical variability across indi-viduals may be difficult to interpret by region-of-interest techniques as well (Steinmetz and Seitz, 1991). Furthermore, the accuracy of registration in terms of spatial normalization in
Table 1
Scores of timed psychomotor tests (mean ± SD; single tests separately and summed score) for HD patients (n 5 44) and controls (n 5 22)
LF DS Stroop Sum score
Color naming Word reading Interference HD patients 22 ±11 29 ±15 48 ± 16 66 ± 20 30 ± 15 196 ± 63 Controls 30 ± 9 45 ± 13 75 ± 12 102 ± 12 41 ± 12 303 ± 47 P value P \ 0.001 P \ 0.001 P \ 0.001 P \ 0.001 P \ 0.001 P \ 0.001
LF, letter fluency test; DS, digit symbol test. Statistical significance of the differences between the groups calculated by Mann--Whitney U-test.
the presence of atrophy is a problem inherent in VBM. The non-linear spatial transformations used do not attempt to match every single structure in the brain exactly, but rather attempt to minimize global brain shape differences. Nevertheless, any differences detected by VBM must be caused by systematic differences in the anatomy of these structures between the groups of subjects to be compared. Several recent studies reported on the application of VBM to markedly atrophic brains (Grossman et al., 2004), demonstrating that the presence of atrophy per se does not preclude a valid analysis using VBM provided that a number of steps are performed to attenuate the potentially confounding effects of atrophy to the normalization process. In the present study, therefore, customized templates, taking into account the properties of the local MRI scanner and the disease population, were created from patients and controls in order to minimize the degree of non-linear warping required, as previously described by Good et al. (2001) as the so-called optimized protocol. By this approach, a further potential problem is addressed: the gray--white contrast of the thalamus is poor in T1-weighted images. The classification of gray and white tissue in the segmentation process within SPM is based on a prior probability map, reducing misclassification problems in regions with lower gray--white contrast. To further attenuate these misclassification errors, we used customized age- and disease-matched priors. The application of this protocol should therefore increase the applicability of the VBM approach in the analysis of diseased brains.
Our demonstration of thalamic volume alterations dependent on cognitive performance in early stages of HD appears at first glance to be at odds with recent studies using high-resolution MRI in which no significant atrophy was observed in the region of the thalamus. For example, in a 3-D MRI study using VBM, highly significant regional gray matter atrophy was found bilaterally in striatal areas, whereas extrastriatal gray matter changes were restricted to a small set of areas not involving the thalamus (Kassubek et al., 2004a). Rosas et al. reported a widespread extrastriatal involvement in 18 HD patients using a region-of-interest-based approach of 3-D MRI analysis (Rosas et al., 2003), but the thalamus appeared to be spared with volumes of 100% relative to normal controls. In addition, a functional imaging study using single photon emission computed tomography (Harris et al., 1996) could not demon-strate thalamic abnormalities in groups of patients with early HD. All these studies lumped together patients with different degrees of cognitive impairment. Cognitive deficits in early HD patients, although they inevitably develop, vary considerably in severity; therefore, subtle regional structural changes associated with cognitive decline might be missed in imaging studies if unselected large groups of HD patients in early stages are investigated. In the present study, impairment of executive functions was specifically interrogated by three neuropsycho-logical tests, and the test scores in these timed psychomotor tasks were used for an ANCOVA within the morphometric comparison between patients and controls in the sense of
Figure 1. Results of voxel-based morphometric comparison between HD patients (n 5 44) and controls (n 5 22) (ANCOVA including individual cognitive performances). (A) Maximum intensity projection of all areas with significantly decreased gray matter (P \ 0.001, corrected for multiple comparisons) in the SPM group analysis as an overlay on the SPM standard glass brain template (sagittal, axial and coronal view). The local maximum in the right thalamus (located in the ventrolateral nucleus) is marked by the red arrowhead. (B) Display of the areas showing significantly decreased gray matter (P \ 0.001, corrected) superimposed on the standard template as a range of slices in coronal view, covering the brain from stereotaxic coordinates y 5ÿ23 to y 5 ÿ12 (slice thickness 1 mm). Z-score is indexed by the colorbar. (C) Enlarged single slices in axial view showing the overlay of significant voxel clusters localized in the thalamus onto the SPM template, on the left at the level of the dorsomedial nucleus (z 5 2) and on the right at the level of the ventrolateral nuclear group (z 5 3), each marked by crosshairs. Z-score is indexed by the colorbar.
voxel-based lesion-symptom mapping as proposed by Bates et al. (2003).
The demonstration of thalamic volume loss in the present VBM analysis converges with neuropathological observations (Heinsen et al., 1996, 1999), indicating neuronal loss within the thalamus in end-stage HD patients at autopsy. At postmortem, two thalamic subregions appear to be most prominently affected: first, the centromedian/parafascicular nuclei (CM) and second, the dorsomedial nuclei (DM) (Heinsen et al., 1999). In addition, the ventrolateral thalamic subregion, which relays basal ganglia output, may display volume loss (Dom et al., 1976). The same subnuclei which demonstrated to exhibit the most profound alterations in neuropathological studies of end-stage HD brains (well in access to the global atrophic changes in the thalamus or the brain overall) were shown to be altered in our observer-independent hypothesis-free VBM analysis based on the Talairach coordinates of the maxima of significant voxel-clusters and therefore supports our interpretation that these thalamic changes develop as a feature of HD.
The connectivity of the affected thalamic subnuclei lends further plausibility to the notion that the alteration of the thalamus in HD has functional implications. CM as an efferent thalamic nucleus mainly projects to the striatum (Morel et al., 1997); a retrograde process of degeneration may therefore play a role in the degeneration of CM in HD. In contrast, DM is not synaptically connected to the striatum, but projects preferen-tially to prefrontal cortical areas. Although several areas in the thalamus might account for executive deficits, especially DM (which was shown to be affected in our study) seems to be an important relay station in executive function as demonstrated by lesion studies (Schuurman et al., 2002; Van der Werf et al., 2003).
It is unknown when during the course of HD thalamic degeneration sets in, resulting in volume changes and eventually leading to neuronal loss. In a previous VBM study in 18 presymptomatic HD gene carriers (Thieben et al., 2002), gray matter changes in the tectum of the midbrain were reported among other findings which extended into the left medio-dorsal thalamic nucleus. These findings are compatible with our data since the mutation-positive subjects in the study by Thieben et al. showed some gray matter alterations in the thalamic area (small-volume-corrected P=0.003, only in the left hemisphere) while scoring significantly lower than controls in, for example, the Stroop word score. A definite answer to the question when in the course of HD thalamic changes begin to be apparent obviously requires a longitudinal study in mutation carriers well before the onset of clinically apparent disease; a large-scale longitudinal study (‘PREDICT-HD’) was launched in 2001 by the Huntington Study Group to address questions of this kind (http://www.huntington-study-group.org). The data of the present study suggest that already in HD stages I and II thalamic alterations can occur, in particular in patients displaying prominent impairment in timed psychomotor tasks. These findings imply that HD is a true multisystem disorder which appears to affect regions outside the striatum at a time when overall functional impairment does not yet preclude indepen-dent living.
In addition, the evidence for both striatal and thalamic atrophy in the present study suggests that the basal-ganglia-thalamo-cortical loops engaged in verbal fluency and Stroop tasks may be disrupted at several levels in HD. Our study demonstrates disruptions at the level of both striatum and Figure 2. Results of voxel-based morphometric analysis in HD patients (n 5 44) using
ANCOVA including individual cognitive performances. Enlarged single slice in axial view showing the overlay of significant voxel clusters localized in the thalamus onto the SPM template, at a level demonstrating both the dorsomedial nucleus and the ventrolateral nuclear group (z 5 2). Z-score is indexed by the colorbar.
Figure 3. Overlay of significant voxel clusters onto structural 3-D MRI of an individual HD patient after inversed normalization, i.e. in native space. Significant voxels in the thalamus are localized both in the dorsomedial and in the ventrolateral thalamic nuclear complexes. Z-score is indexed by the colorbar. Note that the left--right orientation is reversed after inversed normalization.
thalamus. There are several arguments in favor of an important role of thalamic atrophy in cognitive dysfunction present in the HD patients: first, thalamic gray matter changes were only observed when analyzing brain morphology with cognitive functions as a covariate; striatal changes, however, occur as a robust finding in a morphometry without additional co-variance (although it is clear that the possibility that striatal alterations in themselves are sufficient to cause the cognitive deficits observed in HD patients cannot be ‘ruled out’ by the data presented). Second, the results of the additional analyses performed support this interpretation: (i) the within-group analysis of the HD patients with cognitive score as covariates demonstrates the same pattern of thalamic grey matter changes; (ii) in comparison, an analysis using clinical parameters other than cognitive score (e.g. motor score) as covariates demon-strates no thalamic grey matter changes. Concerning the other extrastriatal alterations (i.e. the circumscribed cortical atrophy localized in the opercula bilaterally and in the right paracentral lobule) disclosed by our analysis, it is of note that (i) these alterations were considerably less robust (with respect to the P-values in this study) than the thalamic changes reported and (ii) that we observed these circumscribed cortical changes — like the striatal atrophy — as well in analyses not using cognitive functions as a covariate. All these points support the view that localized thalamic atrophy in HD does have a functional correlate, i.e. contributes to cognitive impairment. Lastly, it is worth mentioning that the localization of the atrophy within the thalamus (i.e. affecting the medio-dorsal and the ventrolat-eral subnuclei) is plausible in view of what is known about the connectivity (and hence functional role) of the thalamic subregions disclosed by our analysis. The results of lesion studies emphasize this point, i.e. the observation that impair-ment in verbal fluency and Stroop tests reminiscent of the pattern found in HD can be brought about by isolated thalamic lesions, e.g. circumscribed infarct (Van der Werf et al., 2000).
To our minds, the fact that no prefrontal cortical areas were shown to display significant atrophy in this VBM analysis does not imply that these areas are structurally intact — neuropath-ological studies (e.g. DiFiglia et al., 1997; Gutekunst et al., 1999), as well as MRI-based studies (Rosas et al., 2002) provided evidence to the contrary — but indicates that cortical atrophy is variable and does not develop with the same robustness as in striatal and thalamic regions. As a note aside: with respect to thalamic changes, we qualify the thalamic atrophy in cognitively impaired HD patients as ‘robust’ based on the high P value associated with thalamic alterations; we do not want to imply by ‘robust’ that multiple other MRI-based studies on HD came to identical conclusions — on the contrary, further independent studies are needed to either confirm or refute our findings.
Furthermore, the impairment in executive functions appears to co-vary specifically with regional atrophy in both striatal and thalamic areas. In the present study [as well as in a 3-D MRI study on 70 HD patients (Kassubek et al., 2004b)], no significant correlation between clinical scores and the BPF values was found. This observation indicates that there is no correlation between the impairment of executive functions and overall gross brain atrophy and underscores that regional atrophy appears to underlie diminished cognitive abilities in HD.
Lastly, our findings have implications for the use of HD patients to infer basal ganglia function. In numerous studies, results obtained in HD patients were interpreted solely as
a reflection of basal ganglia dysfunction (e.g. Lauterbach et al., 1998; Richer et al., 2002). Our results caution against this interpretation since the patients who are impaired in executive tests display ‘double’ lesions both at the striatal and the thalamic level. Our results suggest that neuropsychological tools like verbal fluency and Stroop tests are useful for probing the function of basal-ganglia-thalamo-cortical circuitry, but do not allow to infer specific sites of disruption.
Notes
Address correspondence to Jan Kassubek, Department of Neurology, University of Ulm, Oberer Eselsberg 45, 89081 Ulm, Germany. Email: [email protected].
References
Annoni JM, Khateb A, Gramigna S, Staub F, Carota A, Maeder P, Bogousslavsky J (2003). Chronic cognitive impairment following laterothalamic infarcts: a study of 9 cases. Arch Neurol 60: 1439--1443.
Ashburner J, Friston KJ (2000) Voxel-based morphometry — the methods. Neuroimage 11:805--821.
Ashburner J, Csernansky JG, Davatzikos C, Fox NC, Frisoni GB, Thompson PM (2003) Computer-assisted imaging to assess brain structure in healthy and diseased brains. Lancet Neurol 2:79--88. Bates E, Wilson SM, Saygin AP, Dick F, Sereno MI, Knight RT, Dronkers
NF (2003) Voxel-based lesion-symptom mapping. Nat Neurosci 6:448--450.
Benton AL, Hamsher K (1989) Multilingual aphasia examination. Iowa City: AJA Associates.
Brett M, Johnsrude IS, Owen AM (2002) The problem of functional localization in the human brain. Nat Rev Neurosci 3:243--249. DiFiglia M, Sapp E, Chase KO, Davies SW, Bates GP, Vonsattel JP, Aronin
N (1997) Aggregation of huntingtin in neuronal intranuclear inclusions and dystrophic neurites in brain. Science 277:1990--1993. Dom R, Malfroid M, Baro F (1976) Neuropathology of Huntington’s chorea. Studies of the ventrobasal complex of the thalamus. Neurology; 26:64--68.
Good CD, Johnsrude IS, Ashburner J, Henson RN, Friston KJ, Frackowiak RS (2001) A voxel-based morphometric study of ageing in 465 normal adult human brains. Neuroimage 14:21--36.
Good CD, Scahill RI, Fox NC, Ashburner J, Friston KJ, Chan D, Crum WR, Rossor MN, Frackowiak RS (2002) Automatic differentiation of anatomical patterns in the human brain: validation with studies of degenerative dementias. Neuroimage 17:29--46.
Grossman M, McMillan C, Moore P, Ding L, Glosser G, Work M, Gee J (2004) What’s in a name: voxel-based morphometric analyses of MRI and naming difficulty in Alzheimer’s disease, frontotemporal dementia and corticobasal degeneration. Brain 127:628--649. Gutekunst CA, Li SH, Yi H, Mulroy JS, Kuemmerle S, Jones R, Rye D,
Ferrante RJ, Hersch SM, Li XJ (1999) Nuclear and neuropil aggregates in Huntington’s disease: relationship to neuropathology. J Neurosci 19:2522--2534.
Harris GJ, Aylward EH, Peyser CE, Pearlson GD, Brandt J, Roberts-Twillie JV, Barta PE, Folstein SE (1996) Single photon emission computed tomographic blood flow and magnetic resonance volume imaging of basal ganglia in Huntington’s disease. Arch Neurol 53:316--324. Heinsen H, Ru¨b U, Gangnus D, Jungkunz G, Bauer M, Ulmar G, Bethke B,
Schu¨ler M, Bo¨cker F, Eisenmenger W, Go¨tz M, Strik M (1996) Nerve cell loss in the thalamic centromedian-parafascicular complex in patients with Huntington’s disease. Acta Neuropathol (Berl) 91: 61--168.
Heinsen H, Ru¨b U, Bauer M, Ulmar G, Bethke B, Schu¨ler M, Bo¨cker F, Eisenmenger W, Go¨tz M, Korr H, Schmitz C (1999) Nerve cell loss in the thalamic mediodorsal nucleus in Huntington’s disease. Acta Neuropathol (Berl) 97:613--622.
Joel D (2001) Open interconnected model of basal ganglia-thalamo-cortical circuitry and its relevance to the clinical syndrome of Huntington’s disease. Mov Disord 16:407--423.
Juengling FD, Kassubek J (2003) Standardized calculation of brain parenchymal fraction: an approach to objective assessment of cerebral atrophy. AJNR Am J Neuroradiol 24:1492--1493.
Kassubek J, Tumani H, Ecker D, Kurt A, Ludolph AC, Juengling FD (2003) Age-related brain parenchymal fraction is significantly decreased in young multiple sclerosis patients: a quantitative MRI study. Neuro-report 14:427--430.
Kassubek J, Juengling FD, Kioschies T, Henkel K, Karitzky J, Kramer B, Ecker D, Andrich J, Saft C, Kraus P, Aschoff AJ, Ludolph AC, Landwehrmeyer GB (2004a) Topography of cerebral atrophy in early Huntington’s disease: a voxel-based morphometric MRI study. J Neurol Neurosurg Psychiatry 75:213--220.
Kassubek J, Landwehrmeyer GB, Ecker D, Juengling FD, Muche R, Schuller S, Weindl A, Peinemann A (2004b) Global cerebral atrophy in early stages of Huntington’s disease: quantitative MRI study. Neuroreport 15:363--365.
Lauterbach EC, Cummings JL, Duffy J, Coffey CE, Kaufer D, Lovell M, Malloy P, Reeve A, Royall DR, Rummans TA, Salloway SP (1998) Neuropsychiatric correlates and treatment of lenticulostriatal diseases: a review of the literature and overview of research opportunities in Huntington’s, Wilson’s, and Fahr’s diseases. J Neuro-psychiatry Clin Neurosci 10:249--266.
Macchi G, Jones EG (1997) Toward an agreement on terminology of nuclear and subnuclear divisions of the motor thalamus. J Neurosurg 86:670--685.
Morel A, Magnin M, Jeanmonod D (1997) Multiarchitectonic and stereotactic atlas of the human thalamus. J Comp Neurol 387: 588--630.
Paulsen JS, Zhao H, Stout JC, Brinkman RR, Guttman M, Ross CA, Como P, Manning C, Hayden MR, Shoulson I, Huntington Study Group (2001) Clinical markers of early disease in persons near onset of Huntington’s disease. Neurology 57:658--662.
Ravnkilde B, Videbech P, Rosenberg R, Gjedde A, Gade A (2002) Putative tests of frontal lobe function: a PET-study of brain activation during Stroop’s test and verbal fluency. J Clin Exp Neuropsychol 24: 534--547.
Richer F, Boulet C, Maheu G, Achim A, Chouinard S (2002) Frontal and striatal brain lesions increase susceptibility to masking in perceptual decisions. Brain Cogn 50:90--94.
Rosas HD, Liu AK, Hersch S, Glessner M, Ferrante RJ, Salat DH, van der Kouwe A, Jenkins BG, Dale AM, Fischl B (2002) Regional and progressive thinning of the cortical ribbon in Huntington’s disease. Neurology 58:695--701.
Rosas HD, Koroshetz WJ, Chen YI, Skeuse C, Vangel M, Cudkowicz ME, Caplan K, Marek K, Seidman LJ, Makris N, Jenkins BG, Goldstein JM (2003) Evidence for more widespread cerebral pathology in early HD: an MRI-based morphometric analysis. Neurology 60:1615--1620. Schuurman PR, Bruins J, Merkus MP, Bosch DA, Speelman JD (2002) A comparison of neuropsychological effects of thalamotomy and thalamic stimulation. Neurology 59:1232--1239.
Shoulson I, Fahn S (1979) Huntington’s disease: clinical care and evaluation. Neurology 29:1--3.
Snowden J, Craufurd D, Griffiths H, Thompson J, Neary D (2001) Longitudinal evaluation of cognitive disorder in Huntington’s dis-ease. J Int Neuropsychol Soc 7:33--44.
Steinmetz H, Seitz RJ (1991) Functional anatomy of language processing: neuroimaging and the problem of individual variability. Neuro-psychologia 29:1149--1161.
Thieben MJ, Duggins AJ, Good CD, Gomes L, Mahant N, Richards F, McCusker E, Frackowiak RS (2002) The distribution of structural neuropathology in pre-clinical Huntington’s disease. Brain 125:1815--1828.
Treisman A, Fearnley S (1969) The Stroop test: selective attention to colours and words. Nature 222:437--439.
Van der Werf YD, Witter MP, Uylings HB, Jolles J (2000). Neuropsy-chology of infarctions in the thalamus: a review. Neuropsychologia 38:613--627.
Van der Werf YD, Scheltens P, Lindeboom J, Witter MP, Uylings HB, Jolles J (2003) Deficits of memory, executive functioning and attention following infarction in the thalamus; a study of 22 cases with localised lesions. Neuropsychologia 41:1330--1344.
Vonsattel JPG, DiFiglia M (1998) Huntington disease. J Neuropathol Exp Neurol 57:369--384.
Vonsattel JP, Myers RH, Stevens TJ, Ferrante RJ, Bird ED, Richardson EP Jr (1985) Neuropathological classification of Huntington’s disease. J Neuropathol Exp Neurol 44:559--577.
Wechsler D (1981) Manual for the Wechsler Adult Intelligence Scale — Revised. New York: Psychological Corporation.