bmp7a alk1 alk2 alk3 alk6
A
B
E’
C
C’
D
E
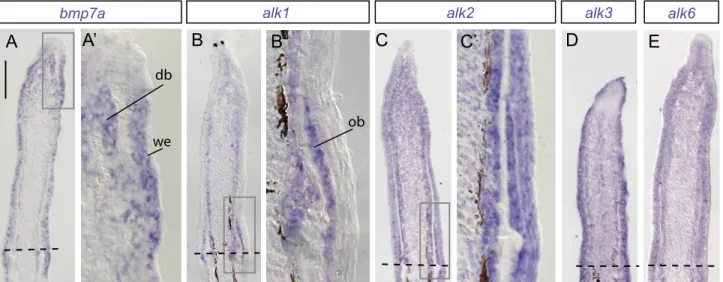
Figure S1. BMP signaling components are expressed in partially overlapping patterns in the regenerate.
(A-E) In situ hybridization of longitudinal fin sections at 3 dpa. (A) bmp7a, a BMP ligand, is expressed in the distal blastema and wound epidermis. (B) alk1 is upregulated in the osteoblasts and the distal blastema. (C-E) alk2, alk3 and alk6 display nearly ubiquitous expression with higher levels in osteoblasts and wound epidermis. Dashed lines indicate the plane of amputation. db, distal blastema; we, wound epidermis; ob, osteoblasts. Scale bar in (A), 100 μm. n>3 for each probe.
A’
B’
db
we
ob
wild type hsp70:nog3
3 dpa
4 dpa
3 dpa 4 dpa 3 dpa 4 dpa 700 600 500 400 300 200 100 0
wild type hsp70:nog3
Length of r egener at e (µm) *** 4 dpa 3 dpa 3.5 dpa
"
wild type hsp70:bmp2b hsp70:nog3
3 dpa
10 dpa
21 dpa
21 dpa 10 dpa
daily heat shock, 1h at 37°C
A
B
Figure S2. Transgenic manipulation of Bmp signaling results in teratogenic effects. (A) Live imaging of regenerating fins of wild type, tg(hsp70:bmp2b) and tg(hsp70:nog3). The same fins are photographed at different time points. The fish were exposed to daily heat shock for 10 days after amputation, then transfered to normal conditions for 11 days. Heat shocked wild type fish formed the blastema and normal regenerate. Overexpression of bmp2b completely blocked regeneration in 60% of rays and impaired it in 40% of rays. After return to normal conditions rays that had blocked regeneration failed to resume it, whereas fins with impaired regeneration resumed regeneration. Overexpression of nog3 (antagonist of Bmp signaling) inhibited regeneration (96% of rays) or impaired it (4% of rays) . After return to normal conditions, regeneration was resumed in 50% of rays. For all groups number of fins > 4.
(B) Wild type and tg(hsp70:nog3) fish were left to regenerate for 3 days in normal condition, then exposed to 2 heat shocks between 3 and 4 dpa. Induction of nog3 caused a regression of the outgrowth by 50%. Bottom graph shows a quantification of the length of the regenerate at 3 and 4 dpa in wild type and transgenic fish (measured by the average of the 2nd, 3rd and 4th ray from the edge of the fin on both side). For both groups n = 6 rays in 3 fins, ***p<0.005
control 0.1% DMSO 1 µM DMH1 3 dpa 10 dpa 20 µM DMH1 A 10 µM DMH1
% of outgrowth size relative to control
A B C D
F G H
Figure S4. Phenotypic analysis of fin regeneration exposed to different DMH1 concentrations.
(A-E) At 3 dpa, the fins treated with 1, 10 and 20 mM DMH1 formed an outgrowth of slightly smaller size compared to control. n=3; ns, P>0.05. At 10 and 20 μM DMH1, blood clots (red) were visible in the outgrowth.
(F-J) At 10 dpa, the difference between control and all DMH1-treated fins is statistically significant. (G) 1 μM DMH1 delayed regeneration by approx. 50%. (H-I) 10 or 20 μM DMH1 resulted in similar severe phenotypes and extensive hemorrhages (red). (E and J) Quantification of the outgrowth elongation that occurred between 0 and 3 dpa (E), and between 3 and 10 dpa (J) n=3; *P<0.05; ***P<0.01. The outgrowth elongation was calculated by measuring the change of the ray length between the defined time points. Each fin was represented by the measurements of the second, third and forth ray relative to the edge of both lobes (Image J software). The elongation of each individual ray was determined according to the following formula: 0 - 3 dpa, the length of the ray between the amputation plane and the tip of the outgrowth at 3 dpa;
3 - 10 dpa, the difference in length of the ray between 3 and 10 dpa.
The average values of the DMH1-treated animals were calculated as a percentage of control fins that were used as a reference. 0 - 3 dpa
con 1μM 10μM 20μM 3 - 10 dpa
% of outgrowth size relative to control
50 50 100 100 E con 1μM 10μM 20μM I J ns ns ns * *** *** 10 µM DMH1
A
C
D
B
3 dpa 0.1% DMSO"
3 dpa 3 dpa DMSO"
3 dpa 6 dpa 10 µM DMH1"
3 dpa 6 dpa 6 dpa 6 dpa 6 dpa 3dpa + 3d DMSO 3 dpa + 3d DMH1 0 50 100*
E
Figure S3. BMP signaling is required for the continuation of the initiated regeneration.
Live imaging of fins at 3 dpa at normal condition (A, B) and after additional 3 days of treatment with either 0.1% DMSO (C), or 10 μM DMH1 (D). The regenerate that was formed during the treatment (between 3 and 6 dpa) was twice smaller in DMH1-treated fish than in control fish. (E) Quantification of the outgrowth elongation that occurred between 3 and 6 dpa during the treatment. n=3, *P<0.05.
Outgrowth elongation was calculated by measuring the difference of the ray length between 3 and 6 dpa with Image J software. Each fin was represented by the measurements of the second, third and forth ray relative to the edge of both lobes.
The average values of DMH1-treated animals were calculated as a percentage of the control fins.
% of outgrowth size during the treatment (3 - 6 dpa)
50 μm
id3 mRNA
tie2:EGFP (anti-GFP)
control 3 dpa
50 μm
id2a mRNA
tie2:EGFP (anti-GFP)
control 3 dpa
2d+1d DMH1
2d+1d DMSO
pSmad1/5/8
(pSmad1/5/8) DAPI
0.35 0.3 0.25 0.2 0.15 0.1 0.05 0
id1 mRNA
tie2:EGFP (anti-GFP)
autofluorescence
3 dpa
B
2d+1d DMSO
2d+1d DMH1
2 dpa 2d+1d DMSO 2d+1d DMH1 3 dpa 2 dpa"
0.1% DMSO 10 µM DMH1 Expr ession le vel r ela tiv e t o β-ac tinid1 (qRT-PCR)
C
D
100 μm 100 μmFigure S6. id3, but not id2a, is expressed in the blood vessels of the rays during fin regeneration.
In situ hybridization and anti-GFP immunostaining of fin sections of transgenic fish with endothelial reporter. n>3
A
E
F
id1 mRNA
control 1 dpa control 2 dpa
G
H
I
J
Figure S5. id1 expression is rapidly suppressed by a pulse treatment with DMH1. (A) Experimental design.
(B) id1 expression was normalized to beta-actin2 value calibrated to 1. (C-D) pSmad1/5/8 is reduced after 1 day of DMH1. (E-F) id1 is expressed at 1 and 2 dpa in wound epidermis and blood vessels of control fins (arrows).
(G-J) In situ hybridization and anti-GFP immunostaining of transgenic fins with endothelial reporter. id1 expression is reduced after 1 day of DMH1 treatment in the distal outgrowth and blood vessels (arrow).
flk1:EGFP 10 dpa DMSO
flk1:GFP 1µM PTK787
10 dpa
flk1:GFP Whole-mount confocal immunofluorescence images of fins
% of Br dU-p ositiv e endothelial c ells DMH1 DMSO 5 15 20 10 ** 100 μm
2.5 dpa 3.5 dpa 2.5 dpa 3.5 dpa
0.1% DMSO 10 µM DMH1
"
"
3.5 dpa
6 dpa 8 dpa 6 dpa 8 dpa
0.1% DMSO 10 µM DMH1
6 dpa
8 dpa
tie2:EGFP Live imaging of the same fins at two time-points
1 mm 200 µm 100 µm
"
"
8 dpa
50 µm
tie2:GFP (α GFP) Blood cells (α Lamininβ2) Whole-mount confocal immunofluorescence images of fins
A
C
D
B
E
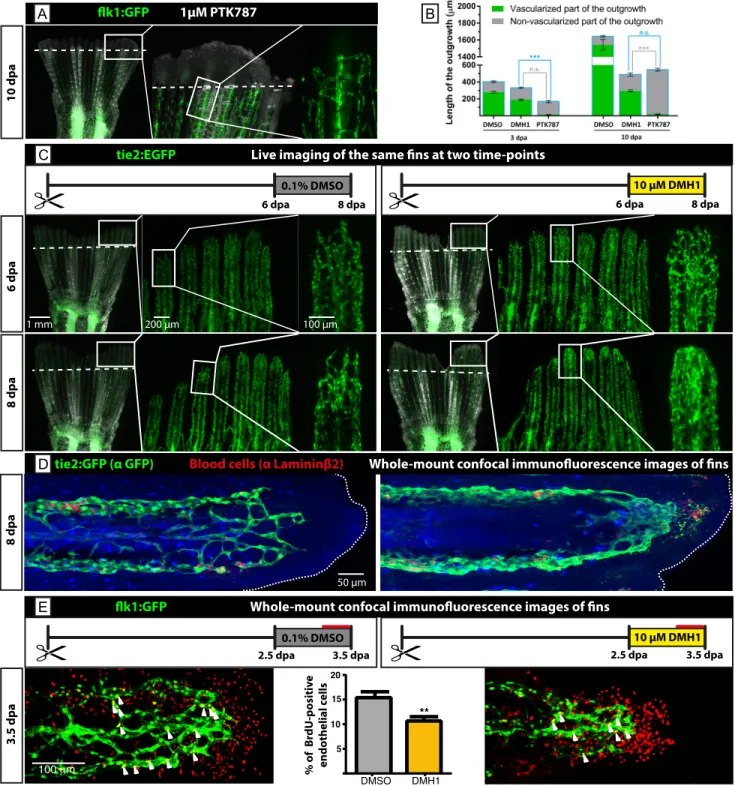
Figure S7. BMP is required for blood vessel maturation and stabilization.
(A) Inhibition of VEGF receptor using 1 µM PTK787 completely blocks the initiation of angiogenesis, representing a more severe phenotype compared to the one after DMH1 treatment shown in Fig. 4.
(B) Quantification of the total outgrowth length (blue outline of the bars) and its non-vascularized part in control, DMH1 and PTK787-treated fish; n>12 (4 rays of at least 3 fins), P<0.001.
(C) A pulse-treatment with DMH1 for 2 days during the advanced regeneration stage disrupts the structure of regenerating vasculature of the blastema. Before drug exposure, at 6 dpa, regular blood vessels were present in the blastema. After 2 days of DMH1 treatment, at 8 dpa, these blood vessels dilated and formed an unstructured cluster. (D) Confocal images of immunostained fin rays at 8 dpa shown in (C). The distal tip (dashed line) is oriented to the right. The vasculature of DMH1-treated blastema resembles a clump of endothelium (green). Fragments of GFP-labeled endothelial cells and some blood cells (red; C4 antibody against Laminin - β2, DSHB) accumulate below the fin margin beyond the blood vessels. n=4.
(E) Cell proliferation assay af ter 7h exposure to BrdU (red line in experimental design) during a single day of DMH1-treatment from 2.5 to 3.5 dpa. Confocal images were used for quantification. BrdU (red) and flk1:GFP (green) doubly positive nuclei were normalized to the total number of GFP-positive nuclei within the ray outgrowth.