https://doi.org/10.4224/21268565
Vous avez des questions? Nous pouvons vous aider. Pour communiquer directement avec un auteur, consultez la
première page de la revue dans laquelle son article a été publié afin de trouver ses coordonnées. Si vous n’arrivez pas à les repérer, communiquez avec nous à [email protected].
Questions? Contact the NRC Publications Archive team at
[email protected]. If you wish to email the authors directly, please see the first page of the publication for their contact information.
https://publications-cnrc.canada.ca/fra/droits
L’accès à ce site Web et l’utilisation de son contenu sont assujettis aux conditions présentées dans le site LISEZ CES CONDITIONS ATTENTIVEMENT AVANT D’UTILISER CE SITE WEB.
READ THESE TERMS AND CONDITIONS CAREFULLY BEFORE USING THIS WEBSITE.
https://nrc-publications.canada.ca/eng/copyright
NRC Publications Archive Record / Notice des Archives des publications du CNRC :
https://nrc-publications.canada.ca/eng/view/object/?id=2fb56485-aca5-4a76-9096-d81076a4b5b3 https://publications-cnrc.canada.ca/fra/voir/objet/?id=2fb56485-aca5-4a76-9096-d81076a4b5b3
NRC Publications Archive
Archives des publications du CNRC
For the publisher’s version, please access the DOI link below./ Pour consulter la version de l’éditeur, utilisez le lien DOI ci-dessous.
Access and use of this website and the material on it are subject to the Terms and Conditions set forth at
Proton Ceramic Cell (PCC) electrical performance and reliability under reversible (electrolysis) operation : status and prospects
NRC Energy, Mining and Environment (EME) Portfolio
Proton Ceramic Cell (PCC) Electrical
Performance & Reliability under Reversible
(Electrolysis) Operation: Status and Prospects
NRC Energy, Mining and Environment (EME) Portfolio
Yeong Yoo, Research Officer
12 July 2013
PPCC 2013 International Workshop on Protonic Ceramic Fuel Cells Status & Prospects, 10-12 July 2013, Montpellier, France
Presentation Outline
1. Introduction
2. Barium cerate based proton conducting SOFC
3. Proton conducting electrolyte based
Reversible SOFC
4. Chemical stability of BCZY
5. Performance degradation in SOEC
6. Summary
7. Acknowledgments
NRC Energy, Mining and Environment (EME) Portfolio 3
1. Introduction: About NRC
• Canada’s premier organization for research and development • Established in 1916
• OUR VISION: To be the most effective research and technology
organization in the world, stimulating sustainable domestic prosperity.
• OUR MISSION: Working with clients and partners, we provide innovation support, strategic research, scientific and technical services to develop and deploy solutions to meet Canada’s current and future industrial and societal needs.
• Research and innovation programs to support the sustainable growth of Canada's business sectors, reduce risk in early-stage technology
development, and strengthen the ability of Canadian firms to address areas of major public concern such as:
Economic development
Pressures on natural resources Climate change
Growing health care pressures
Increasingly complex security challenges Changing sense of communities
About NRC
• 2012-13 budget: $774M
• Over 4,000 employees and 650 volunteer and independent visitors
• Wide variety of disciplines and broad array of services
and support to industry
IRAP Research facilities
A critical component of Canada’s innovation
system, providing Canadian industry with:
• Market-driven research, technology development and
commercialization support services
• Regionally-accessible and nationally-linked points of entry
• A critical mass of leading-edge expertise, networks and
know-how
Fig. 1. Schematic Diagram of Fuel Cell Mode in Proton
Conductor based SOFCs
Ni-BCY Anode BSCF-BCY Cathode
BCY Electrolyte H+ 2e- H2 2H+ + 2e -Fuel: H2 H2O Air: 1/2O2 H+ H+ H+ H2O
Overall: H
2+
1/2O
2 H
2O
O2- 1/2O 2 + 2e- + 2H+ H 2ONRC Energy, Mining and Environment (EME) Portfolio
1)
Highest Proton Conductivity
10
-2~ 10
-3S/cm at 1000~600 ˚C
2) High transport number of protons
at 500-600 ˚C
3) but, poor mechanical strength and
low chemical stability under CO
2and steam to form BaCO
3(or
Ba(OH)
2) and CeO
24) Therefore, solid solutions with
Barium Zirconates
5) Comparison of chemical stability
and cell performance of anode
supported cells using BCG, BCY,
and BCZY proton- conducting
electrolytes
H
2Fueled SOFCs based on proton conducting electrolyte
Source: H. Iwahara et al., Solid State Ionics 168 (2004) 299-310.
Fabrication Procedures
Experimental
BCG
1)/BCY
2)/BCZY
3)electrolyte by
wet powder spray
Pressing
Anode
Co-firing
BSCF
4), PSN, LSCM, LSCF
cathodes by wet spray
Electrolyte
Sintering
Cathode
Characterization
Heat-treatment Pre-sintering 4Ba 0.5Sr0.5Co0.8Fe0.2O3- 1BaCe 0.8Gd0.2O3- 2BaCe 0.8Y0.2O3- 3BaCe 0.6Zr0.2Y0.2O3-Single cell assembly
(20 mm dia.)
NRC Energy, Mining and Environment (EME) Portfolio
Ni diffusion in BCG and BCY
Fig. 2. Scanning electron micrograph of as-sintered surface of BCG electrolyte on NiO-BCG anode (a) and BCY electrolyte on NiO-BCY anode (b), sintered at 1250 ℃.
Results and Discussion
(a)
(b)
BaGd
2NiO
5Chemical reactions to form secondary phases in
BCZY electrolyte co-sintered on NiO-BCZY anode
Ba(Ce
0.6Zr
0.2Y
0.2)O
2.9+ yNiO = yBaNiO
x+ Ba
1-y(Ce
0.6Zr
0.2Y
0.2)O
2.9-δ(1)
Ba(Ce
0.6Zr
0.2Y
0.2)O
2.9= BaO + 0.8(Ce
0.75Zr
0.25)O
2+ 0.1Y
2O
3(2)
NRC Energy, Mining and Environment (EME) Portfolio
Fig. 3. Scanning electron micrographs and EDX profiles of the fractured surfaces of
(a) BCY//NiO-BCY and (b) BCZY//NiO-BCZY bilayers sintered at 1250 and 1350℃, respectively.
Y Ni Ce O Ba Ni diffusion O Ce Ba Ni Zr Y Negligible Ni diffusion
(a) BCY//NiO-BCY
(b) BCZY//NiO-BCZY
Ni diffusion and secondary phase formation in BCY sintered on NiO-BCY
Fig. 4. SEM image (a) and EDS maps for O (b), Ni (c), Y (d), Ba (e), and Ce (f) from the fractured surface of BCY thin-film electrolyte on a porous NiO-BCY anode sintered at 1200 °C for 2 h in air.
Kα1 Kα1 Lα1 Lα1 Lα1
(a)
(d)
(e)
(f)
(c)
(b)
NRC Energy, Mining and Environment (EME) Portfolio
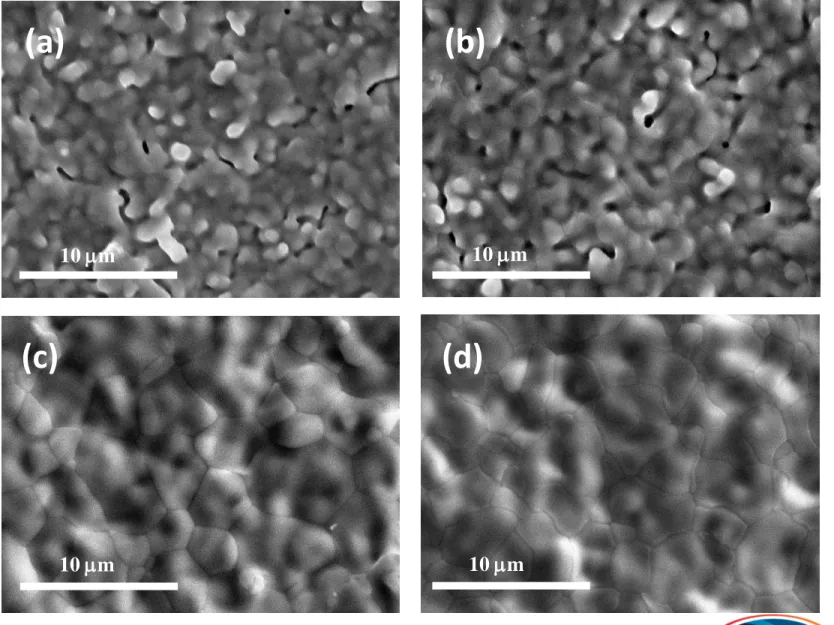
Densification of BCZY sintered on NiO-BCZY anode
(a) (b)
Fig. 5. SEM photos of the surface of BCZY on NiO-BCZY sintered at (a) 1300, (b) 1325, (c) 1350, and (d) 1400 °C for 2 h in air.
10 m 10 m 10 m 10 m
(a)
(d)
(b)
(c)
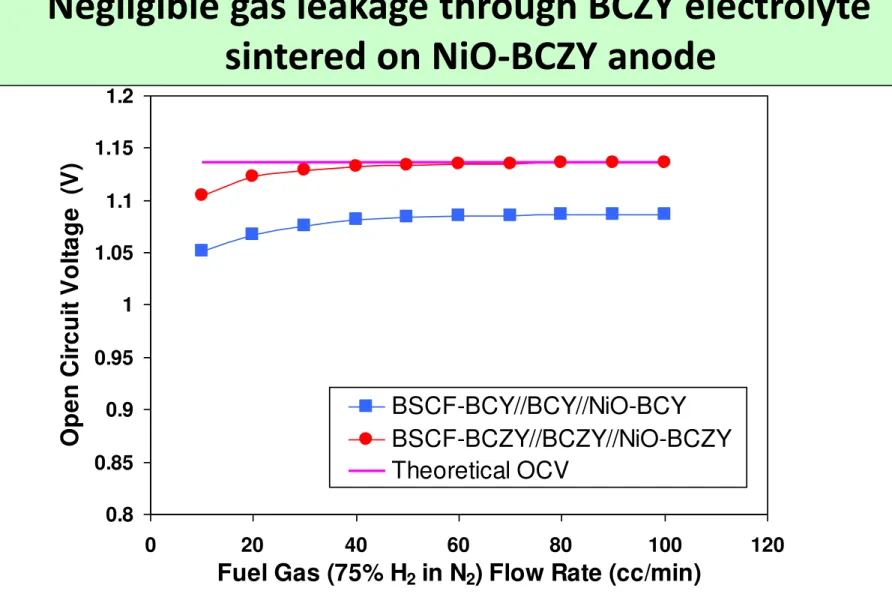
Fig. 6. OCVs of the single cells under 75% H
2in N
2as fuel and air
as oxidant as a function of fuel gas flow rate at 600 °C.
0.8 0.85 0.9 0.95 1 1.05 1.1 1.15 1.2 0 20 40 60 80 100 120
Fuel Gas (75% H2 in N2) Flow Rate (cc/min)
O p e n C ir c u it V o lt a g e (V ) BSCF-BCY//BCY//NiO-BCY BSCF-BCZY//BCZY//NiO-BCZY Theoretical OCV
Negligible gas leakage through BCZY electrolyte
sintered on NiO-BCZY anode
NRC Energy, Mining and Environment (EME) Portfolio
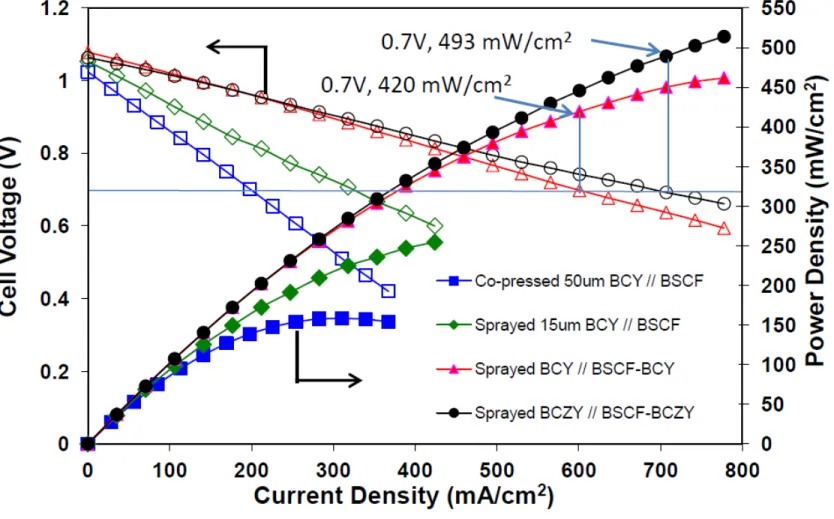
Effect of electrolyte densification and composite cathode
Fig. 7. I-V Characteristics of single cells at 600 C under humid 75% H2 in N2 (3% H2O) as the fuel gas and humid air as the oxidant gas at a gas flow rate of 100 mL min-1.
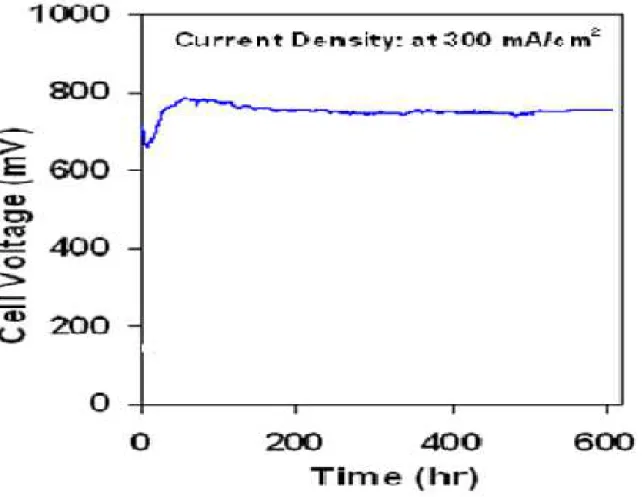
Durability of BCZY based single cell
Fig. 8. Degradation of a single cell performance of BSCF-BCZY//BCZY, 10 µm thickness //NiO-BCZY at 600 C under humid 75% H2 in Ar with a gas flow rate of 50 ml min-1.
NRC Energy, Mining and Environment (EME) Portfolio
Fig. 9. Schematic Diagram of Electrolysis Mode in Reversible SOFCs
3. Proton conducting electrolyte based
Reversible SOFC
Ni-BCZY Cathode BSCF-BCZY Anode
BCZY Electrolyte H+ 2e- H2 2H+ + 2e- H2 H2 H2O H+ H+ H+ 1/2O 2
Overall: H
2O
H
2+ 1/2O
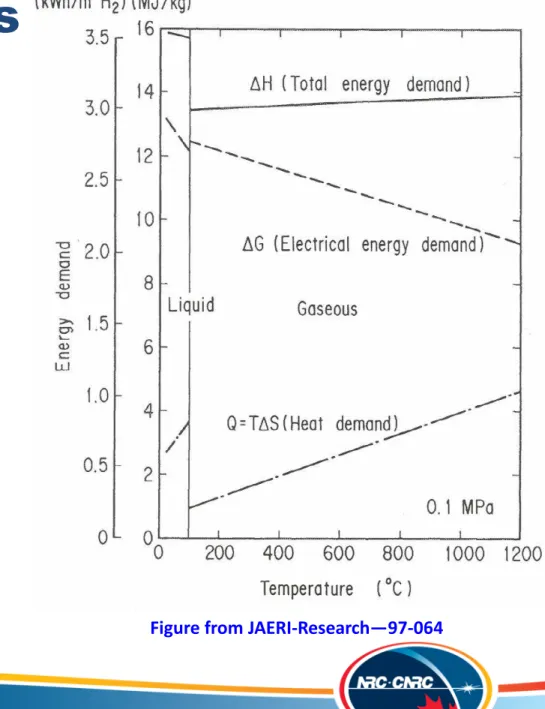
2 2H+ + 2e- H 2O + 1/2O2 ElectricityWhy High Temperature
Steam Electrolysis?
Figure from JAERI-Research—97-064
1) Higher operating
temperature:
Reduces the
electrical energy
requirement
2) > 100 % electrical
efficiency?
Reversible SOFCs
NRC Energy, Mining and Environment (EME) Portfolio
Why Proton Conductive Reversible SOFCs?
1) Lower operation temperature, resulting in lower
material costs and lower degradation rates
2) Convenient production of dry and high purity hydrogen
without additional gas separation systems, in comparison
to oxygen ionic conductor-based reversible SOFCs
H. Iwahara et al., Solid State Ionics 3/4 (1981) 359-363
Proton conductor-based Reversible SOFCs
K. Katahira et al., Solid State Ionics 138 (2000) 91-98 Fig. 10. Hydrogen evolution rate vs. current density at
900 C. Electrolyte: (1) SrCe0.90Sc0.10O3-, (2) SrCe0.95Sc0.05O3- (Broken line shows theoretical rate.
Cell: H2O 1 atm, Pt l electrolyte l Pt, Ar)
Fig. 11. Hydrogen evolution rate vs. current density. Broken line shows theoretical rate.
NRC Energy, Mining and Environment (EME) Portfolio
Proton conductor-based Reversible SOFCs
Fig. 12. Cross-section of the experimental apparatus.
Fig. 13. Change in hydrogen production rate under various partial pressures of water vapor at 460 C and current density of 2.4 mA cm-2.
Oxygen ionic conductor-based Reversible SOFCs
Fig. 14. I-V curves of single cells with BSCF-SDC or LSM as an oxygen electrode on YSZ electrolyte/NiO-
YSZ anode, operating at 850 C under SOEC and SOFC modes.
NRC Energy, Mining and Environment (EME) Portfolio
Proton conductor-based Reversible SOFCs
Fig. 15. I-V curves of reversible SOFCs of Ni-BCZY //BaCe0.5Zr0.3Y0.2O3-//SSC-BCZY measured at various temperatures with H2 and 50%H2O-50%Air
in hydrogen and oxygen electrodes, respectively.
Fig. 16. Impedance spectra of reversible SOFCs with H2 and 50%H2O-50%Air in hydrogen
and oxygen electrodes, respectively.
M. Ni et al. Journal of Power Sources 177 (2008) 369-375
Modeling for concentration overpotentials of
NRC Energy, Mining and Environment (EME) Portfolio
Proton conductor-based Reversible SOFCs
M. Ni et al. Journal of Power Sources 177 (2008) 369-375
Fig. 17. Theoretical modeling results in electrolysis mode: (a) concentration overpotentials of
electrodes and (b) I-V characterisitics
Fig. 18. Theoretical modeling results in fuel cell mode: (a) concentration overpotentials of
Fig. 19. Performance of a BCZY-based single cell in both of fuel cell and electrolysis modes at 600 °C under humid air (2.76% H2O) at the air electrode and humid 48.5% H2
in Ar (2.76% H2O) at the hydrogen electrode with a gas flow rate of 120 ml min-1, respectively with the ASR calculation using the area of the air electrode.
Y. Yoo et al. Journal of Power Sources 229 (2013) 48-57
NRC Energy, Mining and Environment (EME) Portfolio
Fig. 20. Optical microscopic image (X100) of the surface of thin BCZY electrolyte deposited on a single cell after cooling from a high temperature steam electrolysis test
at 600 C under humid gas atmosphere.
4. Chemical Stability of BCZY
Fig. 21. Scanning electron micrographs of the surface morphology of BCZY electrolyte pellets (a) as sintered and (b) after heating at 200 °C for 24 h
under humid air (3% H2O) with a gas flow rate of 100 ml min-1.
Chemical Stability
NRC Energy, Mining and Environment (EME) Portfolio
Fig. 22. Elemental analysis by SEM/EDS for 5 selected areas on a sintered BCZY pellet after heating at 200 °C for 24 h under humid air (3% H2O) with a gas flow rate of 100 ml min-1.
Chemical Stability
Ba Ce Zr Y O C BCZY 20.00 12.00 4.00 4.00 60.00 Spectrum 1 23.23 12.84 3.49 2.99 57.45 Spectrum 2 5.99 3.28 1.28 1.31 78.94 9.20 Spectrum 3 18.32 0.96 0.41 0.44 65.85 14.01 Spectrum 4 15.26 0.35 0.00 0.00 67.17 17.22 Spectrum 5 23.29 17.61 3.80 3.47 51.83Chemical Stability
Fig. 23. (a) X-ray diffraction patterns of BCZY sintered pellets heat-treated under different conditions and (b) reaction products formed at 200 C
under humid air or in boiling water (a)
Ba(Ce
0.6Zr
0.2Y
0.2)O
2.9+ H
2O = Ba(OH)
2+
0.8(Ce
0.75Zr
0.25)O
2+ 0.1Y
2O
3(5)
Ba(OH)
2+ CO
2= BaCO
3+ H
2O (6)
Ba(Ce
0.6Zr
0.2Y
0.2)O
2.9+ CO
2= BaCO
3+
0.8(Ce
0.75Zr
0.25)O
2+ 0.1Y
2O
3(7)
(b)NRC Energy, Mining and Environment (EME) Portfolio
Chemical Stability
Fig. 24. Thermodynamics of chemical reactions related to BaCeO3 and BaZrO3 under CO2 and H2O as a function of temperatures.
5. Performance degradation in SOEC
Long term degradation
Main issue for the viability of SOEC technology & Required
further improvement prior to commercialization.
Higher electrode polarization increase during electrolysis
compared to fuel cell operation.
Delamination or microstructure degradation at the
electrode/electrolyte interface.
Short-term degradation resulting from high current densities
or high steam concentration at the air/steam electrode.
Cell voltage degradation attributed to ohmic degradation.
Kirkendall voids in the electrolyte layer: Mass transport of
two or more species with different mobility leaves pores
behind.
NRC Energy, Mining and Environment (EME) Portfolio
5. Performance degradation in SOEC
Degradation processes in electrolysis mode for oxygen
conductor-based SOFCs:
F. Tietz et al, Journal of Power Sources 223 (2013) 129-1351) Enhanced diffusion processes in the electrolyte
and the formation of Kirkendall voids,
2) Formation of oxygen in the electrolyte,
3) Different oxygen activity in the oxygen electrode
and hence different catalytic activity for oxygen
reduction and oxygen evolution as SOFC and SOEC, respectively,
4) Delamination or microstructure degradation of the electrolyte /
oxygen electrode interface,
5) Enhanced evaporation of Ni(OH)
2due to higher p(H
2O) in the fuel gas,
6) Enhanced silicon poisoning of the hydrogen electrode due to higher
5. Performance degradation in SOEC
Fig. 25. Calculated evolution of the operation cell voltage for different degradation rates in % of
the initial cell voltage (1.06 V) per 1,000 h.
J. Schefold et al., J. Electrochem. Soc. 159 (2) A137-A144 (2012)
Fig. 26. Cell voltage during operation of a single cell of LSCF//CGO/YSZ//Ni-YSZ with j= -1.0 Acm-2
at 772-784 C .
NRC Energy, Mining and Environment (EME) Portfolio