HAL Id: hal-01551624
https://hal.archives-ouvertes.fr/hal-01551624
Submitted on 30 Jun 2017
HAL is a multi-disciplinary open access
archive for the deposit and dissemination of
sci-entific research documents, whether they are
pub-lished or not. The documents may come from
teaching and research institutions in France or
abroad, or from public or private research centers.
L’archive ouverte pluridisciplinaire HAL, est
destinée au dépôt et à la diffusion de documents
scientifiques de niveau recherche, publiés ou non,
émanant des établissements d’enseignement et de
recherche français ou étrangers, des laboratoires
publics ou privés.
Interaction of graphene-related materials with human
intestinal cells: an in vitro approach
Mélanie Kucki, Patrick Rupper, Cyril Sarrieu, Manuela Melucci, Emanuele
Treossi, Anika Schwarz, Verónica León, Annette Kraegeloh, Emmanuel
Flahaut, Ester Vázquez, et al.
To cite this version:
Mélanie Kucki, Patrick Rupper, Cyril Sarrieu, Manuela Melucci, Emanuele Treossi, et al.. Interaction
of graphene-related materials with human intestinal cells: an in vitro approach. Nanoscale, Royal
Society of Chemistry, 2016, 8 (16), pp.8749-8760. �10.1039/c6nr00319b�. �hal-01551624�
O
pen
A
rchive
T
OULOUSE
A
rchive
O
uverte (
OATAO
)
OATAO is an open access repository that collects the work of Toulouse researchers and
makes it freely available over the web where possible.
This is an author-deposited version published in :
http://oatao.univ-toulouse.fr/
Eprints ID :
16743
To link to this article :
DOI: 10.1039/c6nr00319b
URL :
http://dx.doi.org/10.1039/C6NR00319B
To cite this version :
Kucki, Mélanie and Rupper, Patrick and
Sarrieu, Cyril and Melucci, Manuela and Treossi, Emanuele and
Schwarz, Anika and León, Verónica and Kraegeloh, Annette and
Flahaut, Emmanuel and Vázquez, Ester and Palermo, Vincenzo and
Wick, Peter
Interaction of graphene-related materials with human
intestinal cells: an in vitro approach.
(2016) Nanoscale, vol. 8 (n°
16). pp. 8749-8760. ISSN 2040-3364
Any correspondence concerning this service should be sent to the repository
administrator:
[email protected]
Cite this: Nanoscale, 2016, 8, 8749
Received 13th January 2016, Accepted 25th March 2016 DOI: 10.1039/c6nr00319b www.rsc.org/nanoscale
Interaction of graphene-related materials with
human intestinal cells: an in vitro approach†
M. Kucki,*aP. Rupper,bC. Sarrieu,cM. Melucci,dE. Treossi,dA. Schwarz,eV. León,f A. Kraegeloh,eE. Flahaut,cE. Vázquez,fV. Palermodand P. Wick*a
Graphene-related materials (GRM) inherit unique combinations of physicochemical properties which offer a high potential for technological as well as biomedical applications. It is not clear which physico-chemical properties are the most relevant factors influencing the behavior of GRM in complex biological environments. In this study we have focused on the interaction of GRM, especially graphene oxide (GO), and Caco-2 cells in vitro. We mimiked stomach transition by acid-treatment of two representative GRM followed by analysis of their physicochemical properties. No significant changes in the material properties or cell viability of exposed Caco-2 cells in respect to untreated GRM could be detected. Furthermore, we explored the interaction of four different GO and Caco-2 cells to identify relevant physicochemical pro-perties for the establishment of a material property–biological response relationship. Despite close inter-action with the cell surface and the formation of reactive oxygen species (ROS), no acute toxicity was found for any of the applied GO (concentration range 0–80 µg ml−1) after 24 h and 48 h exposure.
Graphene nanoplatelet aggregates led to low acute toxicity at high concentrations, indicating that aggre-gation, the number of layers or the C/O ratio have a more pronounced effect on the cell viability than the lateral size alone.
Introduction
Graphene as the most prominent member of the family of 2D materials has attracted enormous attention due to its unique combination of properties which offers a high technological potential for a broad variety of applications.1,2 Graphene and
several Graphene-related materials (GRM) are commercially available in various degrees of quality. Generally GRM can be produced by top-down approaches,3–6 bottom up
approaches,7–9 reduction or functionalisation of other
GRM10,11and transformation of other carbon nanomaterials.12
Graphene oxide (GO), a subclass of GRM exhibiting oxygen-containing functional groups, has been identified as a promis-ing candidate for biomedical applications such as tissue engineering, drug delivery, cancer treatment and bio-sensing.13–15The presence of oxygen functional groups
facili-tates the dispersibility in aqueous environment and enables the covalent functionalization with several different drugs, polymers and fluorescence labels by various chemical routes.16,17 However, the public acceptance of every new
technology is always coupled to its benefits and safety. The rapid development of graphene-based technology and expected large distribution has raised a lively safety discussion. There is great interest and attention on graphene not only in the academic community, but also in social media.18 Despite a
steadily increasing number of publications regarding the bio-logical effects of GRM, especially GO, there is little consensus on the effect on human and environmental health.19Both the
inconsistency of experimental results and a generic use of the term graphene for several different GRM have led to con-fusion.20A recently proposed classification framework aims to
group different GRM by three main parameters (the average lateral dimension, the number of layers and the amount of oxygen as an indicator for oxidation) and to understand the relationship between GRM-structure and biological effects.21
Similar to other nanomaterials the physicochemical properties and quality of GRM can highly influence the type and strength
†Electronic supplementary information (ESI) available: Material characterization details, light microscopy images of Caco-2 cells, cell-free control tests for MTS and DCF assay. See DOI: 10.1039/c6nr00319b
aLaboratory for Particles-Biology Interactions, Swiss Federal Laboratories for
Materials Science and Technology (Empa), Lerchenfeldstrasse 5, CH-9014 St. Gallen, Switzerland. E-mail: [email protected], [email protected]
bLaboratory for Advanced Fibers, Swiss Federal Laboratories for Materials Science
and Technology (Empa), Lerchenfeldstrasse 5, CH-9014 St. Gallen, Switzerland
cUniversité de Toulouse; CNRS, UPS, INP; Institut Carnot CIRIMAT, 118,
Route de Narbonne, F-31062 Toulouse Cedex 9, France
dIstituto per la Sintesi Organica e la Fotoreattività, Consiglio Nazionale delle
Richerche (CNR), Via P. Gobetti 101, 40129 Bologna, Italy
eNano Cell Interactions, INM - Leibniz Institute for New Materials, Campus D 2.2,
D-66123 Saarbruecken, Germany
fDepartamento de Química Orgánica, Facultad de Ciencias y Tecnologías
of the biological response. Despite several in vivo studies, as summarized and analysed recently by Bussy et al.22a
system-atic investigation to correlate GRM properties and their bio-logical effects with respect to the exposure route (inhalation, oral, dermal, intravenous) as well as their fate within the exposed organism is missing. From the occupational health perspective there are several exposure routes for workers towards GRM: inhalation, dermal contact and/or ingestion. Among these, inhalation is regarded as the most relevant way of unintended entrance of GRM into the human body. There-fore it is not surprising that a majority of published studies, except those addressing intravenous application for bio-medical research, has addressed the possible impact of GRM on cells of the respiratory tract in vitro, as well as in vivo.23,24
Nevertheless, information on the fate of these materials in the lungs and the possible induced biological effects is very limited. Next to the lungs, scant attention has been given to other biological barriers which are likely exposed to GRM. The gastro-intestinal (GI) tract can not only be exposed by direct ingestion of GRM, but also by indirect ingestion of formerly inhaled GRM. Trapped in the mucus of the respiratory system foreign bodies are transported upwards by ciliary movement, a process called the “mucociliary elevator”, and can be finally either coughed out or swallowed down. In addition, potential application of GRM in food packaging and contamination of drinking- or surface water, are likely scenarios how GRM could gain access to the human GI-tract.
Nanomaterials that enter the alimentary tract are exposed to a series of different environments before they reach the intestine. Several factors such as pH, ionic strength, digestive enzymes, surface active compounds, physical forces, type and amount of food intake as well as microbes have the potential to induce changes to the physicochemical properties of the nanomaterial. Due to this complexity it is not clear which factors have the strongest influence on the nanoparticles. However, it is very likely that the acidic conditions within the stomach are among the most relevant factors. As every change in the physicochemical properties of the GRM has the poten-tial to modulate the induced biological response, it is impor-tant to assess any possible change that can occur before the material reaches the cells or tissue of interest. Nevertheless, there is lack of information regarding GRM behaviour under physiologically relevant acidic conditions. Furthermore there has been no detailed investigation of the possible impact of GRM on the gastro-intestinal tract. Only very few studies with a small selection of GRM have addressed the inter-action of GRM with intestinal cells in vitro.25 However, the
mucosal barrier of the intestinal tract is one of the most important biological barriers within the human and animal body. It serves multiple tasks, such as nutrient uptake, defence against pathogenic bacteria and maintenance of tol-erance against commensal bacteria. Loss of intestinal homeostasis can result in uncontrolled entrance of patho-gens and food antipatho-gens as well as in reduced nutrient supply, which in turn can lead to severe health compli-cations and disturbance of the entire organism.
Therefore the aim of this study is to acquire a systematic understanding of the biological effects of GRM on cells of the human intestinal tract. For this purpose we selected and characterized graphene oxides (GO) of different sources and quality and explored their interaction with non-confluent Caco-2 cells. The Caco-2 cell line is derived from human colon adenocarcinoma and one of the gold-standards for in vitro studies regarding the intestinal tract with wide-spread appli-cation in pharmaceutical research. The selection of GO pre-sented here offers a direct comparison of commercial and research grade materials, research-grade GO obtained by the same production method but with different lateral dimen-sions, as well as of commercial GO obtained from two different starting materials. To mimic stomach transition, exemplarily one selected GO, as well as graphene nanoplatelets aggregates (GNP) as benchmark GRM, were incubated under physiologically relevant acidic conditions in vitro followed by material characterization, especially focusing on determi-nation of the surface functionalization (C/O ratio), introduc-tion of defects and changes in material morphology. As there is no information available on the exposure dose of GO in the intestinal tract we selected a rather broad dose range up to a concentration of 80 µg GO per ml. It has to be noted that 80 µg GO per ml is already assumed to reflect an over-dose situation and that the expected exposure dose range is probably signifi-cantly lower. The obtained results will help to identify relevant physicochemical properties for the establishment of a material property–biological response relationship.
Results and discussion
Physicochemical properties of GO and GNP
To understand the correlation of the physicochemical pro-perties of GO and the biological effects, we selected a set of four different GO samples produced by modified Hummers method. Two GO samples (GO1, GO4) were obtained from commercial sources in addition to two graphene oxides (GO2, GO3) produced in research laboratory. GO1, GO2 and GO3 were derived from graphite, whereas graphitic nanofibers (GANF©) were the starting material for GO4. As exfoliation is connected to the application of ultra-sonication which leads to random fragmentation of the GO sheets,26 all GO samples exhibited poly-dispersed lateral sheet size. The commercial graphene oxide GO1 showed the largest lateral size distri-bution with a range of several tens of micro-meters. The com-mercial graphene nanoplatelets (GNP), applied as benchmark material for the digestion procedure, consisted of small and large flakes which were already fused to larger aggregates when received as powder from the manufacturer (see ESI†). Dispersion of hydrophobic GNP in water was improved by the application of sodium cholate, salt of a natural primary bile acid which is present in the human intestine and plays an important role in the digestive process, especially in the absorption of dietary fats. Bile acids are frequently used to dis-perse graphene in aqueous dispersions.27,28Short-time
bath-sonication was applied to further improve dispersion. Never-theless, short-time bath-sonication (<10 min) did not lead to dissociation of the graphene layers. Further sonication (long duration or high energy) was not applied in order to prevent significant changes in the material properties.
All graphene oxides did not require additional treatment and were either already obtained as aqueous dispersions or dispersed in endotoxin-free ultra-pure water. An overview of the physicochemical properties of the applied GRM is given in Table 1.
Physicochemical properties after in vitro digestion (acid-treatment)
Based on the fact that all nanomaterials entering the GI-tract have to pass through the stomach prior to any contact with intestinal cells, we explored the impact of physiological rele-vant acidic conditions as present in the stomach on the physicochemical properties of graphene-related materials in vitro. For this purpose, we selected two different commer-cially available GRM which highly differed in their physico-chemical properties. GO1 was selected as representative for graphene oxides, whereas graphene nanoplatelet (GNP) aggre-gates were used to cover GRM with significantly different pro-perties, especially carbon-to-oxygen ratio (C/O) and layer number. Selected GRM were incubated in 0.1 M hydrochloric acid (HCl) for 2 hours at 37 °C under mild agitation. As a control, aliquots of the same GRM were incubated in water instead of hydrochloric acid at similar conditions to exclude any changes in the material properties independent of the acidic conditions. After treatment, GRM were harvested by cen-trifugation, re-dispersed and neutralized in phosphate buffered saline (PBS, pH 6.8), washed and transferred to
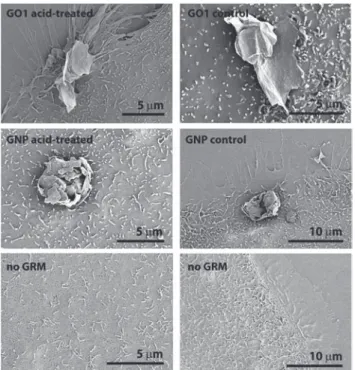
ultra-pure-water prior to material characterization. Physicochemical characterization of the acid-treated GRM and the respective control (water-treated) GRM was performed by SEM analysis, zeta-potential measurement, X-ray photoelectron spectroscopy (XPS) analysis and Raman spectroscopy. Results are summar-ized in Table 2. SEM analysis did not indicate major changes in the GRM morphology, neither for GO1, nor for GNP as shown in Fig. 1. Control samples and acid-treated samples showed no obvious differences. The zeta-(ζ)-potential of GO1 (as received & acid-treated) in ultra-pure water with potassium chloride (KCl) as background electrolyte showed identical values of −39 mV, giving no hints towards altered surface charge. The zeta-(ζ)-potential of GNP was between −50 and −62 mV, and therefore more negative than that of GO1. The presence of sodium cholate, which was used as surfactant
Table 2 Physicochemical properties of GRM after acid-treatment
Sample C/Oa Zeta-(ζ)-potentialb(mV) Raman ID/IGbands (633 nm)
GO1 As received 1.7 ± 0.1 −39.4 ± 1.3 N.D. Control 1.9 ± 0.1 N.D. 1.19 ± 0.08 Acid treated 1.8 ± 0.1 −39.7 ± 3.7 1.22 ± 0.12 GNPc As received 24.0 ± 2.5 −62.6 ± 1.9 N.D. Control 25.0 ± 2.5 −54.6 ± 4.1 0.37 ± 0.07 Acid treated 24.4 ± 2.5 −56.7 ± 1.8 0.31 ± 0.11
aDetermined from the XPS survey spectra. The estimated error is ±0.1
and ±2.5 for GO1 and GNP samples, respectively, and results from the uncertainty of the determination of the elemental concentrations from the XPS in the order of 10% under our experimental conditions.
bMeasured in ultra-pure water with potassium chloride (KCl) as
background electrolyte. cContains primary bile salt sodium cholate (SC); N.D. = not determined.
Table 1 Overview on the physicochemical properties of applied graphene-related materials (GRM)
Material type
Graphene oxide
Aggregated graphene nanoplatelets
GRM GO1 GO229 GO329 GO4c GNP
Source Commercial Research Research Commercial Commercial
Preparation Modified Hummers method Modified Hummers method Modified Hummers method Modified Hummers method Microemulsion Starting material Graphite Natural graphite Natural graphite Graphite nanofiber
(GANF©)
Natural graphite Size distribution/
lateral dimension 1–40 µm (SEM)(300–800 nm, AFMb) 360 ± 188 nm (AFM),some flakes larger
than 1 µm
150 ± 44 nm (AFM) 20 nm–1.4 µm (TEM) Aggregate size 1–10 µm; mean ∼5 µm (SEM) (1–2 µm, AFMb)
Number of layer/ thickness
Few to single layer (0.7–1.2 nmb)
Monolayer/ 1.1 ± 0.1 nm
Monolayer/ 1.1 ± 0.1 nm
Few to single layer Aggregate thickness up to 5 µm; 5–10 layers (shape of the Raman 2D band) (<4 layers; <4 nmb) Raman ID/IG ratio 1.19 ± 0.08 (633 nm)
0.96 ± 0.02 (532 nm) 1.34 ± 0.06 (633 nm) 1.06 ± 0.01 (532 nm) 1.30 ± 0.06 (633 nm) 0.97 ± 0.02 (532 nm) 0.81 ± 0.05 (n = 5) 0.37 ± 0.07 (633 nm) 0.17 ± 0.11 (532 nm) C/O ratio 1.7 ± 0.1 (XPS) 1.9 1.9 2.61 (XPS) 24.0 ± 2.5 (XPS) Zeta-potential (mV)a −39.4 ± 1.3 −44.0 ± 0.2 −43.9 ± 1.4 −37.7 ± 0.4 −62.6 ± 1.9
aMeasured in ultra-pure water with potassium chloride (KCl) as background electrolyte.bAccording to information given by the manufacturer;
further details are given in the ESI.cFurther characterization data for GO4 can be found in Kurapati et al.30
Nanoscale Paper
to achieve dispersion of GNP in aqueous solution, had no to minor influence on the zeta-(ζ)-potential of the GNP (see Table S4b in ESI†) and is therefore not responsible for the highly negative values. After acid-treatment of GNP, the absolute zeta-(ζ)-potential was reduced to a slightly smaller value.
The elemental composition of the GRM, in particular the carbon to oxygen ratio (C/O) was characterized by XPS. For each of the two materials, GO1 and GNP, the surface of the material was characterized in the as received form, the control sample, as well as after acid-treatment. In addition, high resolution spectra for the elements carbon and oxygen were recorded in order to detect possible chemical changes. For the GO1 sample as received, the survey scan revealed the elements carbon and oxygen in significant concentrations, whereas small amounts (≤1 atomic%) of nitrogen, silicon and sulfur were also detected, probably resulting from the GO production and/or storage. For the GNP sample as received, only the elements carbon and oxygen were present. Table 2 summarizes the C/O ratios calculated from the oxygen and carbon concen-trations determined from the XPS survey spectra. The C/O ratio for the GO1 sample as received resulted to 1.7, in agreement with literature values for commercial graphene oxide.31–33 A small increase of the C/O ratio was found after GO1 was acid-treated as well as for the control sample. For further infor-mation see Fig. S5 in the ESI.† As expected, the C/O ratio was significantly higher (above 20) for the GNP samples. Only small concentrations of oxygen were present in the GNP. No significant differences were found between the GNP sample as received, the acid-treated GNP and the control GNP sample. The values are all well within the estimated uncertainty of ±2.5. Further information to the XPS measurements is given in the ESI.†
Raman spectroscopy of GO1 and acid-treated GO1 did not give evidence for significant differences after treatment of GO1 under physiological relevant acidic conditions (cf. Fig. S6-c and S6-d in ESI†). However in the case of GNP, a decrease in the
D/G intensity ratio, on average 25%, was evidenced after acid-treatment (cf. Fig. S6 in ESI†). Such a decrease of the ratio for a constant G peak width usually corresponds to a lower level of defects in the samples.34This could result of a selective degra-dation of the sites containing the highest density of defects, sites which should also have the highest chemical reactivity. But, according to the statistical tests performed on the measurements (cf. Experimental section), the possibility that this observation comes from the heterogeneity of the starting GNP material (evidenced by measuring the Raman signal at different places) cannot be excluded.
The probability that the GRM was not modified by the treat-ment is in fact about 8%, which is not negligible. Indeed, as presented in Table 2, the standard deviation on the measured D/G intensity ratio is very high, about 30%.
In summary, we can conclude that the acid-treatment of the two selected GRM, GO1 and GNP, did not result in major changes in the material properties. At least for the GO this is not surprising, as production of GO by classical methods such as Brodie, Staudenmaier and Hummers method involves sulfu-ric acid (H2SO4) and nitric acid (HNO3).3 Nevertheless, our
results demonstrate that pristine GO and GNP are relatively inert materials which appear to be not highly affected by the acidic conditions ( pH ≤ 2, fasted state, 2 h, 37 °C) during stomach transition.
Interaction of acid-treated GRM with the Caco-2 cell surface In a next step we assessed the interaction of acid-treated and control GRM derived from the in vitro digestion procedure with the Caco-2 cell surface. As the physicochemical character-ization of acid-treated and control GRM did not reveal major changes in material properties, we did not expect significant differences in the interaction with the cell surface after exposure to GRM. As shown in Fig. 2 the interaction of the acid-treated GRM and the cell surface showed no distinctive features in comparison to the respective control GRM. For GO1, in both samples (acid-treated and control) GO sheets were primarily found folded and wrinkled, reminiscent of crumbled paper. There were no visible hints towards a possible damage of the cell surface by the GO sheets. Cell morphology of Caco-2 cells after exposure to GO1 samples (acid-treated and control samples) did not show significant alterations in com-parison of untreated Caco-2 cells. Similar observations were made for all GNP samples. GNP aggregates of different shapes but in the usual size range of 1–10 µm were found associated with the Caco-2 cell surface. For both GO1 and GNP a few observations were made which might be hints towards attempts of cellular uptake as shown in Fig. S7 and S8 in ESI.† If these events are real uptake events or rather overgrowth of the GRM has to be clarified by detailed analysis in future investigations.
Cell viability of Caco-2 cells after exposure to acid-treated GRM The possible impact of GRM exposure on Caco-2 cells was assessed by measurement of the metabolic activity via MTS
(3-(4,5-dimethylthiazol-2-yl)-5-(3-carboxymethoxy-phenyl)-2-(4-Fig. 1 Representative SEM images of the GRM morphology with or without acid-treatment.
sulfophenyl)-2H-tetrazolium, inner salt) assay. Cytotoxic poten-tial of a sample was reached when the metabolic activity decreased to less than 70% of the control cells. For GO1, exposure to the acid-treated sample or the respective control sample for 24 h resulted in a concentration dependent slight decrease in mean viability of Caco-2 cells as shown in Fig. 3. Nevertheless, even at highest GO concentration applied (80 µg GO per ml) the cell viability remained above 80% in relation to the unexposed control cells. For GNP, the decrease in cell via-bility was more pronounced. Mean cell viavia-bility decreased to around 60% for the highest concentration applied, indicating low acute toxicity. Comparison of the viability of Caco-2 cells exposed to acid-treated GRM and the respective water-treated control sample did not reveal any differences in metabolic activity. Light microscopy images also showed the absence of visible differences in cell morphology between control cells
and cells exposed to water-treated or acid-treated GRM (see Fig. S9 and S10 in ESI†). Therefore, as confirmed by material characterization, incubation of GRM under acidic conditions reflecting the pH value in the stomach did not result in signifi-cant changes of the material properties or the cellular activity of exposed intestinal cells in vitro. Nevertheless, prior to this study it has not been demonstrated yet that the acidic con-ditions in the stomach do not affect graphene oxide properties. The results indicate that acid pre-treatment of pristine GO (without further functionalization) to mimic stomach tran-sition is not mandatory, at least when the production method already involved treatment with acids.
Cell surface interaction of different GO samples
Detailed characterization and knowledge of the material pro-perties of GRM enables a comprehensive correlation of the physicochemical properties and possible biological effects. To acquire a systematic understanding of the interaction of a certain GRM type with human intestinal cells, non-confluent Caco-2 cells were exposed to the above mentioned selection of different graphene oxides (GO1–4). In addition, untreated GNP was implemented for comparison. Based on the results obtained previously, the following investigations were per-formed without acid-treatment, as the involved GO samples were produced by modified Hummers method. Non-confluent Caco-2 cells were exposed directly to the untreated GO samples.
SEM analysis of Caco-2 cells after exposure to different GO samples showed a close interaction of the GO sheets and the cell membrane. Well exfoliated GO sheets showed the ten-dency to align in parallel to the cell surface, especially in areas where the cell surface was relatively smooth with a low amount of cell protrusions. In several cases GO sheets could only hardly be distinguished from the cellular membrane as shown in Fig. 4 for GO2. Similar observations were made by Russier et al. for GO with human and murine macrophages and described as so-called “mask-effect”.35In addition to the paral-lel alignment of the GO sheets, several sheets comprising numerous folds and wrinkles were found on the cell surface, especially near the edges of Caco-2 islets. In this region Caco-2 cells showed numerous wave-like cell protrusions. All GO samples showed well exfoliated sheets. Nevertheless, GO4
fre-Fig. 2 Representative SEM images of Caco-2 cells after exposure to 20 µg ml−1acid-treated GRM or the respective control-GRM for 24 h, as
well as of untreated control cells.
Fig. 3 Cell viability of Caco-2 cells after exposure to acid-treated and control GRM samples for 24 h; left: GO1, right: GNP; all materials were tested in three independent experiments with three replicates for each concentration. Results are shown as mean and standard deviation.
Nanoscale Paper
quently exhibited some puff paste structured sheet assemblies. As described before, larger GNP aggregates were frequently found attached to the cell surface, again predominantly near the edges of Caco-2 islets. Exposure of Caco-2 cells to the four different GO, as well as the GNP, in a concentration range from 10–40 µg ml−1GRM for 24 h did not result in any visible morphological alterations of the cells or hints towards altered cell turnover. Furthermore cells frequently showed affinity to GO deposited on the glass substrate. As mentioned before, for GO1 and GNP few single events were observed which might indicate cellular uptake (Fig. S7 and S8 in ESI†).
Induction of reactive oxygen species by GO and GNP
Studies with other carbon-based materials have shown that these materials can induce the formation of reactive oxygen species (ROS).36,37ROS such as hydrogen peroxide (H2O2) are
highly reactive molecules which are involved in intra- and intercellular signalling. Up to a certain limit ROS-formation can be outbalanced by the cellular antioxidant defence. Nevertheless, imbalance due to elevated ROS levels can lead to severe damage of lipids, proteins and nucleic acids, which can in turn result in inflammatory reactions, genotoxicity or cell death. Therefore we assessed the possible GRM-induced formation of ROS by 2′,7′-dichlorodihydrofluorescein diacetate (H2DCF-DA) assay, a common assay previously applied with
multi-walled carbon nanotubes (MWCNTs)36 and graphene shells.37 Fig. 5 shows the results obtained for Caco-2 cells
exposed to different GO and GNP for 2 hours. 3-Morphol-inosydnonimine hydrochloride (SIN-1) served as qualitative positive control applied at a concentration of 150 µM in HBSS. In addition, sodium cholate in water was applied as vehicle control for GNP dispersions. The results clearly show that all applied GO, as well as the GNP, induced the formation of ROS in Caco-2 cells. Nevertheless, despite slight differences in the intensity of ROS formation found for individual GRM quantitative comparison is not possible due to concentration-dependent quenching of the DCF fluorescence in the presence of GO1, GO2, GO4 and GNP (see Fig. S14 and S15 in ESI†).
Similar decrease in fluorescence intensity was already reported for high concentrations of MWCNTs36and graphene shells.37In contrast, GO2 exhibited fluorescence enhancement
activity at low and medium concentrations, as well as fluo-rescence quenching at high concentrations (see Fig. S15 ESI†). Interference by intrinsic fluorescence of the GO and GNP could be excluded (see Fig. S12 and S13 ESI†). Further control experiments showed that all GRM were able to transform the de-acetylated H2DCF molecule into a fluorescent product,
indicating the production of ROS by the GRM in the absence of cells (see Fig. S16 ESI†). These results are again in line with findings previously reported for MWCNTs36 and graphene
shells.37Therefore, at least part of the ROS detected in the cell-based assay results from the activity of the GO or GNP alone. Cell viability of Caco-2 cells after exposure to a whole selection of GO representing research grade and commercial GO We further investigated whether the induced ROS formation can reach sufficient levels to have an impact on the cell viabi-lity of proliferating Caco-2 cells. Exposure to four different gra-phene oxides (GO1–4) for 24 h and 48 h resulted in a slight dose dependent decrease of the metabolic activity of Caco-2 cells, as determined by the application of the MTS-assay. Even at the highest GO concentration (80 µg ml−1) applied the mean
cell viability was above 80% for 24 h as well as 48 h exposure time for all GO samples, again indicating no acute toxicity of the GO for Caco-2 cells. To assess possible loss of cells after exposure to GO due to an increase in cell death, the total number of adherent Caco-2 cells was measured by modified lactate dehydrogenase (LDH) assay. After exposure to GO cells were washed with phosphate buffered saline and lysed for 60 minutes by addition of 9% triton-X 100 in PBS. The cell number was determined by measurement of the total LDH release after complete cell lysis. Release of LDH was linear to the number of lysed cells. As shown in Fig. 6 no significant decrease in cell number indicating loss of cells after exposure to GO was found for any GO sample and concentration applied.
In summary the results indicate that acid pre-treatment of pristine GRM seems to be not mandatory. Nevertheless it is definitely advisory to perform equivalent acid pre-treatment in case the selected GO is further functionalized or loaded with drugs for drug delivery or cancer treatment. Detailed analysis of the stability of functionalization under gastric conditions is inevitable. It should be noted that the digestion procedure applied here can be seen as a starting point for further
sys-Fig. 4 Representative SEM images of Caco-2 cells after exposure to different GRM for 24 h with an applied concentration range of 10–40 µg mL−1GRM; images shown for 10 µg ml−1GO1 and GO4; 20 µg ml−1
GO2 and GNP, as well as 40 µg ml−1 GO3 respectively. GO3 sheet
assemblies are visible next to the cells on the glass substrate in the upper right corner. Black arrows point towards the respective GRM.
tematic investigation of relevant factors influencing the material properties. We considered the acidic conditions as an isolated factor. But in vivo gastric fluids consist of a large diver-sity of further factors, such as salts, proteins and enzymes, which alone or in combination can have an influence on the GRM properties. From the multitude of available simulated body fluids of the alimentary tract (e.g. saliva, gastric and intestinal fluids) appropriate protocols have to be selected resembling the in vivo situation under consideration (e.g. fasted state vs. fed-state).
Despite close interaction with the cell membrane and induction of ROS-formation, no GO, either with or without acid pre-treatment, led to acute toxicity towards non-confluent Caco-2 cells. These results are in line with those obtained for Caco-2 cells exposed to two graphene oxides of different lateral
dimension25or single walled carbon nanotubes (SWCNTs),38 which can be regarded as rolled up graphene sheets. Two gra-phene oxides with different lateral size distributions also showed no acute toxicity to the lung epithelial cell line A549 when applied in concentrations up to 100 µg ml−1GO.39The physicochemical characterization showed that GO obtained from different sources but produced by the same top-down method (modified Hummers method) did not show large differences in the C/O ratio and layer number, but in the lateral size distribution. Expected differences in cell response of Caco-2 cells in dependence of the lateral size distribution of the GO, could not be observed. In addition, the starting material (graphite or GANF®) also had no influence on the acute toxicity towards Caco-2 cells. This is in a way surprising since other studies with different cell types reported size
Fig. 5 H2DCF assay: ROS formation after exposure of Caco-2 cells to 5–40 µg ml−1of the respective GO or GNP. Sin-1 served as positive control.
Aqueous solution with 0.1 mg ml−1sodium cholate served as vehicle control for the GNP samples.
Nanoscale Paper
dependent effects of GO.39But it should be noted that the size distribution of the applied GO is extremely large compared to other nanomaterials such as monodisperse silica
nano-particles. It cannot be excluded that certain sub-populations within the huge size range have a stronger effect than others. Pre-requisite for further analysis of the influence of the lateral
Fig. 6 Cell viability and total cell number of adherent Caco-2 cells after exposure to different GO samples for 24 h and 48 h. Cadmium sulphate (CdSO4) served as chemical control for the assay performance. Cell viability and total cell number are both presented as percentage of control cells
dimension would be the availability of GO with a very narrow size distribution, which is still a challenge to achieve. Large differences in the physicochemical properties, such as layer number and/or the C/O ratio, as it is the case between GO and GNP, led to visible changes in the level of acute toxicity towards Caco-2 cells but only at concentrations higher than 40 µg ml−1. The influence of the layer number/thickness and the C/O ratio has to be further determined in future experiments.
Despite the lack of acute toxicity of GO and low acute toxi-city of GNP at high concentrations, our results do not rule out that specific biological effects can be observed at sub-toxic GO levels. Further experiments regarding possible cellular uptake, loss of cellular functions and DNA damage have to be per-formed in future. Next to enterocytes the intestinal epithelium comprises several other types of cells (e.g. mucus-secreting goblet cells, antigen-sampling M-cells, entero-endocrine cells, Paneth cells, intestinal stem cells as well as intra-epithelial lymphocytes) with high variation in function and morphology which might show different interactions with GO. Even if these cell types occur in significant lower number compared to enterocytes which represent the majority of the cells of the intestinal barrier, further studies with these cell types (undifferentiated and differentiated, in vitro and in vivo) are needed to exclude any possible adverse effect of GO on the intestinal barrier. In addition, possible effects of chronic exposure of the intestinal barrier to GRM should be addressed.
Conclusions
The results of this study show that graphene oxides as well as graphene nanoplatelet aggregates are relatively inert towards physiological relevant acidic conditions and are likely to undergo stomach passage without significant changes in their physicochemical properties. Therefore acid pre-treatment of pristine GO is not required to investigate potential acute toxi-city towards cells of the intestinal tract in vitro. Nevertheless, this should not necessarily be valid for GO functionalized with biomolecules or drugs for biomedical application. In this case careful assessment of the stability of the functionalization under relevant acidic conditions is recommended. The lack of acute toxicity of four different GO samples to non-confluent Caco-2 cells is very promising in respect to a possible bio-medical application as well as important regarding un-intended exposure. In contrast exposure of Caco-2 cells to high concentrations of GNP showed low acute toxicity, which indi-cate that physicochemical parameters such as layer number and C/O ratio seem to be critical for the level of biological response of Caco-2 cells towards GRM.
Experimental section
Materials, sources & production
Graphene oxide 1 (GO1; SLGO) and Graphene nanoplatelets (GNP; HDPlas™ GNPs Grade 4) were obtained from Cheap
Tubes (Battleboro, 112 Mercury Drive, VT05301, USA; http:// www.cheaptubes.com). Research grade graphene oxide samples GO2 and GO3 were prepared from graphite flakes by a modified Hummers method as described by Treossi et al.40 The lateral size of the GO flakes can be tuned by changing the sonication time of the starting solutions, in particular in this work we used two graphene oxide solution sonicated 2 h (GO2) or 20 h (GO3) respectively. GO4 was obtained from Grupo Antolin-Irausa S.A. (Ctra. Madrid-Irún, Km. 244,8 – E09007 – Burgos, Spain).
Digestion of GRM
GO1 and GNP were incubated in 0.1 M hydrochloric acid (HCl) for 2 h in 37 °C under slight agitation. In parallel, GO1 and GNP were incubated in ultra-pure water under similar con-ditions as controls for the digestion procedure. After incu-bation, all samples were precipitated by centrifugation (10 min at 5000 rpm). The clear supernatant was exchanged by phos-phate buffered saline (PBS) with pH 6.8 which resembles the pH values in the small intestine and served for neutralization. GRM were re-dispersed and washed twice with ultra-pure water by centrifugation prior to further use.
Scanning electron microscopy (SEM) analysis of GRM
For SEM analysis of the GRM morphology GRM were applied as received from the manufacturer. GRM powders or disper-sions in ultra-pure water were applied on clean glass cover glasses (10 mm Ø, # 1, Menzel GmbH, Braunschweig, Germany) fixed on the SEM sample holder by conductive carbon strips to prevent direct contact of the carbon film and the carbon nanomaterial. Dispersions were dried at room temperature. All samples were sputter coated with 5 nm gold– palladium (Au/Pd = 80/20). Analysis was performed with SEM (Hitachi S-4800).
Zeta-(ζ)-potential measurements
The zeta-(ζ)-potential was measured with a Zeta Sizer Nano ZSP (Malvern Instruments, Worcestershire, UK) using dispos-able capillary cells (DTS1070, Malvern Instruments, Worcester-shire, UK). For measurements, GRM dispersions were diluted to a concentration of 100 µg ml−1in ultra-pure water,
contain-ing potassium chloride (KCl) as background electrolyte (end-concentration: 1 mM), 0.1 mg ml−1sodium cholate containing 1 mM KCl (for GNP only) or cell-culture medium (MEM + 10% FBS). Particle dispersions were diluted 1 : 10 in medium. The zeta potential of GO1 was also measured after incubation in cell-culture medium and separation of the medium, according to the following steps: 30 min incubation in cell-culture medium, centrifugation (centrifuge 5418 Eppendorf, Hamburg, DE) of the samples at 16 000g for 1 h, aspiration of the supernatant and re-dispersion (1 min vortex) in ultra-pure water. Each sample was measured three times.
X-ray photoelectron spectroscopy (XPS)
XPS measurements were carried out with a Scanning XPS Microprobe (PHI VersaProbe II spectrometer, Physical
Elec-Nanoscale Paper
tronics) using monochromatic Al Kα radiation (1486.6 eV). The operating pressure of the XPS analysis chamber was below 5 × 10⁻⁷ Pa under the measurement conditions presented here. The spectra were collected at photoemission take off angles of 45° (with respect to the surface). Survey scan spectra (0–1100 eV) were acquired with an energy step width of 0.8 eV, acquisition time of 160 ms per data point and analyser pass energies of 187.85 eV. Higher resolution narrow spectra for the elements carbon C1s (278 eV to 298 eV energy range) and oxygen O1s (523 eV to 543 eV energy range) were acquired with energy step widths of 0.125 eV, acquisition times of 3.2 s (carbon) and 2.56 s (oxygen) and analyser pass energies of 29.35 eV. Under these experimental conditions ( pass energies), the energy resolution (FWHM, full width at half maximum height) measured on silver Ag 3d5/2 photoemission line is 2.4 eV and 0.7 eV, respectively. The total acquisition times were approximately 4 min for survey scans and 16 min for the two high-energy resolution elemental scans together, which achieve an adequate signal-to-noise ratio without observable X-ray radiation damage to the samples. Each sample was ana-lysed at a randomly chosen spot using a micro-focused, scanned X-ray beam with a diameter of 200 µm (operated at a power of 50 W at 15 kV). The 180° spherical capacitor energy analyser was operated in the fixed analyser transmission mode (FAT). The GRM samples (acid treated and control) have been attached to clean and sterile cover glasses, whereas the as received GRM were pressed onto an indium foil. The cover glasses as well as indium foil were then placed on a 2.5 cm dia-meter sample holder. In order to compensate possible sample charging, dual beam charge neutralization with a flux of low energetic electrons (1.4 eV) combined with very low energy positive Ar-ions (10 eV) was used. The binding energy is refer-enced to the C–C, C–H hydrocarbon signal C 1s at 285.0 eV. Curve fitting (least-squares fit routines) was carried out with CasaXPS software version 2.3.16. Thereby, a mixed Gaussian– Lorentzian product function (constant ratio of 70% Gaussian and 30% Lorentzian) was used to de-convolute the XP spectra. During the fitting process, the positions on the binding energy scale were constraint to corresponding literature values.33 Atomic concentrations were calculated from XPS peak areas after subtracting a Shirley type background. Thereby, tabulated PHI sensitivity factors41 corrected for our system’s trans-mission function and spectrometer geometry (asymmetry func-tion) have been used for quantification.
Raman spectroscopy
Raman spectroscopy was performed on a confocal Raman microscope Labram HR800 Horiba Yvon Jobin, at 2 different laser wavelengths (red: 633 nm; green: 532 nm; hole: 100 µm, 100× magnification, 5 accumulations of 5 s each, between 1000 and 3000 cm−1). The use of two different wavelengths is important because the shape and intensity ratios depend on the laser energy. Samples were prepared by drop casting on microscope glass slides. For each kind of treated GRM, 3 slides were studied, with about 7 measurements on agglomerates of different sizes. Significance of observed differences was then
estimated with Student’s t-tests supposing a normal distri-bution of measurements around the value really characterising each sample. Such a test is preconized to compare the means from two small and independent samples. Previously, the equality of the variances of each assay of measurements had been verified with F-test.
Cell culture
Caco-2 cells derived from human colorectal adenocarcinoma were obtained from ATCC (Product ATCC®HTB-37™, ATCC, Manassas, VA, USA). Caco-2 cells from cryogenically-preserved stocks were sub-cultured at least twice before the experiments. Cells were grown in Minimum essential medium (MEM, Ref. M2279, Sigma-Aldrich Chemie GmBH, Steinheim, Germany) supplemented with 10% non-heat inactivated fetal calf serum (FCS), 1% non-essential amino acids (NEAA), 1%
L-glutamine, 1% penicillin–streptomycin–neomycin (PSN) and
incubated in a humidified atmosphere with 5% CO2at 37 °C.
Routinely cells were sub-cultured twice a week at 70–80% confluence by 0.5% trypsin-EDTA. To avoid pheno- and genotypic changes during cultivation of the cells, cells used for experiments were limited to 30 passages after thawing. Scanning electron microscopy (SEM) analysis of Caco-2 cells Caco-2 cells were seeded on clean and sterile cover glasses (15 mm Ø, # 1, Menzel GmbH, Braunschweig, Germany) in 12-well cell culture plates at a cell density of 1 × 10⁵ cell per well, allowing attachment of the cells for 24 h prior to the experiments. Cells were exposed to 10–40 µg ml−1GRM in
sup-plemented cell culture medium for 24 h in parallel to control cells without GRM exposure. After exposure cells were washed twice with pre-warmed phosphate buffered saline (PBS). Cells were prepared by chemical fixation adding modified Karnovsky fixation solution (4 g paraformaldehyde (CAS 30525-89-4), 50 ml aqua bidest, 5 ml glutaraldehyde 50% (CAS 111-30-8, toxic if swallowed or if inhaled, causes severe skin burns and eye damage!), 45 ml phosphate buffered saline without glucose and pH 7.4) and incubation at room temperature for 1 hour. Samples were washed twice with PBS. Dehydration of the samples was performed by ascending ethanol series (50–100% ethanol) followed by hexamethyldisilizane (HMDS, CAS 999-97-3, harmful if swallowed or if inhaled, toxic in contact with skin!) treatment. Samples were dried overnight in a fume hood and stored in a desiccator until sputter coating with 10 nm gold–palladium (Au/Pd = 80/20).
Detection of reactive oxygen species (DCF assay)
The formation of reactive oxygen species (ROS) was deter-mined by 2′,7′-dichlorodihydrofluorescein diacetate (H2DCF-DA, CAS 4091-99-0) assay as described in ref. 37 with
small changes. In brief, Caco-2 cells were seeded with 1 × 10⁴ cells in 100 µl of complete cell culture medium per well in a 96 well plate and grown overnight under standard cell culture conditions. On the following day, cells were loaded with 50 µM H2DCF-DA in Hank’s buffered salt solution (HBSS) in a
washed twice with pre-warmed HBSS. In each case Caco-2 cells were exposed to 100 µl of the GRM dispersions with concentration ranges from 0–40 µg ml−1. 3-Morphol-inosydnonimine hydrochloride (SIN-1, CAS 16142-27-1) served as positive control applied at a concentration of 150 µM in HBSS. After 2 hours incubation time fluorescence intensities were measured at 485 nm excitation and 528 nm emission wavelengths by FLx800 fluorescence microplate reader (BioTek Instruments). Control experiments in the absence of cells were performed to determine possible ROS generation by the GRM, intrinsic GRM absorbance and fluorescence, as well as fluorescence quenching (see ESI†).
Cell viability
Cell viability of Caco-2 cells after exposure to different GO was assessed by measurement of the metabolic activity via MTS (3-(4,5-dimethylthiazol-2-yl)-5-(3-cyrboxymethoxy-phenyl)-2-(4-sulfophenyl)-2H-tetrazolium, inner salt) assay obtained as Cell-Titer96 Aqueous One Solution from Promega Corporation (2800 Woods Hollow Road, Madison, WI 53711-5399, USA). The assay was performed according to the manufacturer’s pro-tocol with slight changes to consider intrinsic GRM absor-bance. Cells were seeded in 96-well plates (tissue culture test plate 96F, Ref. 92096, TPP® Techno Plastic Product AG, Swit-zerland) at a cell density of 1 × 10⁴cells in 100 µl of complete cell culture medium per well. Cells were grown overnight at standard cell culture conditions. The day after, cells were exposed to respective GRM diluted in complete cell culture medium at a concentration range of 0–80 µg ml−1GRM for 24
and 48 hours. Cadmium sulphate (CdSO4) was applied as
positive control in a concentration range of 0–1000 µM. After exposure the medium was replaced by 120 µl MTS working solution (20 µl MTS reagent plus 100 µl phenol-red free RPMI-1640). Directly after addition of the working solution absorbance was measured at 490 nm to obtain background absorbance values (t0 value) considering intrinsic absorbance of residual GRM. Cells were incubated under standard cell culture conditions for 60 min. Final absorbance (t1 value) was measured at 490 nm wavelengths. Absorbance values (t1 values) were corrected for intrinsic GRM absorbance by subtraction of the t0 values. Data is presented as mean and standard deviation of at least three independent experiments. Analysis of total number of adherent cells (modified lactate dehydrogenase [LDH] assay)
Total number of adherent cells was assessed by the CytoTox96® Non-Radioactive Cytotoxicity Assay (Ref. G1780, Promega Corporation, 2800 Woods Hollow Road, Madison, WI 53711-5399, USA) according to the manufacturer with slight modification to consider intrinsic GRM absorbance. For this purpose cells were seeded in 96-well plates at a cell density of 1 × 10⁴cells in 100 µl of complete cell culture medium per well and grown overnight at standard cell culture conditions. Cells were exposed to 0–80 µg ml−1 GRM diluted in complete cell culture medium for 24 and 48 hours. Cadmium sulphate (CdSO4, CAS 10124-36-4, toxic if swallowed, fatal if inhaled)
served as positive control in a concentration range of 0–1000 µM. After exposure cells were washed twice with pre-warmed phosphate buffered saline. All cells were lysed by the addition of lysis solution (9% Triton-X 100, CAS 9002-93-1) and incubation at 37 °C for 45 min. After complete cell lysis absorbance was measured at 490 nm wavelength to obtain background absorbance values (t0 value) considering intrinsic absorbance of residual GRM. Assay reagent was added to each well. The 96-well plates were incubated at room temperature for 30 minutes. After 30 min incubation time stop solution was added to stop reaction. Final absorbance (t1 value) was measured at 490 nm wavelength. Results were corrected for intrinsic GRM absorbance (t1 − t0). Data is presented as mean and standard deviation of three independent experiments.
Acknowledgements
The research leading to these results has received funding from the European Union Seventh Framework Programme under grant agreement no 604391 Graphene Flagship. The authors thank Laura Neff (Empa) for technical support of the DCF assay and Nils Bohmer (Empa) for proof-reading of the manuscript.
Notes and references
1 K. S. Novoselov, V. I. Fal’ko, L. Colombo, P. R. Gellert, M. G. Schwab and K. Kim, Nature, 2012, 490, 192–200. 2 A. C. Ferrari, F. Bonaccorso, V. Fal’ko, K. S. Novoselov,
S. Roche, P. Boggild, S. Borini, F. H. Koppens, V. Palermo, N. Pugno, J. A. Garrido, R. Sordan, A. Bianco, L. Ballerini, M. Prato, E. Lidorikis, J. Kivioja, C. Marinelli, T. Ryhanen, A. Morpurgo, J. N. Coleman, V. Nicolosi, L. Colombo, A. Fert, M. Garcia-Hernandez, A. Bachtold, G. F. Schneider, F. Guinea, C. Dekker, M. Barbone, Z. Sun, C. Galiotis, A. N. Grigorenko, G. Konstantatos, A. Kis, M. Katsnelson, L. Vandersypen, A. Loiseau, V. Morandi, D. Neumaier, E. Treossi, V. Pellegrini, M. Polini, A. Tredicucci, G. M. Williams, B. H. Hong, J. H. Ahn, J. M. Kim, H. Zirath, B. J. van Wees, H. van der Zant, L. Occhipinti, A. Di Matteo, I. A. Kinloch, T. Seyller, E. Quesnel, X. Feng, K. Teo, N. Rupesinghe, P. Hakonen, S. R. Neil, Q. Tannock, T. Lofwander and J. Kinaret, Nanoscale, 2015, 7, 4598–4810. 3 W. S. Hummers and R. E. Offeman, J. Am. Chem. Soc., 1958,
80, 1339.
4 K. S. Novoselov, A. K. Geim, S. V. Morozov, D. Jiang, Y. Zhang, S. V. Dubonos, I. V. Grigorieva and A. A. Firsov, Science, 2004, 306, 666–669.
5 Y. Hernandez, V. Nicolosi, M. Lotya, F. M. Blighe, Z. Sun, S. De, I. T. McGovern, B. Holland, M. Byrne, Y. K. Gun’Ko, J. J. Boland, P. Niraj, G. Duesberg, S. Krishnamurthy, R. Goodhue, J. Hutchison, V. Scardaci, A. C. Ferrari and J. N. Coleman, Nat. Nanotechnol., 2008, 3, 563–568.
Nanoscale Paper
6 V. Leon, M. Quintana, M. A. Herrero, J. L. Fierro, A. de la Hoz, M. Prato and E. Vazquez, Chem. Commun., 2011, 47, 10936–10938.
7 J. Cai, P. Ruffieux, R. Jaafar, M. Bieri, T. Braun, S. Blankenburg, M. Muoth, A. P. Seitsonen, M. Saleh, X. Feng, K. Mullen and R. Fasel, Nature, 2010, 466, 470–473. 8 J. Liu, B. W. Li, Y. Z. Tan, A. Giannakopoulos, C.
Sanchez-Sanchez, D. Beljonne, P. Ruffieux, R. Fasel, X. Feng and K. Mullen, J. Am. Chem. Soc., 2015, 137, 6097–6103.
9 M. G. Schwab, A. Narita, S. Osella, Y. Hu, A. Maghsoumi, A. Mavrinsky, W. Pisula, C. Castiglioni, M. Tommasini, D. Beljonne, X. Feng and K. Mullen, Chem. – Asian J., 2015, 10, 2134–2138.
10 S. Stankovich, D. A. Dikin, R. D. Piner, K. A. Kohlhaas, A. Kleinhammes, Y. Jia, Y. Wu, S. T. Nguyen and R. S. Ruoff, Carbon, 2007, 45, 1558–1565.
11 M. Inagaki and F. Kang, J. Mater. Chem. A, 2014, 2, 13193– 13206.
12 D. V. Kosynkin, A. L. Higginbotham, A. Sinitskii, J. R. Lomeda, A. Dimiev, B. K. Price and J. M. Tour, Nature, 2009, 458, 872–876.
13 D. Bitounis, H. Ali-Boucetta, B. H. Hong, D.-H. Min and K. Kostarelos, Adv. Mater., 2013, 25, 2258–2268.
14 K. Kostarelos and K. S. Novoselov, Nat. Nanotechnol., 2014, 9, 744–745.
15 Z. Liu, J. T. Robinson, X. Sun and H. Dai, J. Am. Chem. Soc., 2008, 130, 10876–10877.
16 M. Melucci, M. Durso, M. Zambianchi, E. Treossi, Z.-Y. Xia, I. Manet, G. Giambastiani, L. Ortolani, V. Morandi, F. De Angelis and V. Palermo, J. Mater. Chem., 2012, 22, 18237. 17 S. Makharza, G. Cirillo, A. Bachmatiuk, I. Ibrahim,
N. Ioannides, B. Trzebicka, S. Hampel and M. H. Rümmeli, J. Nanopart. Res., 2013, 15.
18 G. Sechi, D. Bedognetti, F. Sgarrella, L. Van Eperen, F. M. Marincola, A. Bianco and L. G. Delogu, Nanomedicine, 2014, 9, 1475–1486.
19 A. Bianco, Angew. Chem. Int. Ed., 2013, 52, 4986–4997. 20 A. Bianco, H.-M. Cheng, T. Enoki, Y. Gogotsi, R. H. Hurt,
N. Koratkar, T. Kyotani, M. Monthioux, C. R. Park, J. M. D. Tascon and J. Zhang, Carbon, 2013, 65, 1–6. 21 P. Wick, A. E. Louw-Gaume, M. Kucki, H. F. Krug,
K. Kostarelos, B. Fadeel, K. A. Dawson, A. Salvati, E. Vazquez, L. Ballerini, M. Tretiach, F. Benfenati, E. Flahaut, L. Gauthier, M. Prato and A. Bianco, Angew. Chemie, 2014, 53, 7714–7718.
22 C. Bussy, D. Jasim, N. Lozano, D. Terry and K. Kostarelos, Nanoscale, 2015, 7, 6432–6435.
23 L. Ma-Hock, V. Strauss, S. Treumann, K. Kuttler, W. Wohlleben, T. Hofmann, S. Groters, K. Wiench, B. van Ravenzwaay and R. Landsiedel, Part. Fibre Toxicol., 2013, 10, 23.
24 A. Schinwald, F. Murphy, A. Askounis, V. Koutsos, K. Sefiane, K. Donaldson and C. J. Campbell, Nanotoxi-cology, 2014, 8, 824–832.
25 L. De Marzi, L. Ottaviano, F. Perrozzi, M. Nardone, S. Santucci, J. De Lapuente, M. Borras, E. Treossi, V. Palermo and A. Poma, J. Biol. Regul. Homeostatic Agents, 2014, 28, 281–289.
26 K. Kouroupis-Agalou, A. Liscio, E. Treossi, L. Ortolani, V. Morandi, N. M. Pugno and V. Palermo, Nanoscale, 2014, 6, 5926–5933.
27 A. A. Green and M. C. Hersam, Nano Lett., 2009, 9, 4031– 4036.
28 M. Lotya, P. J. King, U. Khan, S. De and J. N. Coleman, ACS Nano, 2010, 4, 3155–3162.
29 A. Liscio, K. Kouroupis-Agalou, X. Díez-Betriu, A. Kovtun, E. Treossi, N. M. Pugno, G. De Luca and V. Palermo, Nature Commun., submitted.
30 R. Kurapati, J. Russier, M. A. Squillaci, E. Treossi, C. Ménard-Moyon, A. E. D. Rio-Castillo, E. Vazquez, P. Samorì, V. Palermo and A. Bianco, Small, 2015, 11(32), 3985–3994.
31 D. Yang, A. Velamakanni, G. Bozoklu, S. Park, M. Stoller, R. D. Piner, S. Stankovich, I. Jung, D. A. Field, C. A. Ventrice and R. S. Ruoff, Carbon, 2009, 47, 145–152. 32 S. Some, Y. Kim, E. Hwang, H. Yoo and H. Lee, Chem.
Commun., 2012, 48, 7732–7734.
33 L. Stobinski, B. Lesiak, A. Malolepszy, M. Mazurkiewicz, B. Mierzwa, J. Zemek, P. Jiricek and I. Bieloshapka, J. Elec-tron Spectrosc. Relat. Phenom., 2014, 195, 145–154.
34 L. G. Cancado, A. Jorio, E. H. Ferreira, F. Stavale, C. A. Achete, R. B. Capaz, M. V. Moutinho, A. Lombardo, T. S. Kulmala and A. C. Ferrari, Nano Lett., 2011, 11, 3190– 3196.
35 J. Russier, E. Treossi, A. Scarsi, F. Perrozzi, H. Dumortier, L. Ottaviano, M. Meneghetti, V. Palermo and A. Bianco, Nanoscale, 2013, 5, 11234–11247.
36 M. Roesslein, C. Hirsch, J. P. Kaiser, H. F. Krug and P. Wick, Int. J. Mol. Sci., 2013, 14, 24320–24337.
37 A. Bachmatiuk, R. G. Mendes, C. Hirsch, C. Jähne, M. R. Lohe, J. Grothe, S. Kaskel, L. Fu, R. Klingeler, J. Eckert, P. Wick and M. H. Rümmeli, ACS Nano, 2013, 7, 10552–10562.
38 A. Jos, S. Pichardo, M. Puerto, E. Sanchez, A. Grilo and A. M. Camean, Toxicol. in Vitro, 2009, 23, 1491–1496. 39 Y. Chang, S. T. Yang, J. H. Liu, E. Dong, Y. Wang, A. Cao,
Y. Liu and H. Wang, Toxicol. Lett., 2011, 200, 201–210. 40 E. Treossi, M. Melucci, A. Liscio, M. Gazzano, P. Samori
and V. Palermo, J. Am. Chem. Soc., 2009, 131, 15576–15577. 41 J. F. Moulder, W. F. Stickle, P. E. Sobol and K. D. Bomben,
Handbook of X-ray Photoelectron Spectroscopy, Physical Elec-tronics Inc., Eden Prairie, MN, USA, 1995.