HAL Id: hal-00304901
https://hal.archives-ouvertes.fr/hal-00304901
Submitted on 1 Jan 2003HAL is a multi-disciplinary open access archive for the deposit and dissemination of sci-entific research documents, whether they are pub-lished or not. The documents may come from teaching and research institutions in France or abroad, or from public or private research centers.
L’archive ouverte pluridisciplinaire HAL, est destinée au dépôt et à la diffusion de documents scientifiques de niveau recherche, publiés ou non, émanant des établissements d’enseignement et de recherche français ou étrangers, des laboratoires publics ou privés.
the MAGIC model
J. Aherne, P. J. Dillon, B. J. Cosby
To cite this version:
J. Aherne, P. J. Dillon, B. J. Cosby. Acidification and recovery of aquatic ecosystems in south central Ontario, Canada: regional application of the MAGIC model. Hydrology and Earth System Sciences Discussions, European Geosciences Union, 2003, 7 (4), pp.561-573. �hal-00304901�
Acidification and recovery of aquatic ecosystems in south central
Ontario, Canada: regional application of the MAGIC model
J. Aherne
1, P.J. Dillon
1and B.J. Cosby
21Environmental and Resource Studies, Trent University, Peterborough, ON K9J 7B8, Canada 2Department of Environmental Science, University of Virginia, Charlottesville, USA
E-mail for corresponding author: [email protected]
Abstract:
The dynamic model MAGIC was applied to 25 lakes in south-central Ontario, Canada using a regional modelling methodology. Soil and lake water chemistry for each lake catchment was simulated for the period 18502050. Sulphate (SO42) deposition forecasts were derived from
recently proposed emission reductions, which correspond roughly to a 50% reduction in SO42 deposition by 2010 from the 2000 baseline.
Changes in SO42 deposition had a significant impact on lake chemistry. Simulated lake water chemistry showed a recovery potential under
the current deposition scenario; by 2050 concentration levels recovered to values predicted for the early 1900s. Moreover, simulated future lake water chemistry showed significant recovery compared to 1975 levels. However, although regional simulations predict that base cation losses have decreased in recent years, soils in the region will continue to acidify with Ca2+ losses dominating depletion of the exchangeable
pool. Base cation losses from the exchangeable pool are currently buffering lakes against the impacts of acid deposition; ultimately base cation inputs into the lakes will decrease as exchangeable base cation pools become depleted. Further emission reductions are necessary to ensure continued recovery from acidification.
Keywords: regional dynamic model, sulphate, acid neutralising capacity, critical loads, lake chemistry, soil base saturation.
Introduction
During the 1970s and 1980s, the acidification of surface waters by atmospherically deposited sulphur (S) became a major international concern. Major S emission control programmes were implemented in North America, resulting in current emissions being ~30% less than in 1980 (Jeffries
et al., 2000). As a result, sulphate (SO42) deposition in
south-central Ontario has decreased by ~40% in the past two decades. Consequently, SO42 concentrations in headwater
lakes and their inflows have decreased (Jeffries et al., 1995; McNicol et al., 1998; Stoddard et al., 1999). However, the level of acidic deposition remaining is still unlikely to promote widespread recovery of aquatic ecosystems (Jeffries
et al., 2000; Henriksen et al., 2002; Aherne et al., 2003a).
Steady-state (critical load) models have been applied recently in south-central Ontario to evaluate the adequacy of existing S emission control programmes in eastern North America. Critical loads of acidity were estimated for ~1500 lakes using the Steady-State Water Chemistry (SSWC)
model (Henriksen et al., 2002). In addition, critical loads of S and nitrogen (N) were estimated for a sub-set of these lakes (285) using the First-order Acidity Balance (FAB) model (Aherne et al., 2003a). However, although steady-state models yield an estimate of the ultimate chemical steady-state, they do not allow determination of when this state will be reached. Dynamic acidification models are required to estimate the time involved in attaining a certain lake chemical state in response to changes in deposition (Posch
et al., 2001).
Several dynamic process-oriented models have been developed to investigate the response of surface waters to acid deposition (Tiktak and van Grinsven, 1995). Three soil chemical models have been widely used for simulating acidification responses in soils and freshwaters: MAGIC (Cosby et al., 1985), SAFE (Warfvinge et al., 1993) and SMART (De Vries et al., 1989). These models have been applied also on a regional scale: Europe (De Vries et al., 1994), southern Norway (Cosby and Wright, 1998), southern
Sweden (Alveteg et al., 1995), Switzerland (Kurz et al., 1998) and the United Kingdom (Evans et al., 1998). In recent years, there has been increasing recognition of the importance of dynamic models in developing emission reduction targets. Under the United Nations Economic Commission for Europe (UNECE) Convention on Long-range Transboundary Air Pollution (LRTAP), work is currently underway to apply dynamic models on a European scale to support future re-negotiations of the Gothenburg Protocol (UNECE, 2001).
This paper presents a regional application of the dynamic model MAGIC (model of acidification of groundwater in catchments) to 25 lakes in south-central Ontario. These lakes represent a sub-set of the regional data-set used in the previous steady-state investigations. The objectives of the research were to investigate the historic chemical variations through time in response to changing deposition, and to assess the impact of recently proposed S emission reductions on future lake water chemistry. The proposed S emission reduction scenario is based on Canadas post-2000 Acid Rain Strategy and the proposed Clear Skies Legislation in the United States (Kaminski, 2002).
Study area
The study lakes are located in the District of Muskoka and the counties of Haliburton and Nipissing in south-central Ontario (Fig. 1), a region that for decades has received substantial levels of acid deposition (Dillon et al., 1987). The majority of the lakes are sensitive to the deposition of strong acids because of their geological setting on the southern extension of the Canadian Precambrian Shield (Neary and Dillon, 1988). Bedrock in the region is primarily granitised biotite and hornblende gneiss, with lesser areas of amphibolite and schist. The soils are poorly developed, typically podzols and brunisols formed on coarse-grained thin glacial till. The economy of the region is controlled largely by activities related to recreation and tourism, with cottage developments (seasonal and permanent) common throughout the region.
The land cover is dominated by semi-natural mixed hardwood forests; catchments are dominated by sugar maple (Acer saccharum) and red maple (Acer rubrum), with some American beech (Fagus grandifolia.), yellow birch (Betula
alleghaniensis), red oak (Quercus rubra), eastern hemlock
CANADA USA 0 40 km
Georgian Bay
Muskoka
Nipissing
Haliburton
BH BW RC BK CB CI CL CN DO DE FN GF HP HE HY LH LD LC MY MO PC PR SE WR WDFig. 1. Location of the 25 study lakes in the district of Muskoka and the counties of Haliburton and Nipissing, south-central Ontario, Canada
(Tsuga canadensis) and white pine (Pinus strobus). Small wetlands, dominated by white cedar (Thuja occidentalis) and black spruce (Picea mariana), are ubiquitous throughout the entire region, covering an estimated 10% of the total area. Nutrient cycling in the catchments of several of the study lakes (Plastic, Harp, Chub and Red Chalk) has been studied extensively (Watmough and Dillon, 2003a).
The climate of the study area is north temperate; long-term annual average precipitation is approximately 1000 mm, about one quarter to one third of which falls as snow. Approximately half of the precipitation produces stream runoff (Table 1). The mean monthly air temperatures for January and July are 10°C and 19°C, respectively, and the long-term annual average temperature is approximately 5°C.
Model description
MAGIC is a lumped-parameter model of intermediate complexity, developed to predict the long-term effects of acidic deposition on soil and surface water chemistry. The model was first described by Cosby et al. (1985) and more recently by Cosby et al. (2001). In brief, the model predicts monthly and annual average concentrations of the major ions for soil solution and surface water chemistry. MAGIC represents the catchment with aggregated, uniform soil compartments (one or two) and a surface water compartment that can be either a lake or a stream. Time-series inputs to the model include annual or monthly estimates of: deposition of ions from the atmosphere (wet plus dry deposition), discharge volumes and flow routing within the catchment,
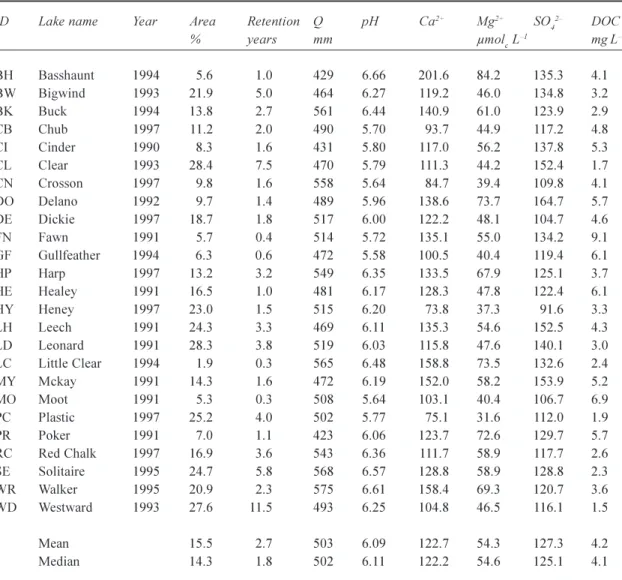
Table 1. Lake name, calibration year, lake area (relative to catchment area), water retention time, long-term mean
annual runoff (Q) and selected chemistry for the 25 study lakes. Lake chemistry data are presented as a three-year annual average centred on the calibration year.
ID Lake name Year Area Retention Q pH Ca2+ Mg2+ SO
42 DOC % years mm µmolc L1 mg L1 BH Basshaunt 1994 5.6 1.0 429 6.66 201.6 84.2 135.3 4.1 BW Bigwind 1993 21.9 5.0 464 6.27 119.2 46.0 134.8 3.2 BK Buck 1994 13.8 2.7 561 6.44 140.9 61.0 123.9 2.9 CB Chub 1997 11.2 2.0 490 5.70 93.7 44.9 117.2 4.8 CI Cinder 1990 8.3 1.6 431 5.80 117.0 56.2 137.8 5.3 CL Clear 1993 28.4 7.5 470 5.79 111.3 44.2 152.4 1.7 CN Crosson 1997 9.8 1.6 558 5.64 84.7 39.4 109.8 4.1 DO Delano 1992 9.7 1.4 489 5.96 138.6 73.7 164.7 5.7 DE Dickie 1997 18.7 1.8 517 6.00 122.2 48.1 104.7 4.6 FN Fawn 1991 5.7 0.4 514 5.72 135.1 55.0 134.2 9.1 GF Gullfeather 1994 6.3 0.6 472 5.58 100.5 40.4 119.4 6.1 HP Harp1997 13.2 3.2 549 6.35 133.5 67.9 125.1 3.7 HE Healey 1991 16.5 1.0 481 6.17 128.3 47.8 122.4 6.1 HY Heney 1997 23.0 1.5 515 6.20 73.8 37.3 91.6 3.3 LH Leech 1991 24.3 3.3 469 6.11 135.3 54.6 152.5 4.3 LD Leonard 1991 28.3 3.8 519 6.03 115.8 47.6 140.1 3.0 LC Little Clear 1994 1.9 0.3 565 6.48 158.8 73.5 132.6 2.4 MY Mckay 1991 14.3 1.6 472 6.19 152.0 58.2 153.9 5.2 MO Moot 1991 5.3 0.3 508 5.64 103.1 40.4 106.7 6.9 PC Plastic 1997 25.2 4.0 502 5.77 75.1 31.6 112.0 1.9 PR Poker 1991 7.0 1.1 423 6.06 123.7 72.6 129.7 5.7 RC Red Chalk 1997 16.9 3.6 543 6.36 111.7 58.9 117.7 2.6 SE Solitaire 1995 24.7 5.8 568 6.57 128.8 58.9 128.8 2.3 WR Walker 1995 20.9 2.3 575 6.61 158.4 69.3 120.7 3.6 WD Westward 1993 27.6 11.5 493 6.25 104.8 46.5 116.1 1.5 Mean 15.5 2.7 503 6.09 122.7 54.3 127.3 4.2 Median 14.3 1.8 502 6.11 122.2 54.6 125.1 4.1
biological production, removal and transformation of ions, internal sources and sinks of ions from weathering or precipitation reactions, and climate data. Constant parameters in the model include physical and chemical characteristics of the soils and surface waters, and thermodynamic constants. The model is calibrated using observed (or target) values of surface water and soil chemistry for a specified period. The eight site-measured target variables are: surface water concentrations and soil exchangeable fractions for base cations, calcium (Ca2+),
magnesium (Mg2+), sodium (Na+) and potassium (K+). In
this instance, calibration refers to an automated optimisation procedure that is a component of the MAGIC model suite (MAGICOPT) generally used for regional applications. Prior processing, or calibration, of the model data is described under regional modelling approach.
In the current study, all catchments were represented using one soil compartment receiving deposition and releasing discharge to the lake compartment. The soil compartment represents the aggregated horizons of the catchment soils. Simulations were carried out using an annual time-step, with a number of simplifying assumptions applied consistently across the region. It was assumed that forests were at steady state and harvesting removals were negligible; as such, biological production and removal were ignored. Discharge volume and flow routing within the catchments were not varied through time; discharge was described using long-term means with 100% routed to the lake. Detailed process-oriented N dynamics were not modelled, rather, N retention was set to match observed lake concentrations. The essential data for the regional site-specific application are time-series of annual atmospheric deposition (wet plus dry), physical and chemical characteristics of the soils and lakes, and observed soil and lake chemistry for each study lake.
Data sources
LAKES
Chemical data for lakes (~1500) in south-central Ontario have been collected under different research projects and lake surveys since the late 1970s. The current study focuses on a sub-set of the regional data-set that includes only those lakes monitored for 10+ years (25 lakes: Fig. 1, Table 1). Annual chemical concentrations were derived from 18 whole-lake, morphometrically weighted samples collected during the ice-free period. During the 1980s, these lakes were sampled monthly; more recently, this has been reduced to one or two samples per year. The exception was a set of lakes, known as the A lakes (Chub, Crosson, Dickie, Harp,
Heney, Plastic and Red Chalk), that have been studied extensively for over 20 years (Dillon and Molot, 1997). For these lakes, data were collected throughout the year as whole-lake, morphometrically weighted samples (Dillon et
al., 1997). Depending on the year, between 8 and 26 samples
were collected per lake. All chemical analyses were carried out at Ontario Ministry of the Environment laboratories, either at Dorset or Toronto (OME, 1983).
During the period 19801998, the number of years with available data for the 25 lakes in this study ranged from 10 (Cinder Lake) to 19 (A lakes). The most recent consecutive three-year period was used to describe observed annual average lake concentration data (targets) for model calibration (Table 1). As such, the calibration year (centred on the three-year period) ranged from 19911997. Lake area and bathymetry have been measured for all of the study lakes (Girard and Reid, 1990). The majority of the lakes are headwater lakes (17); as a result, catchment to lake area ratios are relatively high and water replenishment rates are long (median: ~2 years; Table 1). Catchment discharges were derived from a provincial runoff map generated from measured 30-year average runoff at all long-term hydrometric gauging stations throughout Ontario. The 30-year annual average runoff for all study lakes is ~500 mm yr1 (Table 1).
SOILS
Soil data for south-central Ontario is limited to a few intensive studies. Soil bulk density, cation exchange capacity (CEC) and exchangeable base cation fractions have been measured recently (19992000) at seven sub-catchments (Watmough and Dillon, 2003a). The soils of two of these sub-catchments (Plastic and Harp Lakes) were sampled previously in 1983 (Lozano, 1987). In general, soil physical and chemical properties are uniform across the region; soil depth rather than chemistry is the most important factor in determining acid sensitivity in the study area. As such, all available soil data for the region were aggregated into one set of values, weighted by depth and bulk density, to produce default regional physical and chemical characteristics for the soils (Table 2). This set of default values was applied uniformly across the region.
DEPOSITION
Bulk deposition has been measured in Muskoka and Haliburton during the past two decades (Dillon et al., 1988; Henriksen et al., 2002). Either four (19801989) or three (1990present) stations were used to generate annual deposition for the Muskoka-Haliburton region, which was
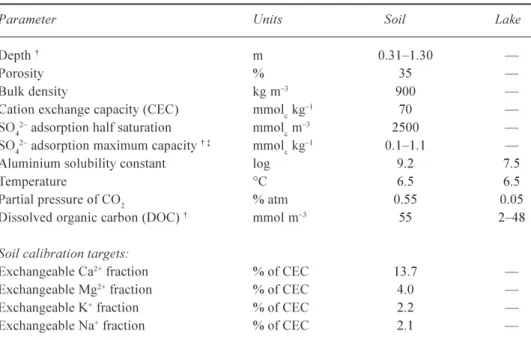
Table 2. Fixed input parameters and soil calibration targets for the regional application. Soil depth,
soil SO42 adsorption maximum capacity and lake DOC concentration are presented as ranges
(minimummaximum) as their values vary between the study lakes.
Parameter Units Soil Lake
Depth m 0.311.30
Porosity % 35
Bulk density kg m3 900
Cation exchange capacity (CEC) mmolc kg1 70
SO42 adsorption half saturation mmolc m3 2500
SO42 adsorption maximum capacity mmolc kg1 0.11.1
Aluminium solubility constant log 9.2 7.5
Temperature °C 6.5 6.5
Partial pressure of CO2 % atm 0.55 0.05
Dissolved organic carbon (DOC) mmol m3 55 248
Soil calibration targets:
Exchangeable Ca2+ fraction % of CEC 13.7
Exchangeable Mg2+ fraction % of CEC 4.0
Exchangeable K+ fraction % of CEC 2.2
Exchangeable Na+ fraction % of CEC 2.1 Range refers to values from individaul catchments. Range obtained through calibration.
assumed to be representative of deposition to the study area. The current annual average bulk depositions (19951999) for S and N are 41.1 mmolc m2 yr1 and 62.5 mmolc
m2 yr1, respectively (Aherne et al., 2003a). Total deposition
was estimated using dry deposition factors derived from throughfall measurements in the region (Neary and Gizyn, 1994). 0.0 0.5 1.0 1.5 2.0 1850 1875 1900 1925 1950 1975 2000 2025 2050
Sulphate deposition scale factor
EPA (2000)
Husar (1994), Lefohn et al. (1999) Kaminski (2002) Observed Forecast Historic reconstruction
Fig. 2. Estimated historic and future sulphate deposition (scale factor; 1997 deposition
(41 µmolc L1) is equivalent to a factor of 1.0) for the period 18502050. The broken lines
separate the different data sources used to construct the deposition sequence.
Sulphate deposition history was reconstructed from historic S emission inventories (18501940: Husar, 1994; Lefohn et al., 1999; 19401980: EPA, 2000) and observations (Fig. 2). Similarly, nitrate (NO3) deposition
history was reconstructed from emission inventories (1850 1940: Husar, 1994; 19401980: EPA, 2000) and
observations. North American emission inventories for ammonia (NH3) are rather scarce. As such, a simplified
ammonium (NH4+) deposition sequence was constructed
from observations, and NO3 emission data in combination
with global emission estimates of NH3 (Galloway, 1995).
Given the simplified treatment of N dynamics in the current study, model outputs will not be affected significantly.
Sulphate deposition forecasts were derived from recently proposed emission reduction estimates using the Acid Deposition and Oxidant Model (ADOM; Kaminski, 2002). The proposed reductions correspond roughly to a 50% reduction in SO42 deposition by 2010 from 2000 baselines.
Sulphate deposition was assumed constant thereafter. Deposition forecasts for NO3 and NH4+ were assumed to
remain constant at current levels (annual average bulk depositions (19951999) for NO3 and NH4+ are 36.6 mmolc
m2 yr1 and 25.9 mmol
c m2 yr1, respectively). In addition,
deposition sequences for all other ions were assumed to be constant throughout the simulation period.
Regional modelling approach
The objective of the regional site-specific approach was to apply a uniform modelling methodology to all study lakes using regionally consistent data. Previous dynamic modelling assessments in the study area have been confined to single site applications (e.g., Seip et al., 1985; Aherne et
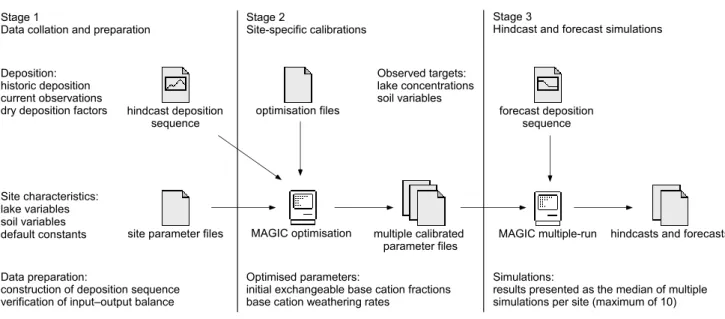
al., 2003b). The regional application was carried out in three
stages (Fig. 3).
Stage 1 involved the acquisition, collation and preparation of data. Site-specific parameter files were prepared using lake water and soil physico-chemical characteristics measured in the field (lake area, lake retention, soil bulk density, soil cation exchange capacity, etc.), and considered fixed in the model (Tables 1 and 2). In addition, some default parameter values were applied uniformly across the region (Table 2), i.e. the partial pressure of carbon dioxide in the soil (pCO2) was set at ~15 times atmospheric. Default
values were based on laboratory (LaZerte and Findeis, 1994), field (LaZerte and Scott, 1996) and previous modelling studies in the region (Aherne et al., 2003b). Chloride (Cl) and SO
42 were assumed to be in steady state
with respect to input-output fluxes. The excess of outputs over inputs, which was attributed principally to unmeasured dry deposition, was resolved by adjusting individual dry deposition factors. The mean SO42 dry deposition factor
for the 25 study lakes was determined to be 1.17, which is similar to estimates from throughfall and dry deposition investigations in central Ontario (Sirois et al. 2001; Neary and Gizyn, 1994). The assumption that SO42 is conservative
is a simplification of the regional modelling approach. Numerous studies in North America and Europe have shown that SO42 is not conservative (Dillon and LaZerte, 1992;
Mitchell et al., 2001; Prechtel et al., 2001). If S adsorption has occurred historically, recovery times are likely to be greater than those predicted by the model. In general, SO42
input-output imbalances were resolved using dry deposition factors; however, limit S adsorption was also implemented
MAGIC multiple-run MAGIC optimisation forecast deposition sequence hindcast deposition sequence
site parameter files Deposition:
historic deposition current observations dry deposition factors Stage 1
Data collation and preparation Stage 2Site-specific calibrations Stage 3Hindcast and forecast simulations
multiple calibrated parameter files Observed targets: lake concentrations soil variables
hindcasts and forecasts optimisation files
Optimised parameters:
initial exchangeable base cation fractions base cation weathering rates
Site characteristics: lake variables soil variables default constants Data preparation:
construction of deposition sequence verification of inputoutput balance
Simulations:
results presented as the median of multiple simulations per site (maximum of 10)
to resolve any remaining slight imbalance (Table 2). Nitrogen (NO3 and NH4+) uptake and transformation was
described as a catchment net retention calculated simply as the difference between input and output flux for the calibration year. This percentage was assumed to be constant throughout the simulation.
In Stage 2, base cation weathering rates and initial soil exchangeable fractions (and exchange constants) were calibrated to lake water and soil chemistry targets using an iterative automated optimisation procedure (MAGICOPT). The procedure uses numerical techniques to select parameter values that result in a minimum sum of squares error between simulated and observed target variables for each catchment. To account for uncertainty in a number of the fixed parameters (lake retention, lake area, soil depth, soil bulk density, cation exchange capacity and SO42 adsorption half
saturation), a fuzzy optimisation method was employed. Multiple calibrations were carried out for each lake studied; during each simulation the fixed parameters were varied randomly within the uncertainty bands specified (± 10%). In addition, uncertainty bands (or tolerance levels) were also applied to the target lake water (± 2 µmolc L1) and soil
chemistry (± 0.2 %) variables. For each study lake 10 calibrations were performed; any simulation that reproduced all target variables was considered successful.
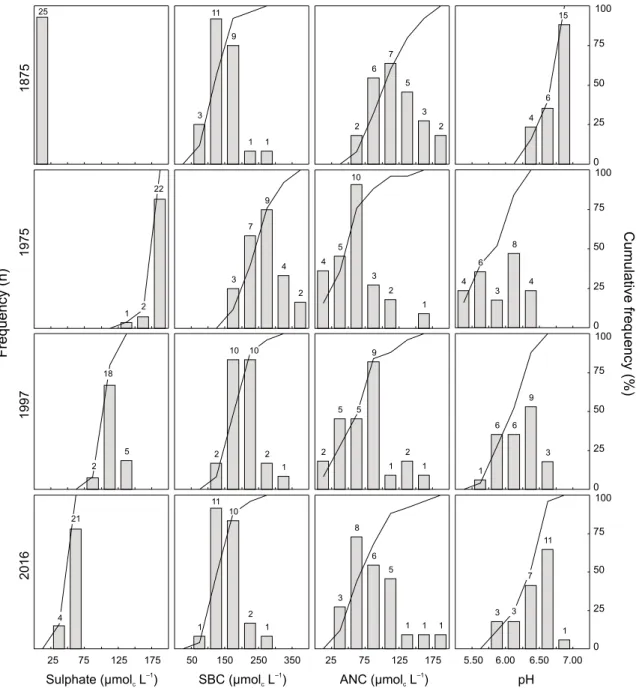
Finally, hindcast and forecast simulations were carried out for each lake using all successful calibrations. Multiple simulation results for each lake were combined using median statistics to predict regional lake water chemistry for the period 18502050. In addition to time-series plots, changes in water chemistry were evaluated by comparing the distribution (histograms and cumulative frequencies) of water chemistry variables at four distinct time periods: 1875, 1975, 1997 and 2016, which correspond roughly to pre-acidification, worst case, current and future lake chemistry, respectively. Similar methods of evaluation have been employed in other regional modelling studies in North America (Clair et al., 2003) and Europe (Jenkins et al., 2003).
Results and discussion
REGIONAL CALIBRATIONS
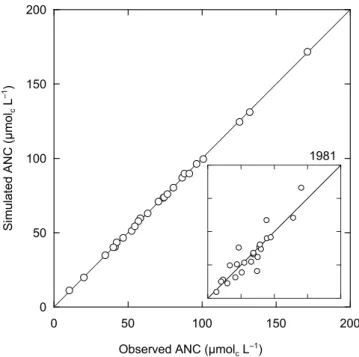
Multiple calibrations were performed on simulations run from 1850 to 1997 using historical deposition sequences. The number of successful calibrations per study lake ranged from 810, with most lakes having 10 successful calibrations (16 lakes). As expected, there is excellent agreement between simulated and observed acid neutralising capacity
(ANC: defined as the sum of base cations minus the sum of strong acid anions) for the calibration years (Fig. 4). For each of the lakes studied, more than 10 years of monitoring data are available. Simulated and observed ANC were also compared at the beginning of the monitoring period: 1981 (mean of three-year period centred on 1981). Goodness-of-fit was evaluated using linear regression of observed against predicted values (Janssen and Heuberger, 1995). In general, there is good agreement between simulated and observed ANC for 1981 (R2 = 0.85; see inset, Fig. 4).
LAKE CHEMISTRY DISTRIBUTIONS
Once calibrated, soil and lake water chemistry for each lake was simulated for the period 18502050. The description of historical and future deposition drives the long-term reconstruction of surface water chemistry. As such, SO42
deposition is the main driver. The historic deposition sequence reflects changes in energy consumption; the peak in emission in the 1970s (2 × current deposition) was followed by emission control programmes in North America (Fig. 2).
Changes in SO42 deposition have a significant impact on
lake chemistry, due to the assumption that SO42 is
conservative. Lake SO42 concentrations follow the same
trends as deposition with large changes in concentrations over time. However, spatially, there is very little variation
0 50 100 150 200 0 50 100 150 200
Simulated ANC (µmol
c
L
–1
)
Observed ANC (µmolc L
–1)
1981
Fig. 4. Observed and simulated acid neutralising capacity (ANC)
during the calibration year (see Table 1) for the 25 study sites. The inset depicts observed and predicted ANC during 1981.
in concentration ranges between lakes (Fig. 5). In 1875, SO42 was < 25 µmolc L1 in all lakes, whereas by 1975 the
majority of lakes had concentrations > 175 µmolc L1. In
recent years, reduction in SO42 deposition has resulted in
recovery (modal value: 100125 µmolc L1), which is
predicted to improve further by 2016 (modal value: 5075 µmolc L1). However, the proposed emission reductions will
not return SO42 concentrations to pre-acidification levels.
The sum of base cations (SBC) follows a similar pattern to SO42. However, spatially, there is a greater variation in
values between lakes, reflecting the difference in catchment weathering rates (Fig. 5). In 1875, the modal value was estimated at 100150 µmolc L1, which increased to 250
300 µmolc L1 by 1975. This reflects the increased export of
base cations from the soil exchangeable pool under high levels of acid deposition. The reduction in acid deposition by 1997 resulted in a modal value of 150250 µmolc L1.
By 2016, the SBC is predicted to recover almost completely to pre-acidification concentrations. This suggests that soil exchangeable pools in the region have become depleted of
25 75 125 175 ANC (µmol L )c –1 2 6 7 5 3 2 4 5 10 3 2 1 2 5 9 1 2 1 3 8 6 5 1 1 1 5 SBC (µmol L )c –1 3 11 9 1 1 3 7 9 4 2 2 10 2 1 10 50 150 250 350 1 11 2 1 10 1875 2016 1997 1975 Sulphate (µmol L )c –1 25 1 5 2 22 2 18 25 75 125 175 21 4 0 25 50 75 100 0 25 50 75 100 0 25 50 75 100 5.50 6.00 6.50 7.00 pH 0 25 50 75 100 Cumulative frequency (%) 4 4 3 8 4 1 6 6 9 3 3 11 1 6 6 3 7 15 Frequency (n)
Fig. 5. Distribution (histograms and cumulative frequencies) of sulphate, sum of base cations (SBC), acid neutralising capacity (ANC) and pH
base cations and have a reduced buffering capacity against acid deposition.
Modal ANC decreased from 100125 µmolc L1 in 1875,
to 5075 µmolc L1 in 1975 and recovered partially to 75
100 µmolc L1 in 1997. Although future predictions show
the modal value at 5075 µmolc L1, there is a continued
slight recovery as a greater percentage of lakes had ANC > 50 µmolc L1 (88% as opposed to 72% in 1997). The absence
of a significant recovery is due to the reduction in the SBC in 2016. The pH values show a pattern similar to that for ANC; historically high pH values shift to lower values during peak depositions and recover gradually under emission reductions. In 1875, the modal pH was 6.757.00. Under 1975 deposition, pH values show a bimodal distribution with one peak at 5.505.75 and another at 6.00 6.25. The lower values represent lakes that have limited buffering under the higher acid deposition load. By 1997,
the bimodal distribution disappeared and there is gradual recovery (modal value: 6.256.50), with further recovery by 2016 (modal value: 6.506.75).
TIME-SERIES FOR PH AND ANC
Trends in lake acidification and recovery were evaluated using time-series for pH and ANC. The regional trends are presented as percentile time-series (Figs. 6 and 7).
In 1850, historic lake pH ranged from 6.307.00. Regional values for pH decreased smoothly until deposition started to change dramatically after 1900 (Fig. 6). Between 1950 and 1975, when acid load peaked, pH decreased by an average of 0.7 pH units, accompanied by a broadening of the range between percentiles, particularly for the lower percentiles. The lower percentiles reflect lake catchments that have a limited buffering capacity and low DOC
5.0 5.5 6.0 6.5 7.0 1850 1875 1900 1925 1950 1975 2000 2025 2050 Percentile pH 5 25 50 75 95 0 50 100 150 200 1850 1875 1900 1925 1950 1975 2000 2025 2050
Percentile ANC (µmol
c L –1) 5 25 50 75 95
Fig. 6. Simulated percentile time-series for pH during the period 18502050. The 5th, 25th, 50th, 75th and 95th percentiles are shown (small
numbers in figure). The broken line separates hindcast and forecast simulations.
Fig. 7. Simulated percentile time-series for acid neutralising capacity (ANC) during the period 18502050. The 5th, 25th, 50th, 75th and 95th
concentrations. As a result, increases in acid deposition have a pronounced impact on pH in these lakes. During peak depositions, 50% of the lakes fell below pH 6.0. The decline in acid deposition from the late 1970s, and under the proposed future scenario, has a substantial effect on the pH. Significant recovery is predicted by 2050, with pentile (5th percentile) pH values estimated at 5.97.
ANC follows a similar pattern to pH (Fig. 7). However, unlike pH, which reacts rapidly to changes in deposition, acidification and recovery are noticeably buffered. All lakes had positive ANC throughout the entire simulation period and by 2050 the majority of the lakes had ANC > 50 µmolc
L1. A small number of lakes had high ANC values (95th
percentile) reflecting catchments with higher weathering rates. A decrease in the range of ANC values in 2050 compared to 1850 reflects the depletion of base cations from the exchangeable pool. However, both ANC and pH show a recovery potential under the current deposition scenario and by 2050 concentrations levels have recovered to values predicted for the early 1900s.
In contrast, regional modelling studies for acid sensitive surface waters in Europe (Jenkins et al., 2003) have reported widespread occurrence of ANC < 0 µmolc L1 during the
period of maximum SO42 deposition (1980s). International
agreements and European legislation to reduce S emissions have successfully promoted recovery across Europe (Evans
et al., 2001; Jenkins et al., 2003). However, unlike
south-central Ontario, model predictions for 2016 still indicate that a significant proportion of surface waters (in Norway, Sweden, Finland, Southern Alps and Southern Pennines, England) will have ANC < 20 µmolc L1 (Jenkins et al.,
2003).
CRITICAL LOADS
Critical loads of acidity have been estimated recently for south-central Ontario using the SSWC (Henriksen et al., 2002) and FAB (Aherne et al., 2003a) models. The treatment of N dynamics in the current study is similar to the SSWC model; as such, the current discussion will be limited to the SSWC model. The SSWC pentile critical load of acidity for south-central Ontario was estimated at 33.7 mmolc
m2yr1 (Henriksen et al., 2002), which is similar to the
result of previous critical load studies in central Ontario (33.3 mmolc m2 yr1: Jeffries and Lam, 1993). The pentile
critical load is typically used as a regional target to account for uncertainties, but also to ensure that a sufficient percentage of lakes is protected (95%). The SSWC critical load was based on an ANC limit of 40.0 µmolc L1, which is
the critical limit specified to protect aquatic organisms from damage. It is important to choose a value that is relevant to
the specific lakes and their biota. Using the same chemical criterion and critical limit, a rough comparison can be made between SSWC critical loads and MAGIC predictions. In the current study, a regional pentile ANC of 40.9 µmolc
L1 was predicted by 2010; average total deposition in 2010
was 33.9 mmolc m2 yr1 (estimated from lake concentration
and mean catchment runoff), which is in good agreement with the SSWC critical load.
SOIL EXCHANGEABLE FRACTIONS
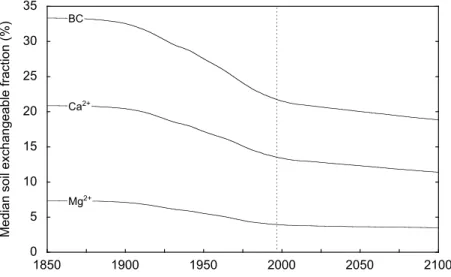
Simulated future lake chemistry generally indicates a significant recovery compared to 1975 levels (Figs. 57). Similarly, future deposition is below the estimated critical load. However, simulations predict a continued decrease in soil exchangeable fractions of base cations and correspondingly base saturation. Simulations have been extended to 2100 to investigate the future long-term trends in base saturation (Fig. 8). The soil exchangeable base cations pools have been declining since the late 1800s, the period of greatest decline occurred during the 1900s, and although future simulations indicate a slower decline, recovery is not predicted.
Relative to 1850 there is a continued decrease in soil base saturation under the proposed emission reduction scenario (Table 3). A further 6% decrease in base saturation is predicted between 2016 and 2100. Exchangeable Ca2+ and
Mg2+ follow the same trend; however, since the late 1900s
there has been a shift from Mg2+ dominated losses to Ca2+
dominated losses (Table 3). Base cation losses from the exchangeable pool are currently buffering lakes against the impacts of acid deposition. This is only a temporary phenomenon and ultimately base cation inputs into lakes will decrease as exchangeable base cation pools become depleted. Indeed, simulations of lake water chemistry to 2100 predict that following the recovery between 1997 and 2016 (Figs. 57) there is further acidification between 2016 and 2100 (Table 3), with a 2.2% decline in ANC and 0.5% decline in pH values.
The recovery of soils by increases in base saturation will take much longer than recovery for lake chemistry. Soils that have been depleted by acid deposition will remain acid sensitive for a considerable period of time, as there will be little capacity to buffer acidity by cation exchange. The rate of recovery is dependent on base cation supply from weathering and atmospheric inputs. Regional simulations predict that although base cation losses have decreased in recent years, soils in the region will continue to acidify with Ca2+ losses dominating depletion of the exchangeable pool.
The restoration of soil exchangeable base cation pools can only occur if weathering exceeds deposition plus natural
0 5 10 15 20 25 30 35 1850 1900 1950 2000 2050 2100
Median soil exchangeable fraction (%)
Ca2+
BC
Mg2+
Fig. 8. Simulated median soil exchangeable fractions for calcium (Ca2+), magnesium (Mg2+) and base cations (BC) during the
period 18502100. The broken line separates hindcast and forecast simulations.
Table 3. Simulated regional median lake concentration and soil chemistry for the 25 study lakes
during the years: 1875, 1975, 1997, 2016 and 2100. Data are presented as percent decrease relative to simulated 1850 values.
Lake and soil variables Percent decrease relative to 1850 (%)
(median of 25 study lakes) 1875 1975 1997 2016 2100
Lake concentration
Acid neutralising capacity 3.2 52.8 40.9 29.2 31.4
pH 0.4 13.6 8.8 4.8 5.3
Soil chemistry
Base saturation 0.4 27.7 34.9 37.3 43.3 Exchangeable Ca2+ fraction 0.3 27.5 35.2 37.9 45.3
Exchangeable Mg2+ fraction 0.6 38.3 46.3 48.6 52.3 Acid neutralising capacity (ANC) = (Ca2+ + Mg2+ + K+ + Na+ + NH
4+) (SO42 NO3 Cl)
acidification. This clearly requires further emission reductions and will take many decades.
LIMITATIONS
The regional application is subject to a number of uncertainties and limitations, which can arise from two sources: input data and model structure. The largest data limitation relates to the spatial resolution of soil data; this can only be addressed by further soil sampling in the catchments of the study lakes. Uncertainty in model structure relates to processes not included or modelled, rather than model stability. In the current study, the impact of land-use, specifically the influence of forestry has been ignored. Tree harvesting is a common occurrence in south-central Ontario
(Watmough and Dillon, 2003a); however, more research is needed to quantify adequately the removal of biomass through harvesting. Furthermore, the impacts of land use were beyond the scope of the current study. Inclusion of forest harvesting would result in slower recovery times than currently predicted by the model. Recent investigations in south-central Ontario, using the SSWC model, have shown that harvesting clearly has an enormous potential impact on lake chemistry, which will become more apparent as exchangeable base cation pools in soil decline and acid inputs can no longer be buffered (Watmough et al., 2003b). Similarly, a number of other processes not included in the current study, e.g., concurrent declines in base cation concentrations, increasing NO3 concentrations, desorption
S compounds stored in wetlands, have all been shown to delay recovery.
Conclusions
The dynamic model MAGIC was applied to 25 lakes in south-central Ontario. The dynamic perspective of acidification complements previous steady-state modelling approaches used to evaluate the adequacy of existing emission controls in south-central Ontario. The objectives of the current study were to investigate the historic chemical variations in response to changing deposition and assess the impact of recently proposed S emission reductions on future lake water chemistry. Model simulations predict clear links between lake acidification and the deposition of strong acids. During the past two decades, decreased SO42
deposition has resulted in significant recovery, which is predicated to improve further by 2050. Under the current deposition scenario, lake water concentrations in 2050 have recovered to levels predicted for the early 1900s, with the majority of the lakes having ANC > 50 µmolc L1. In contrast,
model predictions for Europe indicate that a significant proportion of acid sensitive surface waters (in Norway, Sweden, Finland, Southern Alps and Southern Pennines, England) will have ANC < 20 µmolc L1.
Although regional simulations predict that base cation losses have decreased in recent years, soils in the region will continue to acidify with Ca2+ losses dominating
depletion of the exchangeable pool. The restoration of soil exchangeable base cation pools can occur only if weathering exceeds deposition plus natural acidification. This clearly requires further emission reductions and will take many decades.
Acknowledgements
This work was supported by grants to P.J. Dillon from Ontario Power Generation Inc. and the Natural Sciences and Engineering Research Council of Canada, and by the Ontario Ministry of the Environment.
References
Aherne, J., Posch, M., Dillon, P.J. and Henriksen, A., 2003a. Critical loads of acidity for surface waters in south-central Ontario, Canada: regional application of the First-order Acidity Balance (FAB) model. Water Air Soil Pollut., Focus, (in press). Aherne, J., Larssen, T., Dillon, P.J. and Cosby, B.J., 2003b. Modelling the effects of climate events on elemental fluxes from forested catchments in Ontario, Canada. Water Air Soil Pollut.,
Focus, (in press).
Alveteg, M., Sverdrup, H. and Warfvinge, P., 1995. Regional assessment of the temporal trends in soil acidification in southern Sweden, using the SAFE model. Water Air Soil Pollut., 85, 25092514.
Clair, T.A., Dennis, I. and Cosby, B.J., 2003. Probable changes in lake chemistry in Canadas Atlantic Provinces under proposed North American emission reductions. Hydrol. Earth Syst. Sci.,
7, 574582.
Cosby, B.J. and Wright, R.F., 1998. Modelling regional response of lakewater chemistry to changes in acidic deposition: the MAGIC model applied to lake surveys in southernmost Norway 197419861995. Hydrol. Earth Syst. Sci., 2, 563576. Cosby, B.J., Hornberger, G.M. and Galloway, J.N., 1985.
Modeling the effects of acid deposition: assessment of a lumped parameter model of soil water and streamwater chemistry. Water
Resour. Res., 21, 5163.
Cosby, B.J., Ferrier, R.C., Jenkins, A. and Wright, R.F., 2001. Modelling the effects of acid deposition: refinements, adjustments and inclusion of nitrogen dynamics in the MAGIC model. Hydrol. Earth Syst. Sci., 5, 499517.
De Vries, W., Posch, M. and Kämäri, J., 1989. Simulation of the long-term soil response to acid deposition in various buffer ranges. Water Air Soil Pollut., 48, 349390.
De Vries, W., Reinds, G.J., Posch, M. and Kämäri, J., 1994. Simulation of soil response to acidic deposition scenarios in Europe. Water Air Soil Pollut., 78, 215246.
Dillon, P.J. and Molot, L.A., 1997. Dissolved organic and inorganic carbon mass balances in central Ontario lakes.
Biogeochemistry, 36, 2942.
Dillon, P.J. and LaZerte, B.D., 1992. Response of the Plastic Lake catchment, Ontario, to reduced sulphur deposition.
Environ. Pollut., 77, 211217.
Dillon, P.J., Reid, R.A. and de Grosbois, E.D., 1987. The rate of acidification of aquatic ecosystems in Ontario, Canada. Nature,
329, 4548.
Dillon, P.J., Lusis, M., Reid, R.A. and Yap, D., 1988. Ten-year trends in sulphate, nitrate and hydrogen deposition in central Ontario. Atmos. Environ., 22, 901905.
Dillon, P.J., Molot, L.A. and Futter, M., 1997. The effect of El Niño-related drought on the recovery of acidified lakes. Environ.
Monit. Assess., 46, 105111.
EPA, 2000. National Air Pollutant Emission Trends: 19001998. EPA-454/R-00-002, United States Environmental Protection Agency, North Carolina (online: www.epa.gov/ttn/chief/ trends/ trends98).
Evans, C.D., Jenkins, A., Helliwell, R.C. and Ferrier, R.C., 1998. Predicting regional recovery from acidification; the MAGIC model applied to Scotland, England and Wales. Hydrol. Earth
Syst. Sci., 2, 543554.
Evans, C.D., Cullen, J.M., Alewell, C., Kopácek, J., Marchetto, A., Moldan, F., Prechtel, A., Rogora, M., Veselý, J. and Wright, R.F., 2001. Recovery from acidification in European surface waters. Hydrol. Earth Syst. Sci., 5, 283297.
Galloway, J.N., 1995. Acid deposition: perspectives in time and space. Water Air Soil Pollut., 85, 1524.
Girard, R. and Reid, R.A., 1990. Dorset Research Centre Study
Lakes: Sampling Methodology (19861989) and Lake Morphometry. Ontario Ministry of the Environment, Dorset,
Ontario. 33pp.
Henriksen, A., Dillon, P.J. and Aherne, J., 2002. Critical loads of acidity for surface waters in south-central Ontario, Canada: regional application of the steady-state water chemistry model.
Husar, R., 1994. Sulphur and Nitrogen Emission Trends for the United States: An Application of the Materials Flow Approach. In: Industrial Metabolism, R.U. Ayres and U.E. Simonis (Eds.), Restructuring for Sustainable Development, United Nations University Press, 390pp. (online: www.unu.edu/unupress/ unupbooks/80841e/80841e00.htm).
Janssen, P.H.M. and Heuberger, P.S.C., 1995. Calibration of process-oriented models. Ecol. Model., 83, 5566.
Jeffries, D.S. and Lam, D.C.L., 1993. Assessment of the effect of acidic deposition on Canadian lakes: determination of critical loads for sulphate deposition. Water Sci. Techol., 28, 183187. Jeffries, D.S., Clair, T.A., Dillon, P.J., Papineau, M. and Stainton, M.P., 1995. Trends in surface water acidification at ecological monitoring sites in southeastern Canada (19811991). Water
Air Soil Pollut., 85, 577582.
Jeffries, D.S., Lam, D.C.L., Wong, I. and Moran, M.D., 2000. Assessment of changes in lake pH in southeastern Canada arising from present levels and expected reductions in acidic deposition.
Can. J. Fisheries. Aquat. Sci., 57, 4049.
Jenkins, A., Camarero, L., Cosby, B.J., Ferrier, R.C., Forsius, M., Helliwell, R.C., Kopácek, J., Majer, V., Moldan, F., Posch, M., Rogora, M., Schöpp, W. and Wright, R.F., 2003. A modelling assessment of acidification and recovery of European surface waters. Hydrol. Earth Syst. Sci., 7, 447455.
Kaminski, J.W., 2002. Emissions-Scenario Simulations of New
Provincial SO2 Reduction Targets using the Acid Deposition
and Oxidant Model. Atmospheric Research and Modelling
Consultants, Toronto, Canada. 23pp.
Kurz, D., Alveteg, M., Sverdrup, H., 1998. Integrated assessment of soil chemical status. 2. Application of a regional model to 622 forested sites in Switzerland. Water Air Soil Pollut., 105, 1120.
LaZerte, B.D. and Findeis, J., 1994. Acidic leaching of a podzol Bf horizon from the Precambrian Shield, Ontario, Canada. Can.
J. Soil Sci., 75, 4354.
LaZerte, B.D. and Scott, L., 1996. Soil water leachate from two forested catchments on the Precambrian Shield, Ontario. Can.
J. Forest. Res., 26, 13531365.
Lefohn, A.S., Husar, J.D. and Husar, R.B., 1999. Estimating historical anthropogenic global sulfur emission patterns for the period 18501990. Atmos. Environ., 33, 34353444 (data: www.asl-associates.com/sulfur1.htm).
Lozano, F., 1987. Physical and chemical properties of the soils
at the southern biogeochemistry study site. Report BGC-018,
Ontario Ministry of the Environment, Dorset, Ontario, Canada. 78pp.
McNicol, D.K., Mallory, M.L., Laberge, C. and Cluis, D.A., 1998. Recent temporal patterns in the chemistry of small acid sensitive lakes in central Ontario, Canada. Water Air Soil Pollut., 105, 343351.
Mitchell, M.J., Mayer, B., Bailey, S.W., Hornbeck, J.W., Alewell, C., Driscoll, C.T. and Likens, G.E., 2001. Use of stable isotope ratios for evaluating sulfur sources and losses at the Hubbard Brook Experimental Forest. Water Air Soil Pollut, 130, 7586.
Neary, B.P. and Dillon, P.J., 1988. Effects of sulphur deposition on lake-water chemistry in Ontario, Canada. Nature, 333, 340 343.
Neary, A.J. and Gizyn, W.I., 1994. Throughfall and stemflow under deciduous and coniferous forest canopies in south-central Ontario. Can. J. Forest. Res., 24, 10891110.
OME, 1983. Handbook of Analytical Methods for Environmental
Samples. Ontario Ministry of the Environment, Rexdale,
Ontario, Canada. 246pp.
Posch, M., de Smet, P.A.M., Hettelingh, J.-P. and Downing, R.J. (Eds.), 2001. Modelling and Mapping of Critical Thresholds
in Europe, Status Report 2001. RIVM, Bilthoven, The
Netherlands. 188pp.
Prechtel, A., Alewell, C., Armbruster, M., Bittersohl, J., Cullen, J.M., Evans, C.D., Helliwell, R., Kopácek, J., Marchetto, A., Matzner, E., Meesenburg, H., Moldan, F., Moritz, K., Veselý, J. and Wright, R.F., 2001. Response of sulphur dynamics in European catchments to decreasing sulphate deposition. Hydrol.
Earth Syst. Sci., 5, 311325.
Seip, H.M., Seip, R., Dillon, P.J. and Grosbois, E.D., 1985. Model of sulphate concentration in a small stream in the Harp lake catchment, Ontario. Can. J. Fisheries Aquat. Sci., 42, 927 937.
Sirois, A., Vet, R. and MacTavish, D., 2001. Atmospheric deposition to the Turkey lakes watershed: temporal variations and characteristics. Ecosystems, 4, 503513.
Stoddard, J.L., Jeffries, D.S., Lükewille, A., Clair, T.A., Dillon, P.J., Driscoll, C.T., Forsius, M., Johannessen, M., Kahl, J.S., Kellogg, J.H., Kemp, A., Mannio, J., Monteith, D.T., Murdoch, P.S., Patrick, S., Rebsdorf, A., Skjelkvåle, B.L., Stainton, M.P., Traaen, T., Van Dam, H., Webster, K.E., Wieting, J. and Wilander, A., 1999. Regional trends in aquatic recovery from acidification in North America and Europe. Nature, 401, 575 578.
Tiktak, A. and van Grinsven, H.J.M., 1995. Review of sixteen forest-soil-atmosphere models. Ecol. Model., 83, 3553. UNECE, 2001. Expert Group Meeting on Dynamic Modelling.
EB.AIR/WG.1/2001/11 United Nations Economic Commission for Europe, Geneva, Switzerland. 6pp.
Warfvinge, P., Falkengren-Grerup, U., Sverdrup, H. and Andersen, B., 1993. Modelling long-term cation supply in acidified forest stands. Environ. Pollut., 80, 209221.
Watmough, S.A. and Dillon, P.J., 2003a. Base cation and nitrogen budgets for seven forested catchments in central Ontario. Forest
Ecol. Manage., 177, 155177.
Watmough, S.A., Aherne, J. and Dillon, P.J., 2003b. Potential impact of harvesting on lake chemistry in south-central Ontario at current levels of acid deposition. Can. J. Fisheries Aquat.