HAL Id: hal-02282131
https://hal-univ-rennes1.archives-ouvertes.fr/hal-02282131
Submitted on 10 Sep 2019
HAL is a multi-disciplinary open access
archive for the deposit and dissemination of
sci-entific research documents, whether they are
pub-lished or not. The documents may come from
teaching and research institutions in France or
abroad, or from public or private research centers.
L’archive ouverte pluridisciplinaire HAL, est
destinée au dépôt et à la diffusion de documents
scientifiques de niveau recherche, publiés ou non,
émanant des établissements d’enseignement et de
recherche français ou étrangers, des laboratoires
publics ou privés.
Mesenchymal Stromal Cells
Cédric Ménard, Joelle Dulong, David Roulois, Benjamin Hebraud, Léa
Verdière, Céline Pangault, Vonick Sibut, Isabelle Bezier, Nadège Bescher,
Céline Monvoisin, et al.
To cite this version:
Cédric Ménard, Joelle Dulong, David Roulois, Benjamin Hebraud, Léa Verdière, et al..
Inte-grated Transcriptomic, Phenotypic, and Functional Study Reveals Tissue-Specific Immune
Prop-erties of Mesenchymal Stromal Cells. STEM CELLS, AlphaMed Press, 2020, 38 (1), pp.146-159.
�10.1002/stem.3077�. �hal-02282131�
For Peer Review
Integrated transcriptomic, phenotypic, and functional study
reveals tissue-specific immune properties of mesenchymal
stromal cells
Journal: Stem Cells Manuscript ID Draft
Wiley - Manuscript Type: Original Research Date Submitted by the
Author: n/a
Complete List of Authors: Menard, Cedric; UMR U1236 MICMAC, INSERM, Université Rennes 1, Etablissement Français du Sang; SITI Laboratory, Etablissement Français du Sang, CHU Rennes
Dulong, Joëlle; SITI Laboratory, Etablissement Français du Sang Bretagne, CHU Rennes; UMR U1236 MICMAC, INSERM, Université Rennes 1, Etablissement Français du Sang
Roulois, David; UMR U1236 MICMAC HEBRAUD, Benjamin; STROMALAB VERDIERE, Lea; UMR U1236 MICMAC
PANGAULT, Celine; UMR U1236 MICMAC; CHU Rennes, Pole Biologie SIBUT, Vonick; UMR U1236 MICMAC
Isabelle, Bezier; SITI Laboratory, Etablissement Français du Sang Bretagne, CHU Rennes; UMR U1236 MICMAC
Bescher, Nadège; SITI Laboratory, Etablissement Français du Sang Bretagne, CHU Rennes; UMR U1236 MICMAC
MONVOISIN, Celine; UMR U1236 MICMAC Gadelorge, Mélanie; STROMALAB
Bertheuil, Nicolas; SITI Laboratory, Etablissement Français du Sang Bretagne, CHU Rennes; UMR U 917 INSERM, Université Rennes 1; Centre Hospitalier Universitaire de Rennes, Plastic, reconstructive and aesthetic surgery
Flecher, Erwan; Centre Hospitalier Universitaire de Rennes, Thoracic and cardiac surgery
Casteilla, Louis; UMR UPS/CNRS/EFS 5273 Inserm U1031 , STROMALab Collas, Philippe; University of Oslo, Institute of Basic Medical Sciences, Department of Biochemistry
SENSEBE, Luc; STROMALAB Bourin, Philippe; CSA21, Direction Espagnolle, Nicolas; STROMALAB
Tarte, Karin; UMR U1236 MICMAC, INSERM, Université Rennes 1, Etablissement Français du Sang; SITI Laboratory, Etablissement Français du Sang, CHU Rennes
Keywords: adipose stem cells, Bone marrow stromal cells (BMSCs), Immunosuppression, Immunogenicity, Gene expression, Cell interactions Journal Section: Translational and Clinical Research
Cell Types: Bone Marrow Stem Cells, Adipose Stem Cells/VSF
For Peer Review
Diseases/Processes/Areas: Genomics / Epigenomics / Metabolomics, Immunomodulation, Clinical Application / Translation, Cell Culture Advances 3 4 5 6 7 8 9 10 11 12 13 14 15 16 17 18 19 20 21 22 23 24 25 26 27 28 29 30 31 32 33 34 35 36 37 38 39 40 41 42 43 44 45 46 47 48 49 50 51 52 53 54 55 56
For Peer Review
ScholarOne Support: (434) 964-4100 3 4 5 6 7 8 9 10 11 12 13 14 15 16 17 18 19 20 21 22 23 24 25 26 27 28 29 30 31 32 33 34 35 36 37 38 39 40 41 42 43 44 45 46 47 48 49 50 51 52 53 54 55 56 57 58 59 60For Peer Review
Integrated transcriptomic, phenotypic, and functional study
reveals tissue-specific immune properties of mesenchymal stromal cells
Cédric Ménard
1,2, Joëlle Dulong
1,2, David Roulois
1, Benjamin Hébraud
3,
Léa Verdière
1, Céline Pangault
1,4, Vonick Sibut
1,2, Isabelle Bezier
1,2, Nadège
Bescher
1,2, Céline Monvoisin
1, Mélanie Gadelorge
3, Nicolas Bertheuil
2,5,
Erwan Flécher
6, Louis Casteilla
3, Philippe Collas
7, Luc Sensebé
3, Philippe Bourin
8,
Nicolas Espagnolle
3, and Karin Tarte
1,21
UMR 1236, Univ Rennes, INSERM, Etablissement Français du Sang Bretagne,
F-35000, Rennes, France
2
SITI Laboratory, Etablissement Français du Sang Bretagne, CHU Rennes, F-35000
Rennes, France
3
STROMALab, Etablissement Français du Sang-Occitanie (EFS), Inserm 1031,
University of Toulouse, National Veterinary School of Toulouse (ENVT), ERL5311
CNRS, Toulouse, France.
4
Pôle Biologie, CHU Rennes, F-35000 Rennes, France
5
Department of Plastic Surgery, CHU Rennes, F-35000 Rennes, France
6
Department of Thoracic and Cardiac Surgery, CHU Rennes, F-35000 Rennes,
France
7
Department of Molecular Medicine, Institute of Basic Medical Sciences, Faculty of
Medicine, University of Oslo, 0317 Oslo, Norway
8
Cell-easy, Place Pierre Potier, F-33000, Toulouse, France
C
ONTACTI
NFORMATIONKarin Tarte, INSERM U1236, Faculté de Médecine, 2 Avenue du Pr Léon Bernard,
35043 RENNES, France. e-mail:
[email protected]
Phone: +33 2 23 23 45
12, fax: +33 2 23 23 49 58
R
UNNINGT
ITLE: MSC properties rely on their tissue of origin
A
UTHOR'
S CONTRIBUTIONS:
C.M.: collection and assembly of data, data analysis and interpretation, manuscript
writing and final approval; J.D., B.H., L.V., I.B., N.B., M.G., P.C: collection and
3 4 5 6 7 8 9 10 11 12 13 14 15 16 17 18 19 20 21 22 23 24 25 26 27 28 29 30 31 32 33 34 35 36 37 38 39 40 41 42 43 44 45 46 47 48 49 50 51 52 53 54 55 56 57 58 59 60For Peer Review
2
assembly of data; D.R: data analysis and interpretation, manuscript writing; C.P.,
V.S.: data analysis and interpretation; B.H., N.B., E.F.: provision of study material or
donors; L.S.: contribution to data interpretation and manuscript writing; L.C., P.B.,
N.E.: conception and design of the study; K.T.: conception and design of the study,
financial support, data analysis and interpretation, manuscript writing and final
approval.
ScholarOne Support: (434) 964-4100 3 4 5 6 7 8 9 10 11 12 13 14 15 16 17 18 19 20 21 22 23 24 25 26 27 28 29 30 31 32 33 34 35 36 37 38 39 40 41 42 43 44 45 46 47 48 49 50 51 52 53 54 55 56 57 58 59 60For Peer Review
A
BSTRACTClinical-grade mesenchymal stromal cells (MSCs) can be expanded from bone
marrow and adipose tissue to treat inflammatory diseases and degenerative
disorders. However the influence of their tissue of origin on their functional
properties, including their immunosuppressive activity, remains unsolved. In this
study, we produced paired bone marrow-derived stromal cell (BM-MSC) and
adipose-derived stromal cell (ASC) batches from 14 healthy donors. We then
compared them using transcriptomic, phenotypic, and functional analyses and
validated our results on purified native MSCs to infer which differences were really
endowed by tissue of origin. Cultured MSCs segregated together owing to their
tissue of origin based on their gene expression profile analyzed using differential
expression and weighted gene co-expression network analysis. This translated into
distinct immune-related gene signatures, phenotypes, and functional cell interactions.
Importantly, sorted native BM-MSCs and ASCs essentially displayed the same
distinctive patterns than their in vitro-expanded counterparts. As a whole, ASCs
exhibited an immune profile consistent with a stronger inhibition of immune response
and a lower immunogenicity, supporting the use of adipose tissue as a valuable
source for clinical applications.
S
IGNIFICANCES
TATEMENTNumerous clinical trials are evaluating the therapeutic potential of mesenchymal
stromal cells (MSCs) in degenerative and inflammatory diseases. Whereas their
tissue of origin has been proposed as a crucial determinant influencing MSC
biological function, the comparison of adipose-derived (ASCs) versus bone
marrow-derived (BM-MSCs) stromal cells has been essentially performed using MSC batches
obtained from different donors, with the confounding influence of inter-individual
variability. By evaluating transcriptomic, phenotypic, and functional features of paired
ASCs and BM-MSCs expanded from the same donors, and analyzing their native
purified counterpart, we highlighted an imprinting of tissue source on MSC immune
properties and proposed adipose tissue as a source of MSCs for the treatment of
immune-mediated diseases.
3 4 5 6 7 8 9 10 11 12 13 14 15 16 17 18 19 20 21 22 23 24 25 26 27 28 29 30 31 32 33 34 35 36 37 38 39 40 41 42 43 44 45 46 47 48 49 50 51 52 53 54 55 56 57 58 59 60For Peer Review
4
I
NTRODUCTIONMesenchymal stromal cell (MSC) therapy has gained tremendous interest over the
past decade, since the seminal proof of concept of its beneficial effect in
steroid-resistant graft-versus-host disease [1,2]. MSCs have thereafter been proposed as a
valuable innovative approach in a wide array of inflammatory diseases, acute tissue
injury syndromes, and chronic degenerative disorders, and more than 900 clinical
trials involving MSCs have been registered (
http://www.clinicaltrials.gov
).
Nevertheless, the limited evidence of their effectiveness in prospective randomized
phase III trials, the lack of defined in vivo mechanism of action allowing the design of
relevant potency assays and patient monitoring strategies, together with the high cost
of regulatory approved cell productions have hampered their development in the
clinic [2,3]. Besides heterogeneity of recipients, one possible explanation for the
inconsistency in clinical results is the heterogeneity of transplanted MSC batches. In
addition to inter-individual variability in MSC donors, several critical culture-related
parameters affect MSC properties, including culture medium, scale of culture
expansion, or cell freezing [4-6]. Accordingly, we have recently shown that replicative
senescence associated with industrial-scale expansion of MSCs is associated with a
decreased capacity to inhibit T-cell proliferation [7]. Moreover, cryopreservation may
behave as an additive detrimental determinant of MSC function and potency [8].
The tissue source of MSCs was identified early as a major parameter modulating
MSC functional properties. The two major sources of clinical-grade MSCs are adult
bone marrow and adipose tissue. Both of them allow the generation of large number
of cells expressing the minimal MSC phenotype, i.e. CD45
negCD31
negCD14
negCD105
posCD73
posCD90
pos, and displaying anti-inflammatory properties in vitro [4].
Cultured adipose-derived stromal cells (ASCs) and bone marrow-derived stromal
cells (BM-MSCs) have been proposed to exhibit specific phenotypes, differentiation
potentials, secretomes, exosome contents, DNA methylation signatures, as well as
transcriptomic, proteomic, and metabolomic profiles [9-14]. However these findings
are not consistent, raising the hypothesis that in vitro culture could alter the impact of
MSC tissue source. Importantly, MSC clinical efficacy relies on their paracrine activity
including their ability to dampen innate and adaptive immune response [1].
Heterogeneity of MSC production processes but also of immunological assays used
to evaluate the impact of MSC tissue sources on their anti-inflammatory and
immunosuppressive properties have produced conflicting results [15,16].
ScholarOne Support: (434) 964-4100 3 4 5 6 7 8 9 10 11 12 13 14 15 16 17 18 19 20 21 22 23 24 25 26 27 28 29 30 31 32 33 34 35 36 37 38 39 40 41 42 43 44 45 46 47 48 49 50 51 52 53 54 55 56 57 58 59 60
For Peer Review
Nevertheless, several reports argue for a superiority of ASCs over BM-MSCs to
inhibit T-cell activation, in relationship with an increased capacity to produce the
immunosuppressive enzyme indoleamine-2,3 dioxygenase (IDO) [17-19].
Strikingly, comparative studies of ASC versus BM-MSC properties almost exclusively
analyze MSCs obtained from different donors, sometimes even propagated in
different culture conditions, thus precluding any conclusion on the specific role of
MSC tissue-of-origin on the observed variability [15]. In addition, they generally
include low numbers of MSC batches, maximizing the influence of inter-individual
variability. The only large comparison of ASCs and BM-MSCs obtained from the
same donors exclusively focused on in vitro immunological functional assays without
any evaluation of the molecular mechanisms underlying differences in MSC-driven
immunosuppression [20]. Finally no study has checked whether the observed
differences could be detected in situ in native MSCs. Overall, the decision to use
ASCs versus BM-MSCs is typically motivated by proprietary concerns rather than by
validation of their superiority in standardized assays.
The present work was designed to conclude on the biological significance of taking
into account MSC tissue source in the design of MSC-based trials. For the first time,
we combined transcriptomic, phenotypic, and functional analyses performed on
ASCs and BM-MSCs obtained from the same 14 donors, and cultured under identical
clinical grade-like conditions. We identified, using a combination of differential
expression, pathway analysis, and weighted gene co-expression network analysis
(WGCNA), a specific gene expression profile (GEP) of BM-MSCs versus ASCs with
enrichment for niche-related versus immune related genes. Importantly, we
highlighted the same specificities in sorted native BM-MSCs (nBM-MSCs) versus
ASCs (nASCs), reinforcing the hypothesis of an imprinting of tissue source on MSC
properties. Interestingly, these differences have direct functional consequences on
the capacity of MSCs to interact with immune cells. Our results add a new rationale
to support the use of adipose tissue as a source of MSCs for the treatment of
immune-mediated diseases.
M
ATERIALS ANDM
ETHODSCultured MSC production and phenotypic characterization
Healthy donor recruitment followed institutional review board approval and written
informed content process according to the revised Declaration of Helsinki was
3 4 5 6 7 8 9 10 11 12 13 14 15 16 17 18 19 20 21 22 23 24 25 26 27 28 29 30 31 32 33 34 35 36 37 38 39 40 41 42 43 44 45 46 47 48 49 50 51 52 53 54 55 56 57 58 59 60For Peer Review
6
obtained. Fourteen donors were enrolled in this study (3 women and 11 men; median
age: 36 [21-57]; Body Mass Index: 16.5 to 25) and provided bone marrow aspirates
(iliac crest) and lipoaspirates (abdominal fat layer). ASCs were obtained after
digestion with 0.4U/mL clinical grade-NB4 collagenase (Roche Diagnostics,
Mannheim, Germany) for 45 min at 37°C, filtration, and centrifugation to obtain the
stromal vascular fraction (SVF) [21]. SVF was seeded at 4.10
3cells/cm
2onto
CellSTACK closed cell culture chambers (Corning, Lowel, MA) in
MEM
(Macopharma, Tourcoing, France) supplemented with 10% screened fetal calf serum
(Hyclone, Logan, UT) and 10g/mL ciprofloxacin. Paired BM-MSCs were produced in
parallel from unprocessed bone marrow seeded at 5.10
4cells/cm
2in the same
culture dishes and medium as those used for ASCs. For both MSC types, medium
was renewed twice weekly until cells reached confluence (end of passage 0 (P0)).
Cells were then detached using trypsin, reseeded at 1000/cm
2until near confluence
(end of P1) and subsequently harvested and cryopreserved until use. Additional ASC
and BM-MSC batches were obtained with the same process from an independent set
of healthy donors for validation experiments. For further use, MSCs were thawed,
seeded at 1000 cells/cm
2and cultured until 80% confluence. All subsequent
phenotypic and functional experiments were performed at the end of P2. In particular,
MSCs were assessed by flow cytometry for HLA-DR, CD14, CD90, CD73, CD45,
CD34, CD105, CD146 (Beckman Coulter, Villepinte, France), CD31 (eBioscience,
Paris, France), and VCAM-1 (Becton-Dickinson, Le Pont de Claix, France) as
previously described [17]. Acquisition files were analyzed with Kaluza software
(Beckman-Coulter) and data expressed as the ratio of mean fluorescence intensity
(rMFI) obtained for each marker and its matched isotypic control antibody.
Gene expression profiling of cultured MSC
Whole genome gene expression profiling was performed on 14 BM-MSCs and 14
autologous ASCs at the end of P1 using Affymetrix Human Gene 1.0 ST microarrays
(Affymetrix, Santa Clara, CA) and data were analyzed with R package Limma
(v3.32.10). Non-redundant gene datasets were first generated after GCRMA
normalization by retaining for each gene the probeset with the highest expression.
Normalized data were visualized by PCA analysis using the R package EMA.
Pearson correlation with pairwise complete observation was then performed and
visualized using heatplot function of the R package made4. Euclidian distance was
ScholarOne Support: (434) 964-4100 3 4 5 6 7 8 9 10 11 12 13 14 15 16 17 18 19 20 21 22 23 24 25 26 27 28 29 30 31 32 33 34 35 36 37 38 39 40 41 42 43 44 45 46 47 48 49 50 51 52 53 54 55 56 57 58 59 60
For Peer Review
calculated with the R package stats with ward D2 parameter. Differentially expressed
genes were identified based on an adjusted p-value <0.05 (by Benjamini-Hochberg
method) and were visualized as an heatmap with the heatplot function in R.
As a secondary method of analysis, we used the WGCNA R package [22] to identify
modules of co-expressed genes among the 13 paired MSC batches identified as
correctly segregated by the unsupervised Pearson correlation analysis. For this
analysis, we retained the top 25% most variable genes. Expression matrix was log2
transformed and the network was constructed by Pearson correlation considering a
soft threshold power () value identified with the function Pick Soft Threshold in order
to avoid the selection of an arbitrary cut-off. Then, a topological overlap metric (TOM)
matrix was derived from the gene expression matrix and the dissimilarity of TOM was
calculated. Hierarchical clustering tree was created and modules were generated by
the dynamic tree cut method, with a minimum module size of 100 and a deepSplit of
2. Each module was marked by a color. The module eigengenes (ME) were then
assigned to each cell type and visualized as a box-plot. To determine if
co-expression modules were associated with tissue of origin, we performed a Wilcoxon
Signed-Rank test. For the most relevant modules, gene expression was visualized
with a heatmap using the heatplot function of the R package. Finally, module
genelists were used for downstream enrichment pathway using the Ingenuity
Pathway Analysis software (QIAGEN Bioinformatics).
For some genes, expression level was also assessed by Q-PCR, as previously
described [17]. Briefly, after RNA extraction, gene expression was quantified using
Taqman assay-on-demand reagents and an ABI Prism 7000 (Applied Biosystems,
Courtaboeuf, France) with the CT calculation method. PCR data were normalized to
the geometric mean of the two housekeeping genes (CDKN1B and EIF2B1). Results
were further standardized by comparison to gene expression of a pool of 5 peripheral
blood mononuclear cells (PBMC).
Analysis of native MSCs
VCAM-1 and HLA-DR expression was assessed on native MSCs after enzymatic
digestion of 6 lipoaspirates and 6 BM aspirations with the same protocol. Briefly,
unprocessed tissue samples were incubated for 45min at 37°C with 200IU/mL type
IV collagenase, 1.6IU/mL neutral protease (Worthington, Lakewood, NJ), and
10U/mL DNAse (Pulmozyme
®, Genentech, San Francisco, CA). Digested tissues
3 4 5 6 7 8 9 10 11 12 13 14 15 16 17 18 19 20 21 22 23 24 25 26 27 28 29 30 31 32 33 34 35 36 37 38 39 40 41 42 43 44 45 46 47 48 49 50 51 52 53 54 55 56 57 58 59 60For Peer Review
8
were then filtered, washed, and stained with DAPI viability dye and for CD45,
CD235a, CD11b (Beckman Coulter) and CD31 (eBioscience) to gate out
hematopoietic and endothelial cells, and CD73, CD146, CD106 (Becton-Dickinson),
CD34 (eBioscience), and CD271 (Miltenyi Biotec, Bergisch Gladbach, Germany) to
gate
stromal
cells
subsets.
nBM-MSCs
were
gated
as
CD45/CD235a/CD11b/CD31
negCD34
negCD73
posCD271
posand
nASCs
as
CD45/CD235a/CD11b/CD31
negCD34
posCD73
posCD146
neg(see gating strategy in
Figure S1) and VCAM-1 and HLA-DR expression was evaluated on both subsets.
For sorting of nBM-MSCs, BM mononuclear cells were first collected from
enzymatically-digested BM using Ficoll gradient and depleted for CD45
poscells using
CD45-coupled magnetic beads (Dynabeads, Thermo Fisher Scientific). nBM-MSCs
(n=7) and nASCs (n=10) were purified on a FacsAria II cell sorter (Becton Dickinson).
Gene expression level in native MSCs was assessed using the Fluidigm BioMark HD
system. Briefly, cDNAs were obtained using the Fluidigm reverse transcription
Master Mix and were then pre-amplified for 18 cycles in the presence of Pre-Amp
Master Mix and pooled Taqman assay mix. Gene expression was then measured
with the TaqMan Gene Expression Master Mix on a 48.48 Dynamic Array IFC. After
quality control check, gene expression was calculated with the CT calculation method
and CDKN1B and EIF2B1 as housekeeping genes.
Impact of MSCs on immune cell apoptosis and adhesion
MSC ability to support survival of immune cells was evaluated as described [17].
Briefly, paired ASCs and BM-MSCs obtained from the same donors were cocultured
with peripheral blood B (1/1 B/MSC ratio), and T cells (10/1 T/MSC ratio) purified
using negative selection kits (Miltenyi Biotec, purity >97%). After 3 (B cells) or 7 (T
cells) days of coculture, the percentage of apoptotic lymphocytes was assessed by
flow cytometry with the Active Caspase-3 Apoptosis kit (Becton-Dickinson) after
gating on CD45
posevents. This allowed for the calculation of the percentage of
inhibition of apoptosis with the following formula: (percentage of caspase-3
poswithout
MSC - percentage of caspase-3
poswith MSC) / (percentage of caspase-3
poswithout
MSC)*100.
For adhesion experiments, B cells were stained with 2µM CFSE (Interchim,
Montluçon, France) and platted onto MSC layer for 2 hours as described [23]. After
washing in PBS, fluorescence of residual adherent B cells was recorded on a
ScholarOne Support: (434) 964-4100 3 4 5 6 7 8 9 10 11 12 13 14 15 16 17 18 19 20 21 22 23 24 25 26 27 28 29 30 31 32 33 34 35 36 37 38 39 40 41 42 43 44 45 46 47 48 49 50 51 52 53 54 55 56 57 58 59 60
For Peer Review
Varioskan (Thermofisher) and the percentage of adherent cells was calculated by
comparing with the fluorescence of the input. In some experiments, BM-MSCs were
transfected with VCAM-1 siRNA (3 pooled Stealth iRNA, Life Technologies,
Saint-Aubin, France) or a control siRNA (Negative Control Medium GC, Life Technologies)
with HiPerfect Transfection Reagent (Qiagen). Briefly, 20.000 BM-MSC were plated
in 96-wells flat-bottomed plates and incubated for 2 days with the transfection mix
containing siRNA (50nM each). Efficient downregulation of VCAM-1 expression was
confirmed by flow cytometry (Figure S2).
MSC chemoattractive properties
CXCL1 and CXCL16 were quantified in MSC supernatant at the end of P2 by ELISA
(R&D Systems, Abington, UK) and expressed as the quantity per million of cultured
MSCs.
Migration of neutrophils in response to conditioned MSC supernatants was assessed
as previously described [24] with slight modifications. Briefly, peripheral blood
neutrophils freshly purified using whole blood CD15 microbeads on an AutoMACS
®apparatus (Miltenyi Biotech) were added to the upper compartment of Transwell
chambers with 5-µm pore filters in migration medium (RPMI supplemented with 0.1%
human albumin). Lower chambers contained MSC-conditioned supernatants
obtained after 3 days of MSC culture in migration medium. The absolute number of
viable DAPI
negCD66
posCD16
posneutrophils was quantified in the lower chamber after
a 2-hour migration using FlowCount beads by flow cytometry.
MSC immunosuppressive properties
Inhibition of T and NK cells proliferation was performed as previously described [17].
Briefly, purified peripheral blood T and NK cells were stained with 0.2µM CFSE and
activated for 6 days in coculture with MSCs at 10/1 and 1/1 ratios respectively. T
cells were activated with 0.5µg/mL agonistic anti-CD3 and anti-CD28 antibodies
(Sanquin, Amsterdam, The Netherlands) whereas NK cells were activated by
100IU/mL rhIL-2 (Proleukin
®, Novartis Pharma, Basel, Switzerland). The percentage
of proliferating immune cells was quantified by flow cytometry as the proportion of
cells having undergone more than one division using ModFit LT 3.0 software (Verity
Software, Topsham, ME). This allowed for the calculation of the percentage of
inhibition of proliferation with the following formula: (percentage of proliferation
3 4 5 6 7 8 9 10 11 12 13 14 15 16 17 18 19 20 21 22 23 24 25 26 27 28 29 30 31 32 33 34 35 36 37 38 39 40 41 42 43 44 45 46 47 48 49 50 51 52 53 54 55 56 57 58 59 60For Peer Review
10
without MSC - percentage of proliferation with MSC) / (percentage of proliferation
without MSC)*100.
IDO activity was calculated after quantification of tryptophan and kynurenine
catabolite by high-performance liquid chromatography using added 3-nitro-L-tyrosine
as an internal standard, as previously described [25]. Results were expressed as the
kynurenine to tryptophan ratio in the supernatant of MSC primed or not with IFN
(R&D Systems).
Statistical analysis
Differences between groups were analyzed with Prism software version 5.03
(GraphPad, La Jolla, CA) using the Wilcoxon test for matched pairs or the
Mann-Whitney non-parametric U test for unpaired samples. Differences in dose-response
to IFN stimulation in ASCs versus BM-MSCs were tested with a 2-way ANOVA
using Bonferroni's post-hoc multiple comparisons tests. In all cases, a cutoff value of
p<0.05 was used to reach statistical significance.
R
ESULTSASC and BM-MSC display tissue-specific molecular imprinting
To investigate the net impact of tissue source on cultured MSC properties while
minimizing inter-individual variability, MSCs were produced in the same culture
medium from paired adipose tissue and bone marrow samples collected from 14
healthy individuals. At the end of the first passage (P1), all MSC batches fulfilled the
identity criteria including lack of residual hematopoietic and endothelial cells,
homogeneous expression of CD90, CD105 and CD73 (Figure S3A). As previously
reported CD34 was not expressed on BM-MSCs whereas it could be detected on
17.5 % [0.5-30.7%] of ASCs (n=14). All subsequent experiments were performed at
the end of P2 to limit the additional variability associated with large-scale expansion,
and closely mimic clinical grade-MSCs used in successful clinical trials.
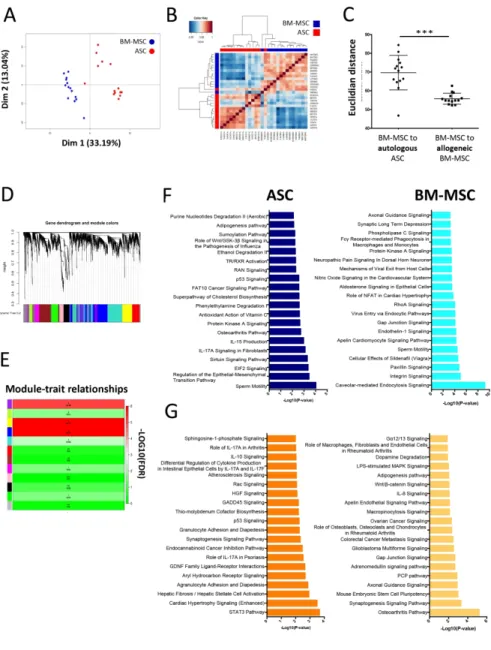
We first performed an unbiased transcriptomic analysis using Affymetrix microarrays.
Principal Component Analysis including all normalized unique genes (20507 genes)
adequately segregated ASCs from BM-MSCs (Figure 1A). Interestingly, ASC GEP
showed a higher heterogeneity than BM-MSC GEP, extending a previous report
obtained on a limited number of unpaired allogeneic samples [12]. These data were
confirmed by a Pearson correlation analysis in which paired ASCs and BM-MSCs
ScholarOne Support: (434) 964-4100 3 4 5 6 7 8 9 10 11 12 13 14 15 16 17 18 19 20 21 22 23 24 25 26 27 28 29 30 31 32 33 34 35 36 37 38 39 40 41 42 43 44 45 46 47 48 49 50 51 52 53 54 55 56 57 58 59 60
For Peer Review
were essentially segregated with a higher level of similarities between BM-MSCs
than ASCs (Figure 1B). To better compare the impact of tissue origin versus
inter-individual variability, we further calculated the Euclidian distance between each
BM-MSC and its paired ASC and compared it to the Euclidian distance between each
BM-MSC and all the other BM-MSCs (Figure 1C). BM-MSCs were significantly closer
to allogeneic BM-MSCs than to autologous ASCs confirming that MSC tissue source
impacted MSC transcriptomic heterogeneity to a greater extent than inter-individual
variability.
We next applied a WGCNA to identify transcriptional modules of co-expressed genes
and evaluate whether they were related to MSC tissue source. First, the sample
clustering based on Euclidian distance obtained with the WGCNA package (Figure
S4A) is in accordance with our previous observations, showing a separation between
ASCs and BM-MSCs and a higher heterogeneity of the ASCs population. The
coexpression network was constructed by Pearson correlation considering a
soft-thresholding power β of 8 (Figure S4B). Following dynamic tree cut, the gene
clustering dendrogram identified 12 distinct gene modules including the grey module
corresponding to unassigned gene (Figure 1D). After the modules were generated,
we evaluated their relationship with MSC tissue of origin by using a Wilcoxon
Signed-Rank test to determine whether the module eigengenes, defined as the principal
component of each module and summarizing the gene expression profile of these
modules, were significantly different in ASCs versus BM-MSCs (Figure 1E). Three
modules were significantly associated with the MSC tissue source: Purple module
(264 genes, P= 1.346e-06), Yellow module (459 genes, P= 1.92e-07), and Blue
module (P= 1.92e-07) (Figure 1E and S4C). Heatmap representation of these gene
modules revealed that, conversely to the Purple module, the gene expression profiles
of the Yellow and Blue modules perfectly segregated ASCs and BM-MSCs (Figure
S4D). In order to draw a functional profile of these 2 modules, we extracted two
genelists per module, one corresponding to the genes overexpressed in ASCs and
one to the genes overexpressed in BM-MSCs, and analyzed them with IPA (Figure
1F-G). Interestingly, both Yellow and Blue modules revealed a strong enrichment for
immune-related pathways in ASCs. Altogether, our two unsupervised analysis
methods clearly indicate that ASCs and BM-MSCs display strongly different
transcriptomic profiles that could be functionally relevant for their clinical application.
3 4 5 6 7 8 9 10 11 12 13 14 15 16 17 18 19 20 21 22 23 24 25 26 27 28 29 30 31 32 33 34 35 36 37 38 39 40 41 42 43 44 45 46 47 48 49 50 51 52 53 54 55 56 57 58 59 60For Peer Review
12
Differentially regulated functional pathways in BM-MSCs versus ASCs
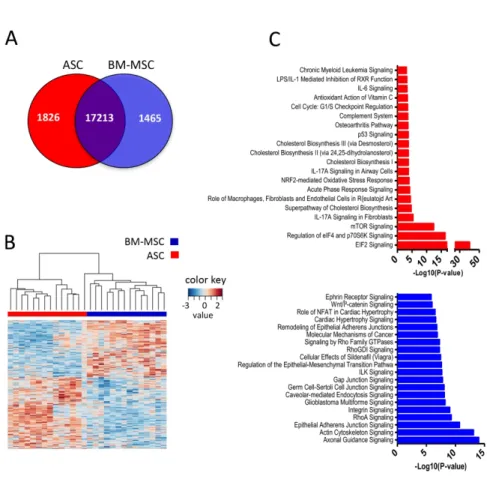
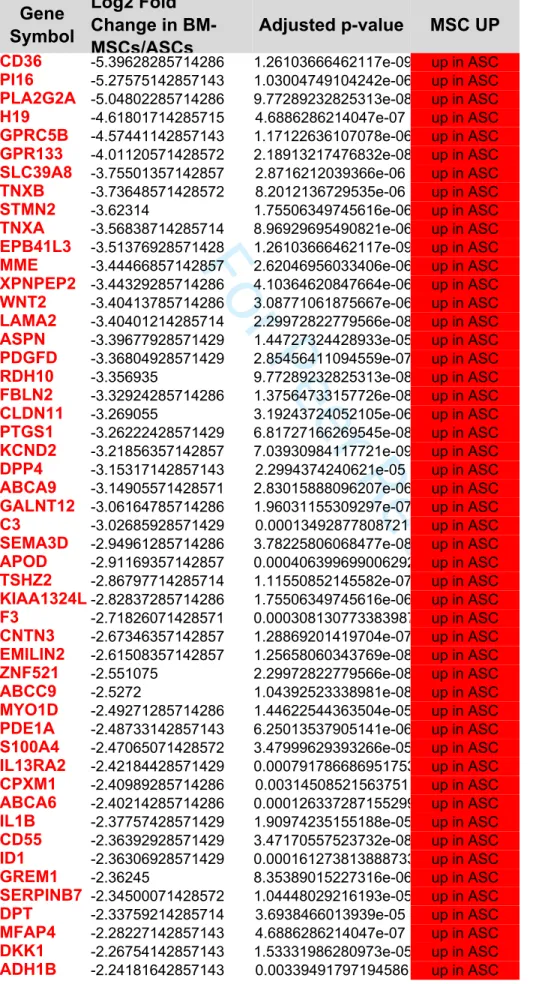
Comparison of the GEP of the 28 paired BM-MSCs and ASCs revealed 3291
differentially expressed unique genes (adjusted P value <0.05 using
Benjamini-Hochberg method, Figure 2A-B), including 208 genes up-regulated more than 2-fold
in BM-MSCs and 263 genes up-regulated more than 2-fold in ASCs (log2 FC >1 or
<-1, Table S1).
As expected, BM-MSC signature was strongly enriched for genes involved in
osteogenic and chondrogenic differentiation programs and in the function of
osteoblasts and chondrocytes. These include the osteoblastic marker BGLAP, the
chondrocytic marker ACAN, the transcription factors RUNX3, RUNX2, DLX5, DLX6,
and SOX9, the regulator of bone formation NRP3, the modulators of pyrophosphate
metabolism ANKH and ENPP1, or TNFRSF19, described as a positive regulator of
MSC differentiation into osteoblasts while decreasing adipogenesis [26]. Similarly,
RhoA signaling, identified as one of the most significant BM-MSC specific pathway
using IPA (Figure 2C), has been proposed as a key driver of mechanotransduction in
osteoblasts [27]. Canonical Wnt signaling is also essential for osteoblast
differentiation and several members of the Wnt pathway were overexpressed in
BM-MSCs, whereas ASCs overexpressed some of the main Wnt inhibitors such as
SFRP1 or DKK1 (Figure 2C and Table S1). BM-MSCs exhibited a higher capacity to
differentiate into chondroblasts in vitro compared to ASCs whereas osteoblastic
differentiation was similar (Figure S5A-C). Conversely, ASCs displayed activation of
molecular pathways related to cholesterol biosynthesis and CD36, the most strongly
upregulated ASC gene, is a marker of human adipocyte precursors [28]. Moreover,
ASCs displayed a higher capacity to differentiate into adipocytes in vitro (Figure
S5D). Altogether, these data definitively confirm that in vitro cultured MSCs retain the
main tissue-specific features of their anatomic origin.
Interestingly, cultured BM-MSC overexpressed genes associated with pericytic BM
niche, including a gene set associated with vascular smooth muscle contractility and
pericyte identity (CSPG4, ACTA2, MCAM, ITGA7, NOTCH3, MYH9, and MYH11)
[29,30] but also extracellular matrix components, including FNDC1, ACAN, COL4A1,
COL4A2, HAPLN1, and SRGN; members of the TGF
family (GDF5, GDF6,
TGFB2); and numerous integrins (ITGA3, ITGA7, ITGA8, ITGA11, ITGB2) (Table
S1). Overexpression of the pericytic marker CD146/MCAM was confirmed at the
protein level (Figure S3B). Conversely, ASC-specific GEP revealed pathways related
ScholarOne Support: (434) 964-4100 3 4 5 6 7 8 9 10 11 12 13 14 15 16 17 18 19 20 21 22 23 24 25 26 27 28 29 30 31 32 33 34 35 36 37 38 39 40 41 42 43 44 45 46 47 48 49 50 51 52 53 54 55 56 57 58 59 60
For Peer Review
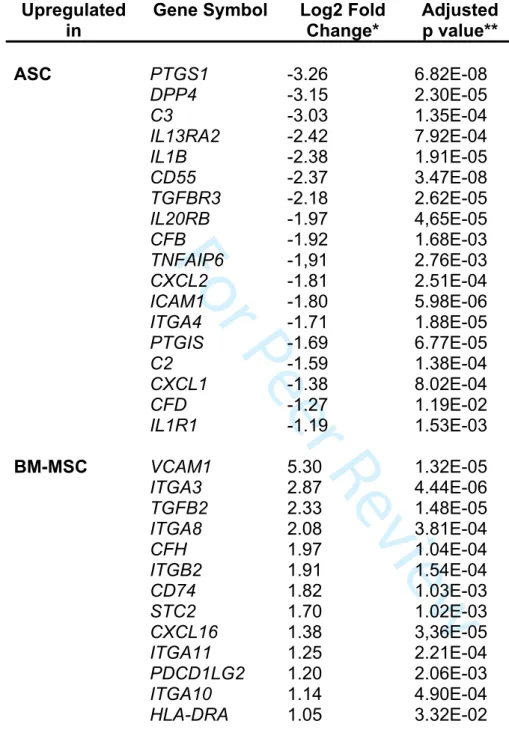
to inflammatory and immune response (Figures 2C). In agreement, numerous
immune-related genes were found differentially expressed between ASCs and
BM-MSCs (Table 1).
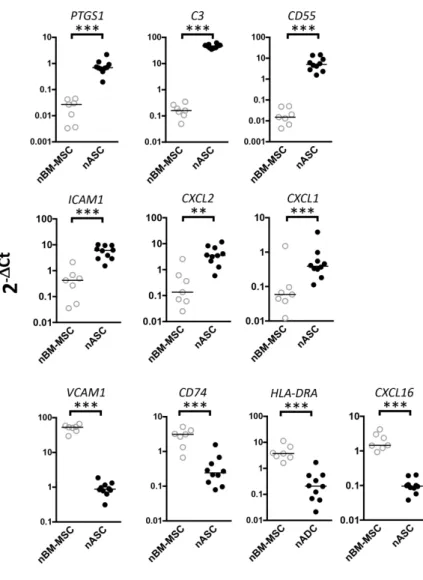
In order to determine whether these differences reflected features of native MSCs or
represented
a
culture
artifact,
we
sorted
CD45
negCD235a
negCD11b
negCD31
negCD73
posCD271
posBM mononuclear cells, corresponding to nBM-MSCs, and
CD45
negCD235a
negCD11b
negCD31
negCD34
posCD146
negcells from adipose tissue
stromal vascular fraction, corresponding to nASCs (Figure S1) and analyzed the
expression of 10 genes previously found differentially expressed on their cultured
counterpart [31,32]. Interestingly, we demonstrated that nASCs significantly
overexpressed PTGS1, involved in the production of the immunosuppressive
molecule PGE2, the complement system members C3 and CD55, the adhesion
molecular ICAM1, and the CXCR2 ligands CXCL1 and CXCL2. Similarly, nBM-MSCs
significantly overexpressed VCAM1, antigen presentation molecules CD74 and
HLA-DRA, and the chemokine CXCL16 (Figure 3). These data clearly argue for a strong
imprinting of the tissue of origin on the immune properties of cultured MSCs. We thus
decided to further examine the functional consequences of these molecular
differences on tissue-specific MSC immune properties.
BM-MSCs and ASCs differentially trigger immune cell adhesion and recruitment
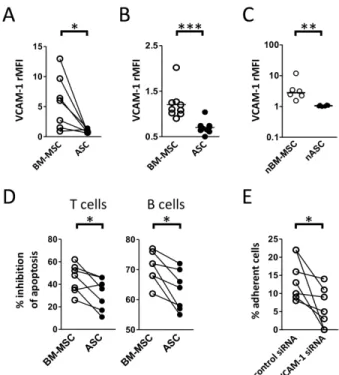
VCAM-1 was the second most strongly upregulated gene in BM-MSCs. At the protein
level VCAM-1 was consistently detected only on BM-MSCs but not on paired ASC
counterparts and we further validated this finding on independent MSC batches
(Figure 4A-B). Interestingly, nBM-MSCs systematically but variably expressed
VCAM-1 whereas nASCs were virtually VCAM-1 negative (Figure 4C). VCAM-1 plays
a major role in the anti-apoptotic activity of stromal cells towards immune cells, in
particular immature and mature B and T cells expressing the VCAM-1 ligand VLA-4.
Moreover, VCAM-1/VLA-4 interaction was proposed years ago as a main
determinant of the interaction between pericytes and lymphocytes [33]. We thus
wondered whether cultured MSCs could differentially support B and T-cell survival
depending on their tissue origin. Strikingly, BM-MSCs protected B and T cells from
spontaneous apoptosis in vitro significantly better than their paired ASC counterparts
(Figure 4D). In addition, efficient inhibition of VCAM-1 expression in BM-MSCs by
siRNA reduced their capacity to trigger B-cell adhesion (Figure 4E).
3 4 5 6 7 8 9 10 11 12 13 14 15 16 17 18 19 20 21 22 23 24 25 26 27 28 29 30 31 32 33 34 35 36 37 38 39 40 41 42 43 44 45 46 47 48 49 50 51 52 53 54 55 56 57 58 59 60
For Peer Review
14
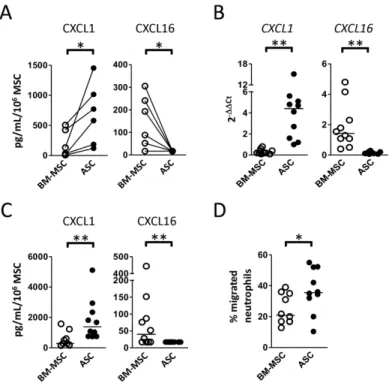
Apart from adhesion molecules, chemokines also orchestrate the interaction between
MSCs and immune cells and both CXCL1, CXCL2, and CXCL16 belonged to the
most strongly differentially expressed genes between cultured and native ASCs and
BM-MSCs (Table 1 and Figure 3). We validated these differences at the protein level
on our paired series of cultured BM-MSCs and ASCs as well as in independent MSC
batches. As expected, ASCs secreted higher amounts of CXCL1, involved in the
recruitment of innate myeloid cells in particular neutrophils, whereas BM-MSCs
secreted higher amounts of CXCL16, the ligand for CXCR6-expressing memory T
cells and monocytes (Figure 5 A-C). Moreover, we could show that, whereas
BM-MSCs and ASCs produced the same amount of CXCL8/IL-8, ASCs were significantly
more efficient in triggering neutrophil attraction, in agreement with their higher
production of CXCL1 and CXCL2, the two other CXCR2 ligands (Figure 5D).
BM-MSCs and ASCs differentially elicit immune response suppression
The bidirectional crosstalk of infused MSCs with resident immune cells is pivotal for
their clinical efficacy. The detection of humoral alloimmunization in recipients of
allogeneic MSCs together with the lack of persistence of infused MSCs demonstrate
that MSCs are not immune-privileged [2]. However, protecting MSCs from immune
detection and prolonging their life-span in vivo may improve clinical outcome [34].
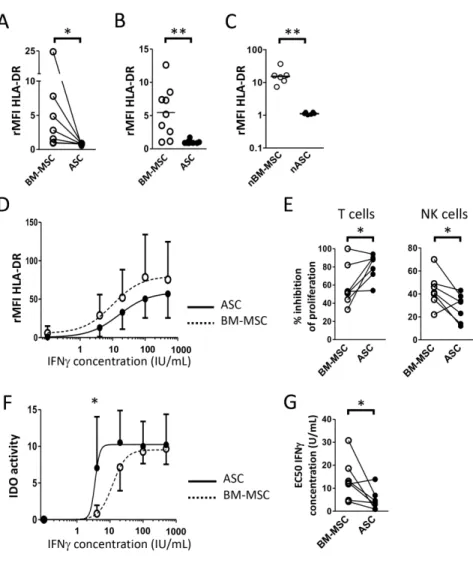
Cultured and native BM-MSCs were found to overexpress HLA-DRA and CD74, both
involved in antigen presentation to CD4
posT cells (Table 1 and Figure 3). We could
further confirm surface HLA-DR overexpression on BM-MSCs compared to ASCs in
our paired MSC samples, but also on independent cultured MSC batches, and on
native MSCs (Figure 6 A-C). HLA-DR is induced on MSCs upon exposition to
inflammatory cues [17]. We thus tested whether the differential HLA-DR expression
between ASCs and BM-MSCs was retained following stimulation by increasing doses
of IFN. Cultured ASCs and BM-MSCs similarly enhanced their HLA-DR expression
in response to inflammatory stimuli with a maximum of MHC class II expression at
100IU/mL of IFN, demonstrating their similar capacity to activate IFN-dependent
signaling pathway. As a consequence, the level of expression of HLA-DR remained
lower on inflamed ASC than on inflamed BM-MSC (Figure 6D). These data
suggested that ASCs could better escape to recognition by CD4
posT cells. In
addition, their higher expression of the cell-surface complement inhibitor CD55
(Table 1), previously shown to crucially regulate MSC sensitivity to
complement-ScholarOne Support: (434) 964-4100 3 4 5 6 7 8 9 10 11 12 13 14 15 16 17 18 19 20 21 22 23 24 25 26 27 28 29 30 31 32 33 34 35 36 37 38 39 40 41 42 43 44 45 46 47 48 49 50 51 52 53 54 55 56 57 58 59 60
For Peer Review
dependent cytotoxicity [35], could favor their escape from initial immune attack in
vivo.
We then used our previously established standardized tools to compare the capacity
of paired ASCs and BM-MSCs to inhibit activated T cell and NK cell proliferation in
vitro [17]. Strikingly, ASCs decreased significantly better T cell proliferation and
BM-MSCs significantly better NK cell proliferation (Figure 6E). We and others have
shown that IDO activity is the main mechanism supporting the capacity of human
MSCs to suppress T cells, unlike NK cells [17]. IDO is not expressed by resting
MSCs but is induced by IFN produced by activated T and NK cells. We thus
assessed IDO activity in ASCs and BM-MSCs licensed with increasing doses of IFN.
We showed that ASCs required significantly less IFN to reach the maximum IDO
activity than BM-MSCs (Figure 5 F-G). Thus, whereas ASCs and BM-MSCs have the
same intrinsic capacity to respond to IFN signaling, as highlighted by parallel curves
of HLA-DR induction, ASCs express higher functional immunosuppressive enzyme
IDO in response to a low dose of IFN.
D
ISCUSSIONTissue origin has been proposed for a long-time as a potential determinant of
clinical-grade MSC clinical efficacy. However, how intrinsic disparities between BM-MSCs
and ASCs could be related to their capacity to interact with immune effectors and
modulate immune response has not been extensively explored. In the present study,
we demonstrated for the first time on a large series of ASCs and BM-MSCs obtained
from the same donors and on purified nASCs and nBM-MSCs the strong impact of
tissue origin on MSC properties. Moreover, we pinpointed that ASCs could be an
interesting alternative to BM-MSCs for therapeutic applications considering their
huge expression of anti-inflammatory and immunosuppressive molecules.
First, ASCs endorsed stronger IDO activity in response to low dose IFN- stimulation,
thereafter inhibiting more efficiently T-cell proliferation. Interestingly, ASCs display a
higher proliferative capacity in vitro and enter senescence at a later time-point
compared to BM-MSCs thus delaying the risk of proteasomal degradation of IDO that
characterizes senescent MSCs [7]. In agreement, the clinical impact of culture
expansion has been validated by the demonstration that late-passage MSCs were
less effective than early-passage MSCs to control acute graft-versus-host-disease
3 4 5 6 7 8 9 10 11 12 13 14 15 16 17 18 19 20 21 22 23 24 25 26 27 28 29 30 31 32 33 34 35 36 37 38 39 40 41 42 43 44 45 46 47 48 49 50 51 52 53 54 55 56 57 58 59 60For Peer Review
16
[36]. Of note, the IDO
hiphenotype of ASCs could be further reinforced by the direct
contact with innate myeloid cells, a key step in tissue repair and regeneration. In fact
the interplay between MSCs and inflammatory macrophages was recently shown to
trigger IDO expression and activity in MSCs in a CD54-dependent manner [37] and
ASCs overexpressed CD54/ICAM-1 compared to BM-MSCs.
Second, resting ASCs overexpressed TSG-6, involved in the early inhibition of
neutrophil and macrophage activity at sites of inflammation. Kynurenic acid, a
tryptophan metabolite generated by IDO, was recently shown to enhance TSG-6
expression through the activation of aryl hydrocarbon receptor (AhR), which binds to
TNFAIP6 promoter [38]. This amplification loop between the two main MSC
immunosuppressive mediators could contribute to the higher TSG-6 expression in
ASCs primed by inflammatory stimuli. TSG-6 was proposed to directly impact the
NF-B dependent activation of macrophages by TLR ligands [39] whereas IDO has been
implicated in the differentiation of monocytes into IL-10-secreting immunosuppressive
macrophages [40]. It is thus tempting to speculate that, besides their strong capacity
to inhibit T cells and their interest for the treatment of T cell-mediated immune
disorders, ASCs would be particularly effective in modulating the inflammatory
response mediated by macrophages. In addition, we revealed that ASCs recruited
more efficiently neutrophils than BM-MSCs, whereas they overexpressed TSG-6,
recently identified as a CXCL8-binding protein inhibiting neutrophil transendothelial
migration and chemotaxis [41]. However, TSG-6 does not bind to CXCL1/CXCL2,
both upregulated in ASCs, and has no effect on CXCL1-mediated neutrophil
transmigration.
Finally, ASCs were virtually HLA-DR
negand retained a lower HLA-DR expression
under inflammatory stimuli compared to BM-MSCs. This property could be clinically
relevant in relationship with the increasing use of MSCs in allogeneic setting.
However, a comparison of alloimmunization rates in homogeneous patients receiving
ASCs versus BM-MSCs is currently lacking to conclude on the lower immunogenicity
of ASCs. Interestingly, we highlighted for the first time an upregulation of components
of the complement activation cascade in ASC transcriptomic profile. Complement
components were recently identified as promoters of immunological tolerance
through their capacity to promote development of myeloid-derived suppressor cells
(MDSCs) [42]. In particular, liver stromal cells, like ASCs, produce C3, Factor B, and
Factor D resulting in the formation of activation products iC3b and C3d that trigger
ScholarOne Support: (434) 964-4100 3 4 5 6 7 8 9 10 11 12 13 14 15 16 17 18 19 20 21 22 23 24 25 26 27 28 29 30 31 32 33 34 35 36 37 38 39 40 41 42 43 44 45 46 47 48 49 50 51 52 53 54 55 56 57 58 59 60
For Peer Review
dendritic cell differentiation into MDSCs [43]. The role of complement activation in the
immunosuppressive activity of MSCs deserves further investigations. Importantly, it
has to be noted that ASCs were conversely less potent than BM-MSCs at preventing
NK cell proliferation, in agreement with the lack of reversion of MSC-dependent
NK-suppressive activity by IDO inhibitors [44,45]. In addition, BM-MSCs overexpressed
PD-L1/CD274 and staniocalcin-2 (STC2), two suppressive molecules affecting
CD8
posT cell activation and synthesis of inflammatory cytokines [44,45].
The mechanisms underlying the higher IDO activity in ASCs in response to IFN are
still unclear whereas IDO expression and activity has been reproducibly correlated
with the capacity of human MSCs to inhibit T-cell proliferation [17,40,46]. BM-MSCs
and ASCs expressed IFN receptor at the same level (data not shown) and similarly
upregulated HLA-DR in response to IFN stimulation, indicating a functional IFN
signaling pathway. Of note IDO mRNA level was also reduced in primed BM-MSCs
compared to primed ASCs (data not shown) suggesting a regulation at the
transcriptional level. Recently, histone modifications at IDO1 promoter region were
shown to be induced upon inflammatory cytokine treatment of BM-MSCs, with a loss
of H3K9me3 repressive mark and a gain of permissive acH3K9 mark [47].
Methylation of the IDO1 promoter was also proposed as an additional level of
regulation of IDO expression in breast cancer cells [48]. A deeper evaluation of
epigenetic regulation of IDO1 in ASCs versus BM-MSCs should shed new light on
the regulation of this immunosuppressive mediator in the two cell subsets.
Importantly, we revealed for the first time, using purified nASCs and nBM-MSCs, that
the differential immune profile of in vitro expanded MSCs obtained from BM and
adipose tissue is essentially imprinted by their tissue of origin. Interestingly, murine
ASCs were proposed to be the precursors of lymphoid stromal cells that regulate
immune cell recruitment and guided trafficking inside secondary lymphoid organs and
ensure antigen delivery and B cell activation and selection [49]. We highlighted here
a lymphoid stroma signature, including LTBR, the NF-kB family members IRAK1,
IRAK3, and TRAF3IP2; IL4R, IL13RA2, CLU, and CSTC in cultured human ASCs
compared to BM-MSCs further confirming the relationship between in vitro expanded
ASCs and their native counterpart and suggested that these cells are prone to
interact with immune cells in vivo.
3 4 5 6 7 8 9 10 11 12 13 14 15 16 17 18 19 20 21 22 23 24 25 26 27 28 29 30 31 32 33 34 35 36 37 38 39 40 41 42 43 44 45 46 47 48 49 50 51 52 53 54 55 56 57 58 59 60
For Peer Review
18
C
ONCLUSIONBesides variations in culture procedures, immunological properties of ASCs and
BM-MSCs are strongly related to their tissue of origin and in vitro expanded BM-MSCs retain
the main features of their native counterpart. In particular, ASCs overexpress several
molecules associated with an increased capacity to modulate immune cells and have
a transcriptomic and phenotypic profile consistent with a lower immunogenicity. This
study paves the way for a better definition of potency assays based on a
simultaneous evaluation of molecular and cellular targets. In addition, it could also be
helpful to evaluate how MSC modifications or reprogramming could enhance their
clinical potency.
A
CKNOWLEDGEMENTSThis work was supported by grants from the CHU de Toulouse (Appel d'offre local
2008), the Etablissement Français du Sang (APR 2016), the Infrastructure program
EcellFRANCE (ANR-11-INSB-005), the European Center for Transplantation
Sciences and Immunotherapy (IHU CESTI, ANR-10-IBHU_0005), the French
National Cancer Institute (INCa PLBIO-17-219). LV is a recipient of a fellowship from
the Labex IGO and the Région Bretagne.
D
ISCLOSURE OFP
OTENTIALC
ONFLICTS OFI
NTERESTThe authors declare no competing financial interest.
D
ATAA
VAILABILITYS
TATEMENTData
are
available
via
the
NCBI
Gene
Expression
Omnibus
(
https://www.ncbi.nlm.nih.gov/geo/
; accession number GSE122778). During the
reviewing process the data are retained in private status and are available for
reviewers only using the secure token shazuskolhcbtyb.
R
EFERENCES1
Shi Y, Wang Y, Li Q, et al. Immunoregulatory mechanisms of mesenchymal
stem and stromal cells in inflammatory diseases. Nature Reviews Nephrology
2018;14:493–507.
2
Galipeau J, Sensebé L. Mesenchymal Stromal Cells: Clinical Challenges and
Therapeutic Opportunities. Cell Stem Cell 2018;22:824–833.
3
Galipeau J. The mesenchymal stromal cells dilemma--does a negative phase III
trial of random donor mesenchymal stromal cells in steroid-resistant
graft-ScholarOne Support: (434) 964-4100 3 4 5 6 7 8 9 10 11 12 13 14 15 16 17 18 19 20 21 22 23 24 25 26 27 28 29 30 31 32 33 34 35 36 37 38 39 40 41 42 43 44 45 46 47 48 49 50 51 52 53 54 55 56 57 58 59 60
For Peer Review
versus-host disease represent a death knell or a bump in the road? Cytotherapy
2013;15:2–8.
4
Sensebé L, Bourin P, Tarte K. Good manufacturing practices production of
mesenchymal stem/stromal cells. Human Gene Therapy 2011;22:19–26.
5
Mendicino M, Bailey AM, Wonnacott K, et al. MSC-based product
characterization for clinical trials: an FDA perspective. Cell Stem Cell
2014;14:141–145.
6
Moll G, Alm JJ, Davies LC, et al. Do cryopreserved mesenchymal stromal cells
display impaired immunomodulatory and therapeutic properties? Stem Cells
2014;32:2430–2442.
7
Loisel S, Dulong J, Ménard C, et al. Brief Report: Proteasomal Indoleamine
2,3-Dioxygenase Degradation Reduces the Immunosuppressive Potential of Clinical
Grade-Mesenchymal Stromal Cells Undergoing Replicative Senescence. Stem
Cells 2017;35:1431–1436.
8
Chinnadurai R, Copland IB, Garcia MA, et al. Cryopreserved Mesenchymal
Stromal Cells Are Susceptible to T-Cell Mediated Apoptosis Which Is Partly
Rescued by IFNγ Licensing. Stem Cells 2016;34:2429–2442.
9
Cho K-A, Park M, Kim Y-H, et al. RNA sequencing reveals a transcriptomic
portrait of human mesenchymal stem cells from bone marrow, adipose tissue,
and palatine tonsils. Sci Rep 2017;7:17114.
10 de Almeida DC, Ferreira MRP, Franzen J, et al. Epigenetic Classification of
Human Mesenchymal Stromal Cells. Stem Cell Reports 2016;6:168–175.
11 Jansen BJH, Gilissen C, Roelofs H, et al. Functional differences between
mesenchymal stem cell populations are reflected by their transcriptome. Stem
Cells and Development 2010;19:481–490.
12 Torensma R, Prins H-J, Schrama E, et al. The impact of cell source, culture
methodology, culture location, and individual donors on gene expression profiles
of bone marrow-derived and adipose-derived stromal cells. Stem Cells and
Development 2013;22:1086–1096.
13 Lee SJ, Yi T, Ahn SH, et al. Comparative study on metabolite level in
tissue-specific human mesenchymal stem cells by an ultra-performance liquid
chromatography quadrupole time of flight mass spectrometry. Analytica Chimica
Acta 2018;1024:112–122.
14 Reinisch A, Etchart N, Thomas D, et al. Epigenetic and in vivo comparison of
diverse MSC sources reveals an endochondral signature for human
hematopoietic niche formation. Blood 2015;125:249–260.
15 Mattar P, Bieback K. Comparing the Immunomodulatory Properties of Bone
Marrow, Adipose Tissue, and Birth-Associated Tissue Mesenchymal Stromal
Cells. Front Immunol 2015;6:560.
16 Ménard C, Tarte K. Immunoregulatory properties of clinical grade mesenchymal
stromal cells: evidence, uncertainties, and clinical application. Stem Cell
Research & Therapy 2013;4:64.
17 Ménard C, Pacelli L, Bassi G, et al. Clinical-grade mesenchymal stromal cells
produced under various good manufacturing practice processes differ in their
immunomodulatory properties: standardization of immune quality controls. Stem
Cells and Development 2013;22:1789–1801.
18 Melief SM, Zwaginga JJ, Fibbe WE, et al. Adipose tissue-derived multipotent
stromal cells have a higher immunomodulatory capacity than their bone
marrow-derived counterparts. Stem Cells Translational Medicine 2013;2:455–463.
3 4 5 6 7 8 9 10 11 12 13 14 15 16 17 18 19 20 21 22 23 24 25 26 27 28 29 30 31 32 33 34 35 36 37 38 39 40 41 42 43 44 45 46 47 48 49 50 51 52 53 54 55 56 57 58 59 60
For Peer Review
20
19 Ribeiro A, Laranjeira P, Mendes S, et al. Mesenchymal stem cells from umbilical
cord matrix, adipose tissue and bone marrow exhibit different capability to
suppress peripheral blood B, natural killer and T cells. Stem Cell Research &
Therapy 2013;4:125.
20 Valencia J, Blanco B, Yáñez R, et al. Comparative analysis of the
immunomodulatory capacities of human bone marrow- and adipose
tissue-derived mesenchymal stromal cells from the same donor. Cytotherapy
2016;18:1297–1311.
21 Bourin P, Peyrafitte J-A, Fleury-Cappellesso S. A first approach for the
production of human adipose tissue-derived stromal cells for therapeutic use.
Methods Mol Biol 2011;702:331–343.
22 Langfelder P, Horvath S. WGCNA: an R package for weighted correlation
network analysis. BMC Bioinformatics 2008;9:559.
23 Pandey S, Mourcin F, Marchand T, et al. IL-4/CXCL12 loop is a key regulator of
lymphoid stroma function in follicular lymphoma. Blood 2017:blood–2016–08–
737239.
24 Grégoire M, Guilloton F, Pangault C, et al. Neutrophils trigger a NF-κB
dependent polarization of tumor-supportive stromal cells in germinal center
B-cell lymphomas. Oncotarget 2015;6:16471–16487.
25 Tattevin P, Monnier D, Tribut O, et al. Enhanced indoleamine 2,3-dioxygenase
activity in patients with severe sepsis and septic shock. J Infect Dis
2010;201:956–966.
26 Qiu W, Hu Y, Andersen TE, et al. Tumor necrosis factor receptor superfamily
member 19 (TNFRSF19) regulates differentiation fate of human mesenchymal
(stromal) stem cells through canonical Wnt signaling and C/EBP. J Biol Chem
2010;285:14438–14449.
27 Nobis M, Herrmann D, Warren SC, et al. A RhoA-FRET Biosensor Mouse for
Intravital Imaging in Normal Tissue Homeostasis and Disease Contexts. Cell
Reports 2017;21:274–288.
28 Gao H, Volat F, Sandhow L, et al. CD36 Is a Marker of Human Adipocyte
Progenitors with Pronounced Adipogenic and Triglyceride Accumulation
Potential. Stem Cells 2017;35:1799–1814.
29 Armulik A, Genové G, Betsholtz C. Pericytes: developmental, physiological, and
pathological perspectives, problems, and promises. Developmental Cell
2011;21:193–215.
30 Astarita J, Lukacs-Kornek V, Tayalia P, et al. Transcriptional profiling of stroma
from inflamed and resting lymph nodes defines immunological hallmarks. Nat
Immunol 2012;13:499–510.
31 Li H, Ghazanfari R, Zacharaki D, et al. Isolation and characterization of primary
bone marrow mesenchymal stromal cells. Annals of the New York Academy of
Sciences 2016;1370:109–118.
32 Maumus M, Peyrafitte J-A, D'Angelo R, et al. Native human adipose stromal
cells: localization, morphology and phenotype. International Journal of Obesity
2011;35:1141–1153.
33 Navarro R, Compte M, Álvarez-Vallina L, et al. Immune Regulation by Pericytes:
Modulating Innate and Adaptive Immunity. Front Immunol 2016;7:480.
34 Ankrum JA, Ong JF, Karp JM. Mesenchymal stem cells: immune evasive, not
immune privileged. Nature Biotechnology 2014;32:252–260.
35 Li Y, Lin F. Mesenchymal stem cells are injured by complement after their
contact with serum. Blood 2012;120:3436–3443.
ScholarOne Support: (434) 964-4100 3 4 5 6 7 8 9 10 11 12 13 14 15 16 17 18 19 20 21 22 23 24 25 26 27 28 29 30 31 32 33 34 35 36 37 38 39 40 41 42 43 44 45 46 47 48 49 50 51 52 53 54 55 56 57 58 59 60
For Peer Review
36 Bahr von L, Sundberg B, Lönnies L, et al. Long-term complications, immunologic
effects, and role of passage for outcome in mesenchymal stromal cell therapy.
Biology of Blood and Marrow Transplantation : Journal of the American Society
for Blood and Marrow Transplantation 2012;18:557–564.
37 Espagnolle N, Balguerie A, Arnaud E, et al. CD54-Mediated Interaction with
Pro-inflammatory Macrophages Increases the Immunosuppressive Function of
Human Mesenchymal Stromal Cells. Stem Cell Reports 2017;8:961–976.
38 Wang G, Cao K, Liu K, et al. Kynurenic acid, an IDO metabolite, controls
TSG-6-mediated immunosuppression of human mesenchymal stem cells. Cell Death
and Differentiation 2018;25:1209–1223.
39 Choi H, Lee RH, Bazhanov N, et al. Anti-inflammatory protein TSG-6 secreted
by activated MSCs attenuates zymosan-induced mouse peritonitis by decreasing
TLR2/NF-κB signaling in resident macrophages. Blood 2011;118:330–338.
40 François M, Romieu-Mourez R, Li M, et al. Human MSC suppression correlates
with cytokine induction of indoleamine 2,3-dioxygenase and bystander M2
macrophage differentiation. Molecular Therapy : the Journal of the American
Society of Gene Therapy 2012;20:187–195.
41 Dyer DP, Thomson JM, Hermant A, et al. TSG-6 inhibits neutrophil migration via
direct interaction with the chemokine CXCL8. J Immunol 2014;192:2177–2185.
42 Luque A, Serrano I, Aran JM. Complement components as promoters of
immunological tolerance in dendritic cells. Semin Cell Dev Biol 2017.
43 Hsieh C-C, Chou H-S, Yang H-R, et al. The role of complement component 3
(C3) in differentiation of myeloid-derived suppressor cells. Blood
2013;121:1760–1768.
44 Davies LC, Heldring N, Kadri N, et al. Mesenchymal Stromal Cell Secretion of
Programmed Death-1 Ligands Regulates T Cell Mediated Immunosuppression.
Stem Cells 2017;35:766–776.
45 Chen X, Liu Q, Huang W, et al. Stanniocalcin-2 contributes to mesenchymal
stromal cells attenuating murine contact hypersensitivity mainly via reducing
CD8+ Tc1 cells. Cell Death & Disease 2018;9:548.
46 Chinnadurai R, Rajan D, Qayed M, et al. Potency Analysis of Mesenchymal
Stromal Cells Using a Combinatorial Assay Matrix Approach. Cell Reports
2018;22:2504–2517.
47 Rovira Gonzalez YI, Lynch PJ, Thompson EE, et al. In vitro cytokine licensing
induces persistent permissive chromatin at the Indoleamine 2,3-dioxygenase
promoter. Cytotherapy 2016;18:1114–1128.
48 Dewi DL, Mohapatra SR, Blanco Cabañes S, et al. Suppression of
indoleamine-2,3-dioxygenase 1 expression by promoter hypermethylation in ER-positive
breast cancer. Oncoimmunology 2017;6:e1274477.
49 Bénézech C, Mader E, Desanti G, et al. Lymphotoxin-β Receptor Signaling
through NF-κB2-RelB Pathway Reprograms Adipocyte Precursors as
Lymph Node Stromal Cells. Immunity 2012:1–14.
3 4 5 6 7 8 9 10 11 12 13 14 15 16 17 18 19 20 21 22 23 24 25 26 27 28 29 30 31 32 33 34 35 36 37 38 39 40 41 42 43 44 45 46 47 48 49 50 51 52 53 54 55 56 57 58 59 60
For Peer Review
22
F
IGUREL
EGENDSFigure 1. Paired ASC and BM-MSC transcriptomic analysis reveal
tissue-specific signatures.
(A) Principal component analysis of data resulting from the gene expression profile
analysis of 14 paired BM-MSC and ASC samples obtained from the same donors.
(B) Hierarchical clustering of correlation matrix of paired ASC and BM-MSC gene
expression profile using the Pearson’s correlation coefficients.
(C) Euclidian distance between each BM-MSC and its paired ASC versus the mean
distance between a given BM-MSC and the geometric mean of the other BM-MSCs.
(D-G) WGCNA analysis. Gene clustering dendrogram and module delimitation based
on topological overlap, with different colors representing different co-expression gene
modules (D). The relationship between the module eigengenes and the traits (ASC
versus BM-MSC) was then evaluated based on Wilcoxon rank test and was
represented as a heatmap color-coded accordingly to the -LOG10(FDR) (E). The
genes upregulated in ASCs versus BM-MSCs in the module Blue (F) and Yellow (G)
were analyzed using Ingenuity Pathway Analysis. Shown are the top twenty
pathways in ASCs (dark blue and dark orange) and BM-MSCs (light blue and light
orange) according to the p-value.
Figure 2. Paired ASC and BM-MSC differential gene expression pattern
highlights tissue-specific functional pathways.
(A) Venn diagram of the genes differentially expressed between paired BM-MSC and
ASC (n=14).
(B) Hierarchical clustering of paired ASCs and BM-MSCs performed on the 3291
differentially expressed genes. The relative level of gene expression is depicted
according to the shown color scale.
(C) Ingenuity Pathway Analysis of the up- and down-regulated genes. Shown are the
top twenty pathways in ASCs (top, red bars) and BM-MSCs (bottom, blue bars)
according to the p-value.
ScholarOne Support: (434) 964-4100 3 4 5 6 7 8 9 10 11 12 13 14 15 16 17 18 19 20 21 22 23 24 25 26 27 28 29 30 31 32 33 34 35 36 37 38 39 40 41 42 43 44 45 46 47 48 49 50 51 52 53 54 55 56 57 58 59 60