HAL Id: hal-00328571
https://hal.archives-ouvertes.fr/hal-00328571
Submitted on 10 Oct 2008
HAL is a multi-disciplinary open access
archive for the deposit and dissemination of
sci-entific research documents, whether they are
pub-lished or not. The documents may come from
teaching and research institutions in France or
abroad, or from public or private research centers.
L’archive ouverte pluridisciplinaire HAL, est
destinée au dépôt et à la diffusion de documents
scientifiques de niveau recherche, publiés ou non,
émanant des établissements d’enseignement et de
recherche français ou étrangers, des laboratoires
publics ou privés.
core and its climatic implications
J. Ming, H. Cachier, C. Xiao, D. Qin, S. Kang, S. Hou, J. Xu
To cite this version:
J. Ming, H. Cachier, C. Xiao, D. Qin, S. Kang, et al.. Black carbon record based on a shallow
Himalayan ice core and its climatic implications. Atmospheric Chemistry and Physics, European
Geosciences Union, 2008, 8 (5), pp.1352. �10.5194/acp-8-1343-2008�. �hal-00328571�
Atmos. Chem. Phys., 8, 1343–1352, 2008 www.atmos-chem-phys.net/8/1343/2008/ © Author(s) 2008. This work is distributed under the Creative Commons Attribution 3.0 License.
Atmospheric
Chemistry
and Physics
Black carbon record based on a shallow Himalayan ice core and its
climatic implications
J. Ming1,2, H. Cachier3, C. Xiao1,2, D. Qin2, S. Kang4,2, S. Hou2, and J. Xu2
1Institute of Climate System, Chinese Academy of Meteorological Sciences, Beijing 100081, China
2State Key Laboratory of Cryospheric Sciences, Cold and Arid Regions Environmental and Engineering Research Institute,
Chinese Academy of Sciences, Lanzhou 730000, China
3Laboratoire des Sciences du climat et de l’Environnement, CEA-CNRS-University Versailles St Quentin, Gif-sur-Yvette
91198, France
4Institute of Tibetan Plateau Research, Chinese Academy of Sciences, Beijing 100085, China
Received: 30 August 2007 – Published in Atmos. Chem. Phys. Discuss.: 10 October 2007 Revised: 24 January 2008 – Accepted: 7 February 2008 – Published: 6 March 2008
Abstract. A continuous measurement for black carbon (hereafter “BC”) in a 40 m shallow ice core retrieved from the East Rongbuk Glacier (hereafter “ERG”) in the northeast saddle of Mt. Qomolangma (Everest) provided the first his-torical record of BC deposition during the past ∼50 yrs in the high Himalyas. Apparent increasing trend (smooth aver-age) of BC concentrations was revealed since the mid-1990s. Seasonal variability of BC concentrations in the ice core in-dicated higher concentrations in monsoon seasons than those in non-monsoon seasons. Backward air trajectory analy-sis by the HYSPLIT model indicated that South Asia’s BC emissions had significant impacts on the BC deposition in the Mt. Qomolangma (Everest) region. The estimated aver-age atmospheric BC concentration in the region was about 80 ng m−3 during 1951–2001. And it was suggested BC emitted from South Asia could penetrate into the Tibetan Plateau by climbing over the elevated Himalayas. A signifi-cant increasing trend of the radiative forcing simulated by the SNICAR model appeared since 1990, which even exceeded 4.5 W m−2in the summer of 2001. It was suggested that this
amplitudes of BC concentrations in the atmosphere over the Himalayas and consequently in the ice in the glaciers could not be neglected when assessing the dual warming effects on glacier melting in the Himalayas.
Correspondence to: J. Ming ([email protected])
1 Introduction
BC plays an important role in the earth climate system. BC particles suspended in the atmosphere could result in very complex radiative effects by acting as the light absorber and veil (e.g. Jacobson, 2004a). Although there were many un-certainties on this issue, negative impact of short term cool-ing but long term warmcool-ing the atmosphere dominated the popular views (e.g. Jacobson, 2004b). A recent highlight on BC climate effect was that BC deposited in snow and ice surface could absorb the sunlight largely and consequently reduce the albedo intensely so as to accelerate the melting of snow cover and sea ice (e.g. Hansen and Nazarenko, 2004; Jacobson, 2004a).
Alpine glaciers and polar ice sheets are excellent archives for documenting dry and wet depositing constituents in the atmosphere. BC measurements in snow and ice had been conducted by some previous studies since the 1980s (e.g. Ch´ylek et al., 1987, 1995; Cachier and Pertuisot, 1994), and a new technique for measuring BC in a Greenland ice core with better resolution than previous methods was recently re-ported, describing a significant enhanced climate forcing on Arctic ice caused by the 20th-century industrial BC emis-sions (McConnell et al., 2007). These papers focused on the issue on the Arctic haze and therefore its consequent cli-matic and environmental significances. However, historical records for BC deposition recovered from ice cores in mid-low latitudes were very few till now, and there were two re-ports on the carbonaceous particle concentrations in ice cores both drilled from the glaciers located in Mt. Alps. One re-ported BC concentration increased by a factor of 3.7 from
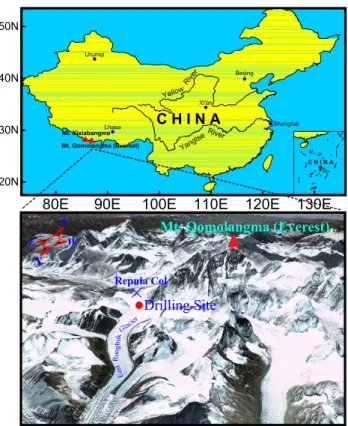
Mt. Qomolangma (Everest) Repula Col S
×
Drilling Site N W E E as t Rongbuk Glac ier80E 90E 100E 110E 120E 130E
20N 30N 40N 50N Beijing Lhasa Shanghai Urumqi Xi'an Mt. Qomolangma (Everest) Mt. Xixiabangma Yang tse Yellow C H I N A River Riv er C H I N A
Fig. 1. Location map of ERIC2002C drilling site.
22 µg kg−1 during 1755–1890 to 82 µg kg−1 during 1950– 1975 (Lavanchy et al., 1999), and the other showed BC con-centration increased from 15 µg kg−1during 1650–1870 to 27 µg kg−1during 1870–1940 (Jenk et al., 2006).
The Himalayas is located on the south margin of the Ti-betan Plateau (hereafter “TP”) and stretches 2500 km from west to east, spanning the middle and upper layers of the troposphere. And it may be an effective barrier to restrict the exchange of air masses between the TP and the Indian subcontinent carried by monsoons in summers and by west-erly in winters (Nieuwolt, 1977). The ERG is located in the northeast saddle of Mt. Qomolangma (Everest) in the cen-tral Himalayas. Previous studies on the ice core records recovered here had revealed plenty of credible information on climate change and environment (e.g. Qin et al., 2002; Kang et al., 2002). South Asia has been a fast-developing region with large BC emissions in recent years, for example, in the 1990s the BC emission in South Asia was 563.9 Gg, accounting for 12.3% of total BC emission throughout the world (Bond et al., 2007), and South Asia is also known as a home to the Asian Brown Cloud (hereafter “ABC”) (e.g. Ramanathan et al., 2001a, 2007). And ABC, which covers most of the Arabian Sea, the Bay of Bengal, and South Asia, occurs every year and extends from November through May. The brownish haze is composed of a 3-km-thick mixture of anthropogenic sulfates, nitrates, organics, black carbon, dust and fly ash particles, and natural aerosols such as sea salt and
mineral dust (Ramanathan and Ramana, 2003). In-situ mea-surements of aerosol chemistry from aircrafts, ships, and sur-face stations found that anthropogenic sources (e.g. biomass burning, fossil-fuel combustion) contributed as much as 75% to the observed aerosol concentration (e.g. Ramanathan et al., 2001b; Lelieveld et al., 2001). As the hinterland abutted by Central/East/South Asia, the atmospheric environment over the TP might be under the impacts of the polluted air masses derived from these regions. BC deposition information could be archived frozen in the ERG. And yet no data on BC de-position in the glaciers was obtained from this site till now. In this work, we tried to recover a BC depositing history via a shallow ice core (hereafter “ERIC2002C”) drilled from the ERG in 2002.
2 Experimental methods
2.1 Ice coring
ERIC2002C was retrieved in a dry hole in the summer of 2002. The drilling site was located in the Repula Col (28◦01′12◦N, 86◦57′36◦E, and 6500 m a.s.l.) of the ERG near Mt. Qomolangma (Fig. 1). A repeating survey with a Sokkia GSS1A Global Positioning System (accuracies of
±5 mm over distance up to 10 km) in 1998 and 2002 did not identify horizontal movement at the drilling site (Hou et al., 2007). At the saddle of the ERG, the present average an-nual net accumulation was about 500 mm water equivalent as determined from snow pits and a stake accumulation net-work established during a reconnaissance in May of 1998. Prior to drilling, a 1.5-m deep snow pit was dug to remove the snow/firn above the borehole. The ice core was 40.8 m in length and 9.4 cm in diameter and was sealed in polyethy-lene bags in sections of 50 to 115.5 cm. At the same time, the other two ice cores with the lengths of 108.83 m and 95.80 m (named “ERIC2002A” and “ERIC2002B”, respec-tively) were extracted together at very near sites. The bore-hole temperature of ERIC2002A ranged from a minimum of
−9.6◦C at 20 m to a maximum of −8.9◦C at the bottom. The
low temperature throughout the borehole indicated that the information of atmospheric depositions here could be pre-served. We maintained the ice core in frozen condition dur-ing the transportation and storage time.
The deepest section of ERIC2002C was used to analyze culturable bacteria (Zhang et al., 2007). Each section of the left was split into two halves axially. One half was an-alyzed for δ18O isotope and soluble major ions (Na+, K+, Mg2+, Ca2+, Cl−, NO−3, and SO2−4 ). The measurements for
δ18O and ions were performed at the State Key Laboratory of Cryospheric Sciences (SKLCS) following the methods of previous studies (e.g. Tian et al., 2003; Xiao et al., 2004). And in this work the left half was used to analyze BC.
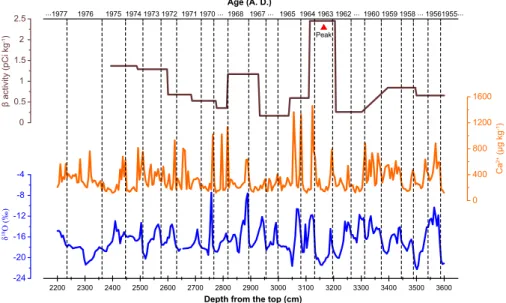
J. Ming et al.: BC record based on a Himalayan ice core 1345 2200 2300 2400 2500 2600 2700 2800 2900 3000 3100 3200 3300 3400 3500 3600 -24 -20 -16 -12 -8 -4 0 0.5 1 1.5 2 2.5 0 400 800 1200 1600 Peak ...1977 1976 1975 1974 1973 1972 1971 1970 ... 1968 1967 ... 1965 1964 1963 1962 ... 1960 1959 1958 ... 19561955... C a 2+ (μ g kg -1) Age (A. D.)
Depth from the top (cm)
δ 18O (‰) β ac tiv ity (p C i k g -1)
Fig. 2. The dating of ERIC2002C (episode), where β activity peak showed in 1963, and calcium and δ18O showed seasonal variability (it
could be observed that less negative δ18O values in non-monsoon seasons and more negative δ18O values in monsoon seasons).
2.2 Ice core dating
Amount effect in the precipitations near Mt. Qomolangma caused less negative δ18O values in non-monsoon seasons and more negative δ18O values in monsoon seasons as recorded in the ice cores of the ERG (Qin et al., 2002; Kang et al., 2002). Calcium was suggested to be the most defini-tive ion for precise dating due to its striking high concen-trations and low concenconcen-trations displayed in non-monsoon and monsoon seasons, respectively, based on snow chemistry data from both fresh snow and snow pit samples (Kang et al., 2004). Therefore we dated ERIC2002C by counting the sea-sonal variability of δ18O and Ca2+profiles, simultaneously considering the annual net water accumulation. The result was further verified by the β activity horizon produced by the atmospheric thermonuclear test in 1963 (Fig. 2). Sub-tracting one year of the snow pit covering ERIC2002C, the ice core was dated to be 50 yrs old (1951–2001 AD). We es-timated a dating error of ±1 year throughout the whole ice core.
2.3 Sample preparation
Although BC measurement in ice required rather large amounts of sample, sufficient sample guaranteed we could perform a continuous measurement for BC concentrations in ERIC2002C. Four testing samples sectioned randomly from ERIC2002C were measured for BC aforehand to consider what was the proper volume needed for each sample. The BC masses of these testing samples gave us a clue that 70 to 500 g per sample was the best weight for carbon analysis, giving 5 to 10 µg BC on the filter deposit. ERIC2002C were
divided into sections with expected weights, and 143 samples were obtained aggregately.
All the samples were prepared in the laminar flow cabi-net of the inner clean room of 100-class (numbers of par-ticles larger than 0.5 µm in 1 ft3 air are less than 100) in a low-temperature room (−20◦C). A series of scraping
oper-ations were performed on the samples. A pre-cleaned lathe was used to peel the skin of 1–2 cm thickness of each sam-ple. And the next outer layer of approximate 1 cm thickness of each sample was removed by scraping manually with a pre-cleaned stainless steel blade. Then the ice samples were stored in pre-cleaned glass jars with covers and kept at low temperature until filtration.
Filtering was operated in the warm clean room of 100-class. Warm water bath was used to shorten the time of melt-ing. Once there was some melted water of around 1-cm depth in the container, the samples were allowed to melt at the room temperature and manually stirring the container could fur-ther favor the process. This process was limited within 4 h to avoid developing extra bacteria. Immediately after melt-ing and prior to filtration, the bottles with melted samples were submitted to ultra sounding for 15 min in order to avoid loss of particles which might have attached to the walls of the containers. The samples were weighed with a cylinder (±1 mL) and then filtered through circular quartz fiber filters with a pore size of 1 µm (Whatman® QMA). The filters were 25 mm in diameter and were preheated for 24 h in an oven at 600◦C. Filtration was performed using a glass unit and re-sulted in a circular spot of 12 mm in diameter. A hand vac-uum pump was used to accelerate filtering the melted sam-ples. After filtration, hydrochloric acid (2–4%) was put on the filter and passed through. Acidification step duration of
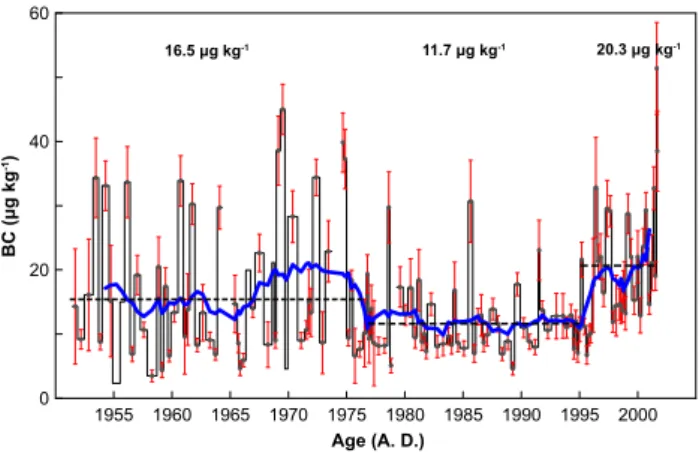
Fig. 3. The time series of BC concentrations for the samples sec-tioned from ERIC2002C (each step represented one sample), where the error bars were presented as the solid red lines with middle grey dots, and the thick solid blue curve was the smooth average. And three average BC concentration levels during 1951–1975, 1975– 1994, and 1995–2002 were showed as the dashed lines with values above in the plot.
15 min at least was necessary to remove carbonates which might if any, overestimate BC contents. The containers were rinsed four times with ultra pure water (Milli-Q, 18.2 M) to ensure complete transfer of the carbonaceous particles to the filter. Following above filtering procedure, the attachment of particles on the glassware walls was found to be less than 5% and the fiber filter efficiency for the capture of particles was better than 97% (Cachier and Pertuisot, 1994). Finally, the filters would be moved into clean Petri-slides (Millipore®) and set in clean cabinet to let them dry. In addition, 12 blank filters were made at the filtration intervals at times by pass-ing through HCl solution for 15 min at least and the rinspass-ing solution after washing the blank bottles with ultra pure water.
2.4 BC measurement
Filters were analyzed at the Laboratoire des Sciences du Cli-mat et l’Environnement (LSCE). Pre-combustion was nec-essary to eliminate the organic carbon (hereafter “OC”) and minimize any “cross-over” effect between OC and BC. BC and OC separation was obtained following the analytical pro-tocol set up for aerosols (Cachier et al., 1989) and adapted for snow and ice samples (Cachier and Pertuisot, 1994). Sample-loaded filters were punched with a pre-cleaned unit (14 mm of the diameter) to remove the outer loop. Before moving the filters into the analyzers, they were put in an oven for around 20 min at 70◦C to eliminate the water vapor and volatile or-ganic compounds likely adhered to them when they were between pre-combustion and analysis. According to the vi-sual grey level of filters’ color, they were divided into two batches, which were the heavily loaded filters and the lightly loaded ones, respectively. The first batch including 55 sam-ples was submitted to a coulometric titration-based
analy-sis (using the Str¨ohlein Coulomat 702C® with the detection limit of 3 µg Carbon and the precision of 0.02 µg Carbon), the second batch including 88 samples was submitted to a thermo-optical analysis (using the thermo-optical transmis-sion carbon analyzer System by Sunset Lab®, with the de-tection limit of 2 µg Carbon per cm2), and 12 blank filters were submitted to the Str¨ohlein Coulomat 702C® in a lump for measuring their BC mass. And the range of BC mass for the filters submitted to the Str¨ohlein Coulomat 702C® was 1.80–21.69 µg with an average of 9.03±4.74 µg (the filters with BC loading heavier than 3 µg accounting for 94% of the first batch of samples), and for the filters sub-mitted to the Sunset® was 1.51–9.50 µg with an average of 3.63±1.36 µg. The area-average BC mass density of the 12 blank filters was 0.076 µg Carbon per cm2, yielding an aver-age blank BC loading for each sample was 0.12 µg Carbon, which would be subtracted from the samples.
3 Results and discussion
3.1 General varying trend and seasonal variation of BC concentrations
Bond et al. (2007) reported a historical record of BC emis-sions from different regions in the world, which indicated an increasing trend of BC emission in South and Cen-tral Asias as the adjacent regions to the Himalayas during the past 150 yrs. And the ERG preserved the concentra-tion variaconcentra-tions of BC deposit in ERIC2002C as showed in Fig. 3. BC record during the last 50 yrs could be divided into three stages based on the different concentration levels, which were 1951–1976, 1976–1994, and 1995–2002, respec-tively. During 1951–1976, BC concentrations had the mean of 16.5±10.8 µg kg−1and showed large fluctuations, espe-cially for the later part (1966–1976) when significant high concentrations appeared in the smooth curve. During 1977– 1994, BC concentrations had the mean of 11.7±5.4 µg kg−1 were quite low and stable. However, during 1995–2002 when the highest BC concentration level (20.3±9.2 µg kg−1)was displayed, there was a significant increasing trend for BC concentrations, which exceeded 50 µg kg−1 in the summer
of 2001.
Although the time resolution of the BC record through-out ERIC2002C was not high enough for investigating the seasonal cycles of BC concentrations, distinguished seasonal variation of BC concentrations between monsoon and non-monsoon seasons could be observed in the top sections of the ice core, which covered 2000–2001 with relatively higher resolution for BC. In Mt. Qomolangma region, the annual pe-riod from June to October was thought as the Indian summer monsoon dominating time for the synoptic situation (Shen, 1975). BC concentrations in the monsoon seasons were sig-nificantly higher than those in the non-monsoon seasons, as showed in Fig. 4.
J. Ming et al.: BC record based on a Himalayan ice core 1347
Fig. 4. A portion of BC concentrations covering 2000–2001 with relatively higher time resolution in ERIC2002C, where seasonal variability showed BC concentrations in monsoon seasons were higher than those in non-monsoon seasons.
3.2 Estimated atmospheric BC concentrations over the ERG
BC concentrations in ERIC2002C might provide us an ap-proach to estimate the atmospheric BC concentration level over the ERG during the past 50 yrs. At lower elevations, ap-portioning between dry and wet depositions for BC aerosol must be considered when doing the estimation. Some mod-elling studies simulated the mean ratio of wet/total removal of BC from the atmosphere and suggested wet deposition was the dominate sink for BC. For example, the AeroCom (Aerosol Comparisons between Observations and Models) project derived a mean of 79% for wet/total removal ratio from running 14 global aerosol models (Textor et al., 2006), and Croft et al. (2005) run the CCCma AGCM (the 4th gen-eration Canadian Centre for Climate modelling and analy-sis Atmospheric General Circulation Model) and obtained a very close value of 75% to the former. However, over the ERG with such an extremely high elevation and a big annual net accumulation with the average of 500 mm water equiv-alent, wet deposition might dominate BC aerosol removal from the atmosphere, and we presumed that nearly all of the BC in ERIC2002C was wet-deposited and did the estima-tion for atmospheric BC concentraestima-tions from the ice via wet scavenging ratio method.
We used a transformed equation
Ca=ρa×Cs/ω(#)
based on the work by Davidson et al. (1993) to estimate BC concentrations in the atmosphere, where Cawas species
concentration (ng m−3)in the atmosphere, ρa was air
den-sity (g m−3)after correcting for the standard temperature and pressure (0◦C and 1013 hPa), Cs was species concentration
(ng g−1)in snow, and ω was the scavenging ratio for a spe-cific species by snow falls.
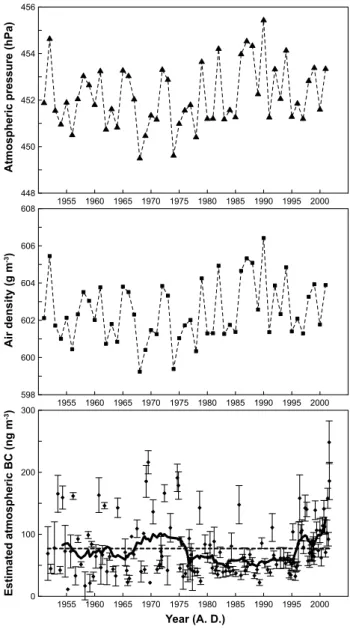
1955 1960 1965 1970 1975 1980 1985 1990 1995 2000 0 100 200 300 1955 1960 1965 1970 1975 1980 1985 1990 1995 2000 598 600 602 604 606 608 1955 1960 1965 1970 1975 1980 1985 1990 1995 2000 448 450 452 454 456 A tm o s p h e ri c p re s s u re (h Pa ) Es ti m a te d a tm o s p h e ri c B C (n g m -3) A ir d e n s ity (g m -3) Year (A. D.)
Fig. 5. The variability of estimated yearly mean air pressures (the top plot) and air densities (the middle plot) over the ERG during 1951–2001, and the time series of estimated atmospheric BC con-centrations (with error bars) over the ERG during the past 50 yrs (the bottom plot), where the thick solid thick curve represented the smooth average, and the dashed line represented the mean level of
atmospheric BC concentrations (∼80 ng m−3).
The value of ω was estimated by several previous studies, for example, at 160 by Clarke and Noone (1985), at 97±34 by Noone and Clarke (1988) for Arctic, and at 150 by Warren and Clarke (1990) for the East Antarctic Plateau. Jacobson (2004a) used a three-dimension global model to estimate ω at
∼125 as a worldwide mean. The numerical value of 125 was adopted for our estimation, for the measured ω was unavail-able at this site. We obtained a time series of yearly mean atmospheric pressure at the drilling site from 1951 to 2001 after interpolating 6500 m a.s.l. between the geopotential
30 40 50 60 70 80 90 10 20 30 40 50 2000 2500 3000 3500 4000 4500 5000 5500 3666 m Ending Point (28.02 N, 86.96 E, 7000 m)
Above model ground level (m)
Month
Monthly number of mean traje
ct
ories
Drilling Site of ERIC2002C
Drilling Site of ERIC2002C
Cluster means - 2001 (5-day backward trajectories)
Fig. 6. A typical result of two mean trajectories ending at the drilling site in 2001 simulated by the HYSPLIT 4.8 model. 5-day backward air trajectories each year were simulated with a daily resolution. For each year during 1951–2001, they were clustered using the integrated tool assembled in the model. Generally, two mean trajectories could be derived, in which one was for the long-distance transport (T 1), the other was for non-long-distance transport (T 2), and the altitude (3666 m) represented meters above model ground level. The latter trajectory suggested the air masses transported from South Asia in monsoon seasons, suggested by the seasonal cycle of the numbers of T 1 and T 2 distributed in 12 months of 2001.
heights of 400 and 500 hPa based on NCEP/NCAR reanal-ysis data, and then we estimated a time series of yearly mean air density at the drilling site from 1951 to 2001, and there-fore we used the equation (#) to estimate the atmospheric BC concentrations over the ERG during the past 50 yrs (Fig. 5). And the similar varying trend of the atmospheric BC concen-trations with the mean concentration level of 77±45 ng m−3
over the ERG in the past 50 yrs could be surveyed with the ice BC concentrations.
3.3 The relationship between atmospheric BC over the ERG and its transport pathways
Previous studies on snow/ice chemistry suggested the atmo-spheric environment over the high elevated glaciers in the Himalayas was little affected by boundary layer and reflected the deposition of particles of non-vicinity sources (e.g. Wake et al., 1994; Kang et al., 2002). An aerosol study conducted on the ERG in 2003 suggested sulfate, as an indicator of
anthropogenic activities originated from South Asia, con-tributed significant amount to the atmospheric environment over the ERG during the Indian summer monsoon season (Ming et al., 2007). So we precluded significant local BC sources, for the ERG near Mt. Qomolangma was a very re-mote site.
Air masses over the TP were mainly dominated by po-lar air masses from the Arctic, continental air masses from central Asia, and maritime air masses from the Pacific and Indian Ocean (Bryson, 1986). And with the alternation of seasons, the dominant air masses varied. During monsoon seasons, the Indian summer monsoons dominated the syn-optic regime over the ERG, while the westerlies took their power during non-monsoon seasons (Ye and Yang, 1979). The transport patterns of the air masses were largely dif-ferent as indicated by the difdif-ferent dominating synoptic sit-uations over the ERG in different seasons. For example, the air masses over the ERG were transported dominantly by Indian summer monsoons and next by westerlies during
J. Ming et al.: BC record based on a Himalayan ice core 1349 monsoon seasons, and yet they were completely transported
by westerlies during non-monsoon seasons. We used the HY-brid Single-Particle Lagrangian Integrated Trajectory (HYS-PLIT) model described by Draxler and Hess (1998), to inves-tigate the transport pathways of aerosol particles deposited at the drilling site of ERIC2002C during the past 50 yrs. The Climate Diagnostics Center NCEP/NCAR I (CDC-I) Me-teorological Data (reproduced by the Air Resources Labo-ratory, NOAA) provided the global reanalysis grid data of 2.5◦×2.5◦from 1948 to date. This dataset allowed us to sim-ulate the daily backward trajectories ending at the drilling site during 1951–2002 (normally including 365 trajectories each year), when covered the whole depositing period of ERIC2002C. The clustering tool integrated in the model was applied to form clusters of trajectories based on the percent change in total space variance (TSV) and calculate the mean backward trajectories of all the clusters each year. Generally, 2 clusters (in a few years were 3 or more) each year could be derived directly from the HYSPLIT model, and one was the transport by the westerly, and the other was the transport by the Indian summer monsoon. Taking the case in 2001 for example, T 1 represented the transport of relatively longer distance and higher elevation by the westerly dominantly dis-tributed in the non-monsoon season of 2001, while T 2 rep-resented the transport of shorter distance and lower elevation by the Indian summer monsoon dominantly distributed in the monsoon season of 2001 (Fig. 6). We counted the number of the trajectories contained in the non-long-distance back-ward trajectory (T 2) each year, and obtained a time series of the numbers of the trajectories in T 2 from 1951–2001. Co-variability was found between these numbers and esti-mated atmospheric BC concentrations over the ERG, and the correlation coefficient between them was 0.435 (N =51,
α=0.01) (Fig. 7), suggesting BC transported from South Asia via the Indian summer monsoon dominated the varying trend of its concentrations recorded in ERIC2002C, which could also be illustrated by the seasonal cycle of BC concentra-tions recorded in the 2000–2001 part of ERIC2002C with a relatively higher time resolution.
3.4 The enhanced radiative forcing caused by BC during recent decades and its climatic implications
BC particles could form forcing on climate by acting as the absorber of solar radiation, warming ambient atmosphere when suspending in the atmosphere, and darkening snow/ice surface and accelerating their melting when deposited in snow/ice. In old melting snow, 20 µg kg−1of BC could
re-duce albedo by 0.02 and 50 µg kg−1of BC by 0.04 (Warren and Wiscombe, 1985). A result revealed by a numeric simu-lation suggested atmospheric BC of 40–100 ng m−3over the Arctic could accelerate the melting of ice significantly (Koch and Hansen, 2005). The estimated average atmospheric BC concentration over the ERG was nearly 80 ng m−3during the past 50 yrs. Contrastively the atmospheric BC over the ERG
40 80 120 160 200 40 80 120 160 200 Y = 0.431 * X + 36.324 N = 51 R2 = 0.189457 40 80 120 160 200 0 50 100 150 200 250 1955 1960 1965 1970 1975 1980 1985 1990 1995 2000 Year (A. D.) Es ti m a te d a tm o s p h e ri c B C (n g m -3) Es ti m a te d a tm o s p h e ri c B C (n g m -3) Number of T_2 trajectories N u m b e r o f T _ 2 tr a je c to ri e s
Fig. 7. The co-variability of the estimated atmospheric BC concen-trations and the yearly numbers of trajectories contained in T 2 cov-ering the period of 1951–2001 based on the results output from the HYSPLIT model (the top plot). Good positive correlation between them (the bottom plot) indicated the BC emissions from South Asia had significant impacts on the BC deposition in the ERG.
could not be neglected to consider the consequent climate effect after taking its enhancing the solar absorption for the atmosphere and snow/ice surface in the glacier into account. A simulation estimated that South Asia’s atmosphere had been warmed by 0.25◦C per decade since 1950 due to BC
in the haze on the south slope of the Himalayas at the al-titudes ranging from 2000 to 5000 m a.s.l. – precisely the height where thousands of Himalayan glaciers are located, and this amplitude of warming might be sufficient to account for the observed retreats of the Himalayan glaciers (Ra-manathan et al., 2007). Present-day radiative forcing from BC in snow was simulated by the Snow, Ice, and Aerosol Radiative (SNICAR) model based on BC emission inventory data (Bond et al., 2004; Van der Werf et al., 2006), suggest-ing the greatest instantaneous forcsuggest-ing appeared over the TP with the average of 1.5 W m−2, even exceeding 20 W m−2 in some places during spring (Flanner et al., 2007). We in-put the BC concentrations in ERIC2002C as a parameter into the SNICAR model to simulate the 50-year radiative forcing caused by BC in the surface of the ERG during 1951–2001. The radiative forcing (smooth average) fluctuated at 1 W m−2 during 1951–1965, approached 2 W m−2 around 1971, and then kept low and stable at 1 W m−2during 1975–1990. And a significant increasing trend of the radiative forcing (smooth average) could be seen since 1990, which even exceeded 4.5 W m−2in the summer of 2001 (Fig. 8). Since the 1960s, the average retreat rates of the glaciers on the north slope of
1950 1955 1960 1965 1970 1975 1980 1985 1990 1995 2000 2005 0 1 2 3 4 5
5-year smoothed average
R a d ia ti ve f o rci n g (W m -2) Year (A. D.)
Fig. 8. Radiative forcing caused by BC depositions in the ERG simulated by the SNICAR model.
Mt. Qomolangma and of those on Mt. Xixiabangma (Fig. 1) were 5.5–9.5 m a−1 and 4.0–5.2 m a−1, respectively (Ren et al., 2006). And the Dasuopu ice core records from Mt. Xixi-abangma suggested a weakening of the Indian summer mon-soon since the 1920s should be responsible for the declin-ing net accumulatdeclin-ing rate of the Dasuopu glacier (Duan et al., 2004). We suggested BC particles in the atmosphere and the surface snow of Himalayan glaciers might be another po-tential factor to reduce the net accumulation, as well as the weakening of the monsoon.
4 Conclusions
BC concentrations were continuously measured based on a 50-year ice core (ERIC2002C) retrieved from the ERG in the northeast saddle of Mt. Qomolangma. The general varying trend of BC concentrations indicated a significant increase since the mid-1990s, and the seasonal cycles of BC concen-trations suggested BC concentration level in monsoon sea-sons was higher than that in non-monsoon seasea-sons. The es-timated atmospheric BC concentrations over the ERG dur-ing the past 50 yrs showed similar varydur-ing trend with that in ice, and the average was about 80 ng m−3. The trans-ports of BC in the ERG simulated by the HYSPLIT model indicated that South Asia’s BC emissions in monsoon sea-sons dominated the varying trend of BC concentrations in ERIC2002C. And it was suggested BC from South Asia’s emissions could penetrate into the high Himalayas, although the elevated Himalayas could block off the air masses trans-ported from South Asia to some extent. Significant radiative forcing was caused by the BC in the ice core simulated by the SNICAR model. Considering BC as solar radiative absorbers both in atmosphere and in snow/ice, It was suggested that this amplitudes of BC concentrations in the atmosphere over the Himalayas and consequently in the ice in the glaciers could not be neglected when assessing the dual warming effects on glacier melting in the Himalayas.
Acknowledgements. We would like to thank S. Warren and the
anonymous referee for their valuable comments greatly improving the paper. Also, we would like to thank M. G. Flanner for his help simulating the BC radiative forcing in ice using the SNICAR model, and Y. Liu, Y. Wang, and Z. Geng for their help in preparing the samples at the SKLCS and K. Oikonomou at the LSCE for assisting in analyzing the samples. This work was supported by the National Basic Research Program of China (2007CB411503), the Chinese Academy of Sciences (KZCX3-SW-344), the National Natural Science Foundation of China (90411003), and the Opening Fund of the SKLCS (2007–2009). In France, it benefited from funding support from the Direction des Relations Europeennes et Internationales of the Centre National de Recherche Scientifique (CNRS), through the Programme International de Cooperation Scientifique (PICS) project “Climate and Environment in Antarc-tica and the Himalayas” (CLEAH, 3299). Additional support was provided by the French embassy in China.
Edited by: T. Kirchstetter
References
Bond, T. C., Streets, D. G., Yarber, K. F., Nelson, S. M., Woo, J., and Klimont, Z.: A technology-based global inventory of black and organic carbon emissions from combustion, J. Geo-phys. Res., 109, D14203, doi:10.1029/2003JD003697, 2004. Bond, T. C., Bhardwaj, E., Dong, R., Jogani, R., Jung, S., Roden,
C., Streets, D. G., and Trautmann, N. M.: Historical emissions of black and organic carbon aerosol from energy-related com-bustion, 1850–2000, Global Biogeochem. Cycles, 21, GB2018, doi:10.1029/2006GB002840, 2007.
Bryson, R. A.: Airstream climatology of Asia, in: Proceedings of the International Symposium on the Qinghai-Xizang Plateau and Mountain Meteorology, American Meteorological Society, Boston, MA, USA, pp. 604–617, 1986.
Cachier, H., Br´emond, M. P., and Buat-M´enard, P.: Determination of atmospheric soot carbon with a simple thermal method, Tellus, 41B(3), 379–390, 1989.
Cachier, H. and Pertuisot, M. H.: Particulate carbon in Arctic ice, Analysis Magazine, 22, 34–37, 1994.
Ch´ylek, P., Srivastava, V., Cahenzli, L., Rinnick, R. G., Dod, R. L., Novakov, T., Cook, T. L., and Hinds, B. D.: Aerosol and Graphitic Carbon Content of Snow, J. Geophys. Res., 92, 9801– 9809, 1987.
Ch´ylek, P., Johnson, B., Damiano, P. A., Taylor, K. C., and Clement, P.: Biomass burning record and black carbon in the GISP2 ice core, Geophys. Res. Lett., 22(2), 89–92, 1995.
Clarke, A. D. and Noone, K. J.: Soot in the Arctic snowpack: A cause for perturbations in radiative transfer, Atmos. Environ., 19, 2045–2053, 1985.
Croft, B., Lohmann, U., and von Salzen, K.: Black carbon ageing in the Canadian Centre for Climate modelling and analysis atmo-spheric general circulation model, Atmos. Chem. Phys., 5, 1931– 1949, 2005, http://www.atmos-chem-phys.net/5/1931/2005/. Davidson, C. I., Jaffrezo, J. L., Mosher, B. W., Dibb, J. E., Borys, R.
D., Bodhaine, B. A., Rasmussen, R. A., Boutron, C. F., Gorlach, U., Cachier, H., Ducret, J., Colin, J. L., Heidam, N. Z., Kemp, K., and Hillamo, R.: Chemical constituents in the air and snow
J. Ming et al.: BC record based on a Himalayan ice core 1351 at Dye 3, Greenland: II. Analysis of Episodes in April 1989,
Atmos. Environ., 27(A), 2723–2738, 1993.
Draxler, R. R. and Hess, G. D.: An overview of the HYSPLIT 4 modelling system for trajectories, dispersion, and deposition, Aust. Meteorol. Mag., 47, 295–308, 1998.
Duan, K., Yao, T., and Thompson, L. G.: Low-frequency of south-ern Asian monsoon variability using a 295-year record from the Dasuopu ice core in the central Himalayas, Geophys. Res. Lett., 31, L16209, doi:10.1029/2004GL020015, 2004.
Flanner, M. G., Zender, C. S., Randerson, J. T., and
Rasch, P. J.: Present-day climate forcing and response from black carbon in snow, J. Geophys. Res., 112, D11202, doi:10.1029/2006JD008003, 2007.
Hansen, J. and Nazarenko, L.: Soot climate forcing via snow and ice albedos, Proc. Natl. Acad. Sci., 101(2), 423–428, doi:10.1073/pnas.2237157100, 2004.
Hou, S., Chappellaz, J., Jouzel, J., Chu, P. C., Masson-Delmotte, V., Qin, D., Raynaud, D., Mayewski, P. A., Lipenkov, V. Y., and Kang, S.: Summer temperature trend over the past two millennia using air content in Himalayan ice, Clim. Past, 3, 89–95, 2007, http://www.clim-past.net/3/89/2007/.
Jacobson, M. Z.: Climate response of fossil fuel and
bio-fuel soot, accounting for soot’s feedback to snow and sea ice albedo and emissivity, J. Geophys. Res., 109, D21201, doi:10.1029/2004JD004945, 2004a.
Jacobson, M. Z.: The short-term cooling but long-term warming due to biomass burning, J. Climate, 17, 2909–2926, 2004b. Jenk, T. M., Szidat, S., Schwikowski, M., G¨aggeler, H. W., Br¨utsch,
S., Wacher, L., Synal, H.-A., and Saurer, M.: Radiocarbon anal-ysis in an Alpine ice core: record of anthropogenic and biogenic contributions to carbonaceous aerosols in the past (1650–1940), Atmos. Chem. Phys., 6, 5381–5390, 2006,
http://www.atmos-chem-phys.net/6/5381/2006/.
Kang, S., Mayewski, P. A., Qin, D., Yan, Y., Zhang, D., and Hou, S.: Twentieth century increase of atmospheric ammonia recorded in Mt. Everest ice core, J. Geophys. Res., 107(D21), 4595, doi:10.1029/2001JD001413, 2002.
Kang, S., Mayewski, P. A., Qin, D., Sneed, S. A., Ren, J., and Zhang, D.: Seasonal differences in snow chemistry from the vicinity of Mt. Everest, central Himalayas, Atmos. Environ., 38, 2819–2829, 2004.
Koch, D. and Hansen, J.: Distant origins of Arctic black carbon: A Goddard Institute for Space Studies ModelE experiment, J. Geophys. Res., 110, D04204, doi:10.1029/2004JD005296, 2005. Lavanchy V. M. H., G¨aggeler, H. W., Schotterer, U., Schwikowski, M., and Baltensperger, U.: Historical record of carbonaceous particle concentrations from a European high-alpine glacier (Colle Gnifetti, Switzerland), J. Geophys. Res., 104(D17), 21 227–21 236, 1999.
Lelieveld, J., Crutzen, P. J., Ramanathan, V., et al.: The Indian Ocean Experiment: widespread air pollution from South and Southeast Asia, Science, 291, 1031–1036, 2001.
McConnell, J. R., Edwards, R., Kok, G. L., Flanner, M. G., Zender, C. S., Saltzman, E. S., Banta, J. R., Pasteris, D. R., Carter, M. M., and Kahl, J. D. W.: 20th-century industrial black carbon emis-sions altered arctic climate forcing, Science, 317, 1381–1384, 2007.
Ming, J., Zhang, D., Kang, S., and Tian, W.: Aerosol and fresh snow chemistry in the East Rongbuk Glacier on the northern
slope of Mt. Qomolangma, J. Geophys. Res., 112, D15307, doi:10.1029/2007JD008618, 2007.
Nieuwolt, S. (Ed.): Tropical Climatology: An Introduction to the Climates of the Low Latitudes, John Wiley, New York, USA, pp. 277, 1977.
Noone, K. J. and Clarke, A. D.: Soot scavenging measurements in Arctic snowfall, Atmos. Environ., 22, 2773–2778, 1988. Qin, D., Hou, S., Zhang, D., Ren, J., Kang, S., Mayewski, P. A.,
and Wake, C. P.: Preliminary results from the chemical records of an 80 m ice core recovered from the East Rongbuk Glacier, Mt. Qomolangma, Ann. Glaciol., 35, 278–284, 2002.
Ramanathan, V., Crutzen, P. J., Kiehl, J. T., and Rosenfeld, D.: Aerosols, Climate, and the Hydrological Cycle, Science, 294, 2119–2124, 2001a.
Ramanathan, V., Crutzen, P. J., Lelieveld, J., et al.: Indian Ocean Experiment: An Integrated Analysis of the Climate Forcing and Effects of the Great Indo-Asian Haze, J. Geophys. Res., 106, 28 371–28 398, 2001b.
Ramanathan, V. and Ramana, M. V.: Atmospheric Brown Clouds: long-range transport and climate impacts, EM, 28–33 December 2003.
Ramanathan, V., Ramana, M. V., Roberts, G., Kim, D., Corrigan, C., Chung, C., and Winker, D.: Warming trends in Asia amplified by brown cloud solar absorption, Nature, 448, 575–578, 2007. Ren, J., Jing, Z., Pu, J., and Qin, X.: Glaciers variations and climate
change in the central Himalaya over the past few decades, Ann. Glaciol., 43, 218–222, 2006.
Shen, Z.: The precipitation characteristic in Mt. Qomolangma re-gion, in Scientific Report of Mount Qomolangma Region (1966– 1968): Meteorological and Solar Radiation (in Chinese), Science Press, Beijing, China, pp. 11–20, 1975.
Tian, L., Yao, T., Schuster, P. F., White, J. W. C., Ichiyanagi, K., Pendall, E., Pu, J., and Yu, W.: Oxygen-18 concentrations in recent precipitation and ice cores on the Tibetan Plateau, J. Geo-phys. Res., 108(D9), 4293, doi:10.1029/2002JD002173, 2003. Textor, C., Schulz, M., Guibert S., et al.: Analysis and
quantifi-cation of the diversities of aerosol life cycles within AeroCom, Atmos. Chem. Phys., 6, 1777–1813, 2006,
http://www.atmos-chem-phys.net/6/1777/2006/.
Van der Werf, G. R., Randerson, J. T., Giglio, L., Collatz, G. J., Kasibhatla, P. S., and Arellano Jr., A. F.: Interannual variability of global biomass burning emissions from 1997 to 2004, Atmos. Chem. Phys., 6, 3423–3441, 2006,
http://www.atmos-chem-phys.net/6/3423/2006/.
Wake, C. P., Mayewski, P. A., Li, Z., Han, J., and Qin, D.: Mod-ern eolian dust deposition in central Asia, Tellus, 46B, 220–233, 1994.
Warren, S. G. and Wiscombe, W. J.: Dirty snow after nuclear war, Nature, 313, 467–470, 1985.
Warren, S. G. and Clarke, A. D.: Soot in the atmosphere and snow surface of Antarctica, J. Geophys. Res., 95(D2), 1811–1816, 1990.
Xiao, C., Mayewski, P. A., Qin, D., Li, Z., Zhang, M., and Yan, Y.: Sea level pressure variability over the southern Indian Ocean inferred from a glaciochemical record in Princess Eliz-abeth Land, east Antarctica, J. Geophys. Res., 109, D16101, doi:10.1029/2003JD004065, 2004.
Ye, D. (Ed.) and Yang, G.: The average vertical circulation over the Qinghai-Xizang Plateau, in Tibetan Plateau Meteorology (in
Chinese), Science Press, Beijing, China, pp. 202–212, 1979. Zhang, S., Hou, S., Ma, X., Qin, D., and Chen, T.: Culturable
bac-teria in Himalayan glacial ice in response to atmospheric circu-lation, Biogeosciences, 4, 1–9, 2007,