HAL Id: hal-01780381
https://hal.archives-ouvertes.fr/hal-01780381
Submitted on 17 Feb 2021
HAL is a multi-disciplinary open access
archive for the deposit and dissemination of
sci-entific research documents, whether they are
pub-lished or not. The documents may come from
teaching and research institutions in France or
abroad, or from public or private research centers.
L’archive ouverte pluridisciplinaire HAL, est
destinée au dépôt et à la diffusion de documents
scientifiques de niveau recherche, publiés ou non,
émanant des établissements d’enseignement et de
recherche français ou étrangers, des laboratoires
publics ou privés.
bloom to oligotrophy in the Northwestern
Mediterranean Sea
France van Wambeke, Madeleine Goutx, Laurent Striby, Richard Sempere,
Francesca Vidussi
To cite this version:
France van Wambeke, Madeleine Goutx, Laurent Striby, Richard Sempere, Francesca Vidussi.
Bac-terial dynamics during the transition from spring bloom to oligotrophy in the Northwestern
Mediter-ranean Sea. Marine Ecology Progress Series, Inter Research, 2001, 212, pp.89-105. �hal-01780381�
© Inter-Research 2001
Bacterial dynamics during the transition from
spring bloom to oligotrophy in the northwestern
Mediterranean Sea: relationships with particulate
detritus and dissolved organic matter
France Van Wambeke
1,*, Madeleine Goutx
1, Laurent Striby
1, Richard Sempéré
1,
Francesca Vidussi
21Microbiologie Marine, CNRS, UMR 6117, Campus de Luminy, Case 907, 13 288 Marseille Cedex 9, France 2Observatoire Océanologique de Villefranche, Laboratoire de Physique et Chimie Marines, URA CNRS 2076,
BP 08, 06 238 Villefranche-sur-Mer, France
ABSTRACT: The variability in microbial communities (abundance and biomass), bacterial production and ectoaminopeptidase activity, particulate and dissolved organic carbon (POC, DOC), and particu-late and dissolved lipids was examined in spring 1995 in the northwestern Mediterranean, where a transition from the end of a bloom to pre-oligotrophic conditions was observed. Four time series of 36 h each and 4 h sampling intervals were performed at 5 m and at the chlorophyll maximum (30 m) between 11 and 31 May. Simultaneous measurements of pigments, abundance of hetero- and autotrophic flagellates, bacteria and POC enabled the estimation of living POC (defined as autotrophic-C plus heterotrophic-C biomass), and thus the detrital organic carbon. During the first 2 time series (11 to 15 May), the bacterial-C biomass was higher than the autotrophic-C biomass at 5 m (ratio 1.4 and 1.7), whereas the opposite trend was observed in the chlorophyll peak (ratio 0.7 for the first cycle). However, at the end of May, autotrophic-C biomass was equivalent to bacterial-C bio-mass at both depths studied. The detrital pool remained a more or less constant fraction of the POC (52, 53 and 47% on 11–12 May, 14–15 May and 30–31 May) at the chlorophyll peak, whereas it decreased significantly with time (62 to 53%) at 5 m. Relationships between bacterial activities and evolution of available resources were not systematically evidenced from our 36 h diel cycle data. Nevertheless, at the monthly scale, comparison of bacterial carbon demand (BCD) to potential carbon resources (detrital POC and DOC) showed that bacteria fed differently on the various pools. From ectoaminopeptidase turnover rates and detrital POC, the potential hydrolysis rate of detritus was cal-culated. Depending on the choice of conversion factors for bacterial production and estimates of hydrolysis turnover rates, it was shown that bacterial hydrolysis of detritus could be one of the DOC accumulation sources. We observed that the percentage of BCD supplied by detrital POC hydrolysis increased in the surface and decreased in the chlorophyll peak. An index of lipid degradation in POC, the lipolysis index, increased during the month at 5 m, also indicating a higher hydrolysis of POC. The opposite trend was observed in the chlorophyll maximum layer. The selective decrease in dis-solved lipids in DOC in the chlorophyll maximum layer, particularly free fatty acids, also suggests that bacteria utilized increased fractions of carbon sources from the DOC. We concluded that parti-tioning between DOC and detritus as resources for bacteria can change during the rapid transition period from mesotrophy to oligotrophy in the northwestern Mediterranean.
KEY WORDS: Particulate detritus · Ectoaminopeptidase activity · Bacterial production · Lipids · Pigments · Northwestern Mediterranean
Resale or republication not permitted without written consent of the publisher
INTRODUCTION
The flux of carbon channelled through bacteria, i.e. the bacterial carbon demand (BCD), is calculated as the ratio of bacterial production to bacterial growth efficiency. Bacterial production is presently a com-monly measured parameter (Ducklow & Carlson 1992). By the use of biodegradation experiments or respira-tion rates, increasing data on bacterial growth efficien-cies on a wide range of trophic conditions are available (del Giorgio & Cole 1998). However, it is still difficult to estimate which carbon sources are used by bacteria, both in terms of origin and nature. Not only living par-ticles provide dissolved organic carbon (DOC) from egestion, excretion and sloppy feeding processes (Jumars et al. 1989); detrital particles also provide DOC from bacterial ectoenzymatic hydrolysis and sol-ubilisation processes (Smith et al. 1992, Sempéré et al. 2000). Numerous studies reveal the importance of ectoenzymatic activities in fueling DOC from particles and degrading dissolved polymeric material into an assimilable form (Hoppe et al. 1988, 1993, Chrost 1991, Middleboe et al. 1995). The contribution of a given chemical pool to BCD can be assessed by using chem-ical analysis of dissolved organic matter combined with radiolabelling techniques, for example carbohy-drates (Skoog et al. 1999), and free and combined amino acids (Hagström et al. 1984, Keil & Kirchman 1999). However, the chemical characterization of the whole DOC pool is far from known (Benner et al. 1992, McCarthy et al. 1996).
In addition, quality and quantity of carbon resources available for bacteria (Carlucci et al. 1984, Jørgensen 1987, Gasol et al. 1998) exhibit short-term variations due to various processes. On a short time scale, autotrophs have to change their metabolism with diel variations in light availability, and migrating organ-isms preying at night in surface waters modify the intensities of grazing and sloppy feeding. As a conse-quence, bacteria respond quickly to spatial and tempo-ral variations in their environment by adapting their metabolism, like production (Zohary & Robarts 1992, Christaki et al. 1996, Gasol et al. 1998), ectoenzymatic activity (Middelboe & Søndergaard 1993, Bochandsky et al. 1995), and utilization of molecules (Carlucci et al. 1984, Jørgensen 1987). On a seasonal scale, DOC ac-cumulates in surface waters of the Mediterranean Sea during the stratification period (Copin-Montégut & Avril 1993). Such accumulation allows transfer of organic material to the deep layers through diffusive processes and winter convection of DOC. Thus, deter-mining to which extent bacteria will utilize suspended detrital particles rather than the one and only DOC pool is particularly important to the fate of organic car-bon from the euphotic zone.
In May 1995, in the framework of France-JGOFS program, we examined bacterial processes during a multi-disciplinary cruise (the DYNAPROC cruise) studying physical, chemical and biological fluxes simultaneously at a high sampling frequency in the upper layers of the Mediterranean time series station Dyfamed (Andersen & Prieur 2000). Reduced physical dynamics characterize this station, situated in the cen-tral part of the Ligurian Sea and generally out of the influence of the Ligurian Current. This station can be considered as typical of the whole northwestern Mediterranean Sea (Marty et al. 1994). Previous results indicated that transfer of organic material to deep lay-ers takes place through diffusive processes and winter convection of DOC (18.4 g C m–2yr–1, Copin-Montégut
& Avril 1993) and from export of large sinking particles (5 g C m–2yr–1, Miquel et al. 1994).
In the frame of this program, our goal was to deter-mine whether there were significant variations con-cerning potential carbon resources (DOC, particulate detritus), whether bacteria modified their activities according to the structure of the microbial food web and the available organic matter, and on what time scale could we observe such variations. For this, we recorded estimations of bacterial production, ecto-aminopeptidase activity and microbial biomasses (bac-teria, flagellates, pigments), particulate organic carbon (POC) and DOC at high frequency in the water col-umn. Simultaneously, the lipid composition in POC and DOC pools, which indicated the degree of degra-dation of particles and DOC, was examined. We exam-ined variations of these parameters on daily and weekly scales. To our knowledge, there is no direct way to determine the particulate detritus fraction in POC. Thus, we developed an approach combining dis-tribution of diagnostic pigment, and epifluorescence counts of < 20 µm living components to accurately determine auto- and heterotrophic carbon biomass. Concentration of particulate detritus were then ob-tained by the difference between POC and living bio-mass. BCD was compared to potential hydrolysis of particulate detritus. This allowed us to relate the vari-ability of bacterial properties on the diel and month scale to the characteristics of organic matter and the structure of the microbial food web.
MATERIALS AND METHODS
Sampling. Hydrological, chemical and biological parameters were recorded in the water column at the Dyfamed station (43° 25’ N, 07° 52’ E, 2350 m depth) following the drift of sediment traps during 4 cycles of 36 h each (C1: 11–12 May, C2: 14–15 May, C3: 27–28 May, C4: 30–31 May, 1995). Time-series observations
were assembled from serial hydrocasts through the upper 500 m made precisely every 4 h, from 10:00 h the first day until 22:00 h the second day (UT+ 2). Sunrise and sunset were, respectively, at 06:30 and 21:10 h (UT+ 2) during the cruise. Samples were collected using Niskin bottles at 2 depths: 5 m because the surface reference layer was assumed to be influenced by meteorological events (wind stress, rain) and be-cause this is the layer where maximum light intensity occurs (50% incident light), and 30 m because this layer corresponded to the depth of the chlorophyll maximum established since the beginning of the cruise (3% incident light). Aliquots were taken immediately after recovery of water samples for measurements of biological and chemical parameters. The biological variables measured included the numbers of bacteria, cyanobacteria, phototrophic and heterotrophic nano-flagellates, bacterial production and ectoaminopep-tidase activity. Biochemical variables were POC and DOC, particulate (PL) and dissolved (DL) lipids (DOC and DL were sampled every 4 h only for C1 and C3), and pigments. Whenever possible (twice during C1 and C2, and once during C3 and C4), bacterial activities and abundance of microbial populations were estimated along vertical profiles between 0 and 200 m depth.
Biochemical analyses. Pigments were analyzed by High Performance Liquid Chromatography (HPLC) and used herein to derive the concentration (in terms of chlorophyll a) of different phytoplanktonic groups (Claustre et al. 1994) and, in a second step, to convert them in terms of autotrophic carbon biomass. The chemo-taxonomic significance of the main diagnostic pigments is as follows: peridinin is the marker of dinoflagellates, 19’-hexanoyloxyfucoxanthin + 19’-bu-tanoyloxyfucoxanthin (19’ HF + 19’ BF) of chromophyte nanoflagellates, alloxanthin of cryptophytes, fucoxan-thin of diatoms, zeaxanfucoxan-thin of cyanobacteria, chlo-rophyll b of green flagellates, divinyl-chlorophyll a (Dv-chl a) of prochlorophytes. Detailed protocols of pig-ment sampling and analysis during the DYNAPROC cruise are available in Vidussi et al. (2000).
For POC and PL analysis, 4 and 2 l samples, respec-tively, were filtered onto pre-combusted (450°C, 6 h) GF/F glass fiber filters. POC was determined using a LECO CHN 900 analyzer. Coefficient of variation (CV) inter-filter was within 2 to 10%. Particulate lipids were extracted from the filters according to the Bligh & Dyer (1959) protocol. Briefly, PLs were dissolved in a mono-phasic mixture of dichloromethane:methanol:water (1.25:1:0.8). Then, addition of water (final proportion 2:2:1.8) separated the mixture into aqueous and or-ganic phases. Lipids were concentrated in the latter. Dissolved lipids were liquid-liquid extracted from the GF/F filtrate (2 l) by dichloromethane. From the partic-ulate and dissolved extracts, lipid classes were
sepa-rated on chromarods and quantified on a thin layer chromatography/flame ionisation detection Iatroscan TH10-MKIV apparatus according to Goutx et al. (1990) modified by Striby et al. (1999). The compounds de-tected included reserve lipids (TG: triglycerides, and WE: wax esters), membrane lipids (ML), degradation metabolites of these acyl-lipids, namely free fatty acids (FFA), alcohols (ALC), diglycerides (DG) and mono-glycerides (MG), and hydrocarbons. CV for particulate and dissolved lipids analysis was under 11 and 16%, respectively. In the present paper, we use the follow-ing information for characterizfollow-ing the carbon pools and the degradation status of organic matter: total lipids (the sum of the different classes in dissolved fraction, DL, and in particulate fraction, PL, from which we sub-tracted hydrocarbons), triglycerides (TG), and the ratio of degradation metabolites to the entire acyl-lipids (FFA + ALC + DG + MG)/(TG + WE + ML). This ratio (the lipolysis index) was determined in dissolved and particulate phases, respectively LId and LIp. Carbon equivalents were estimated from the respective distri-bution of each lipid class.
Samples for DOC analysis were measured by high temperature combustion on a Shimadzu TOC 5000 Analyzer. Details of this procedure have been previ-ously described (Dafner et al. 1999, Yoro et al. 1999). A 4-point calibration curve was performed daily with standards (83 to 332 µM C) prepared by diluting a stock solution of potassium hydrogen phthalate in Milli-Q water. The instrument blank ranged from 6 to 9 µM C and the error between 2 duplicate samples ranged from 3 to 10%.
Bacteria, cyanobacteria, nanoflagellates: epifluo-rescence countings. Samples for the enumeration of bacteria and protozoa were fixed with 2% buffered formalin filtered through 0.2 µm. Between 6 and 15 ml were filtered within 12 h after sampling on black Nuclepore filters (0.2 µm) that were subsequently stained with DAPI (4, 6-diamidino-2-phenylindole, final concentration 2500 µg l–1). Filters were mounted in Olympus immersion oil on slides and stored frozen until examination. On the same filter, we counted bac-teria by image-analyzed epifluorescence microscopy (Van Wambeke 1995), and cyanobacteria (CYAN), het-erotrophic nanoflagellates (HNAN), and phototrophic nanoflagellates (PNAN) by manual epifluorescence microscopy. For bacteria, up to 40 fields containing 50 to 80 bacteria each were counted (CV inter-field, 6 to 16%). CYAN were counted under blue light excitation. About 60 to 100 flagellates were counted per filter in random 10 mm strips (80 µm width). CV inter-strips were within 10 to 22%. HNAN were classified as all eucaryotic non-pigmented organisms less than 10 µm in size, and PNAN were identified as chlorophyll con-taining cells by their red autofluorescence.
Bacterial biomass (BB) was calculated from abun-dances using 20 fg C cell–1 (Lee & Fuhrman 1987). CYAN were dominated by coccoid forms with diame-ters ranging from 0.8 to 1.2 µm with a mean diameter of 0.9 ± 0.2 µm, and thus a mean biovolume of 0.45 µm3 was used. Size spectra of nanoflagellates was estab-lished on some occasions from which we calculated an average biovolume of 6 µm3for HNAN and of 38 µm3 for PNAN. Biovolume-carbon conversion factors were 250 fg C µm– 3for CYAN (Kana & Glibert 1987) and 220 fg C µm– 3for HNAN and PNAN (Børsheim & Brat-bak 1987).
Pigment-derived autotrophic biomass. The auto-trophic carbon biomass was estimated by the chloro-phyll a (chl a) content of the different taxonomic phyto-plankton groups, taking into account the effect of photoacclimation on the chl a to carbon ratio for each category of phytoplankton.
The chl a concentration associated to each phyto-planktonic group was derived from pigment data using multiple regression analysis which calculates the ratio between chl a and the specific pigment for the differ-ent phytoplankton group. This approach was used and described in details in Vidussi et al. (2000) although in this latter paper, the empirical regression equation was realized on depth-integrated (0 to 200 m) diagnostic pigments.
The multiple regression equation is:
[T chl a] = [chl a + Dv chl a] = y intercept + a[19’ – HF + 19’ – BF]+ b [fucoxanthin] + c [zeaxanthin]+ d
[alloxanthin]+ e[chl b]+ f[peridin]+ [Dv chl a]
in which the terms in brackets are the concentration of pigments in ng l–1, T chl a is the total chl a, and the
terms a to f refer to the chl a /specific pigment ratio of
the respective phytoplankton groups; d, e and f were
imposed as constant values from the literature (Vidussi et al. 2000), whereas values a, b, c resulted from
run-ning the regression equation.
Since photoacclimation can result in both changes in chl a /specific pigment ratios and in the C/chl a ratio
for each phytoplankton group (Cullen 1982), we esti-mated for each depth (5 and 30 m), an equivalent chl a
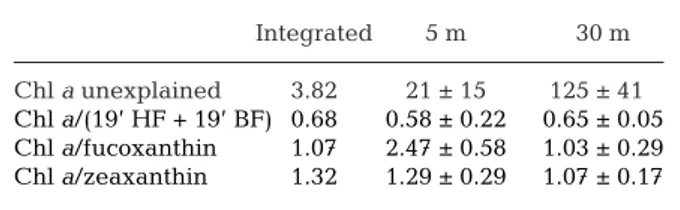
for each category of diagnostic pigment using multiple regression analysis. Therefore, taking into account the photoacclimation process, we realized the multiple regression analysis on 2 data sets: diagnostic pigments at 5 m depth and diagnostic pigments at 30 m depth. Results of multiple regression analysis are presented in Table 1. No significant difference between the
coeffi-cients were obtained from regression using depth-integrated pigments reported by Vidussi et al. (2000) and those calculated from pigment concentrations at 5 and 30 m depth (this study), except for fucoxanthin at 5 m.
More effects of photoacclimation of phytoplankton species to irradiance were expected in the C/chl a
ratios. We calculated depth-dependant C/chl a
conver-sion factors for 5 and 30 m by comparison of PNAN car-bon (obtained from epifluorescence) and diagnostic pigments. We assumed the 3 phytoplankton groups: chromophyte nanoflagellates (identified by 19’ HF + 19’ BF) + cryptophytes (identified by alloxanthin) + green flagellates (identified by chl b) to be
representa-tive of PNAN. We plotted the biovolume-based PNAN carbon biomass (see section above) against the sum of equivalent chl a concentration obtained from these
4 groups of pigments (Fig. 1) at 5 and 30 m depth, respectively. Both correlations were significant (p < 0.01). The slopes 120 and 35 were representative of the C/chl a ratio of chromophyte nanoflagellates,
crypto-Integrated 5 m 30 m Chl a unexplained 3.82 21 ± 15 125 ± 410
Chl a/(19’ HF + 19’ BF) 0.68 0.58 ± 0.22 0.65 ± 0.05 Chl a/fucoxanthin 1.07 2.47 ± 0.58 1.03 ± 0.29 Chl a/zeaxanthin 1.32 1.29 ± 0.29 1.07 ± 0.17 Table 1. Results of the multiple regression of diagnostic pig-ment concentrations with chl a. Regressions tested with an
integrated pigment concentration (0 to 200 m, Vidussi et al. 2000), with 5 m data or with 30 m data (this study). Chl a,
diag-nostic pigments and chl a unexplained are expressed in ng l–1
in regressions made on pigments from 5 and 30 m and in mg m–2for regression made on integrated pigments. Constant
val-ues were imposed for alloxanthin (3.34), chl b (0.70) and
peri-dinin (2.50) in the 3 regressions tested. The chl a unexplained
by the regression model is the y intercept of the regression.
r2= 0.900, df = 41 at 5 m and r2= 0.947, df = 42 at 30 m
Fig. 1. Relationships between carbon biomass of phototrophic nanoflagellates (calculated from epifluorescence counts and biovolume) and equivalent chl a concentrations of their
corre-sponding phytoplankton groups (calculated from the 4 fami-lies of pigments: 19’ HF, 19’ BF, alloxanthin and chlorophyll b,
and their respective diagnostic pigment/chl a ratios) at 5 (s)
and 30 m depth (d). Regression equations are forced to cross the origin. Slope = 118 ± 9, df = 35, r2 = 0.402 at 5 m and
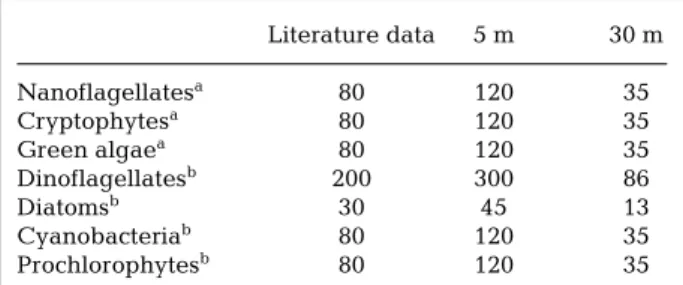
phytes and green nanoflagellates at 5 and 30 m, respectively. The ratio of the slopes (120 and 35) dif-fered by a factor of 3.5. Accordingly, we used different C/chl a ratios at 5 and 30 m, differing by this factor of 3.5, for other taxonomic phytoplankton groups (Table 2), with respect to the range described in the lit-erature (Durbin 1977, Claustre & Gostan 1987, Kana & Glibert 1987, Claustre et al. 1994, Vidussi 1998).
Bacterial production. Bacterial production (BP) was estimated by the thymidine method (Fuhrman & Azam 1982). Duplicate samples (20 to 40 ml) and a blank (for-malin-killed, 2% final concentration) were incubated with 20 nM [Methyl-3H]-thymidine (3H-Tdr, 44 Ci mmol–1) for 2 to 4 h in sterile disposable plastic flasks at 15°C. Incubation was terminated with the addition of 2% formalin. Samples were filtered through 0.2 µm Nuclepore filters, extracted with ice cold 5% trichlor-acetic acid (TCA) for 15 min, and finally rinsed 3 times with 5% TCA. We preliminarily checked the condi-tions for linear incorporation and isotope saturation. We used the commonly cited conversion factor of 2 × 10¹⁸ cells mol–1thymidine incorporated as well as an average (0.84 ×10¹⁸cells mol–1) of empirical factors re-ported for the western Mediterranean Sea by Fernán-dez et al. (1994), Christaki & Van Wambeke (1995), Gasol et al. (1998) and from experiments on biodegra-dation of DOC conducted in April 1995 in the area (Sempéré et al. 1998).
Ectoaminopeptidase activity. Hydrolysis of fluoro-genic substrate was used to measure ectoaminopepti-dase activity. The fluorescent analog L -leucine-4-methyl-7-coumarinylamide (MCA-leu) was added to 30 ml of water (1 µM final concentration) in sterile dis-posable plastic tubes and incubated for up to 5 h. Dur-ing the incubation, subsamples were transferred to the quartz cuvette and fluorescence (excitation 365 nm,
emission 445 nm) was read with a Kontron SFM 23B spectrofluorometer calibrated with MCA. Blanks con-sisted of 0.2 µm filtered seawater which was boiled for 15 min. MCA-leu hydrolysis rates were calculated by subtracting the rate of change in fluorescence of the blanks from the average rate of change in fluorescence of the duplicates. Mean reproducibility within dupli-cates was 3% and rate of blanks ranged from 0.5 to 4% of the mean response of duplicates. Activity was ex-pressed in terms of fraction of the substrate hydrolyzed per hour (ectoaminopeptidase turnover rate [Hr], in % h–1), as defined by Hoppe et al. (1988).
Statistical data treatment. A long-term trend was determined by linear regression of parameters with time and an F-test on slopes were performed. The depth of the chlorophyll peak did not always corre-spond to the 30 m depth. Thus, for the study of the long-term trend at 30 m depth, we selected only the data coinciding with the chlorophyll peak.
For estimating diel variability, day samples (10:00, 14:00, 18:00 h UT+ 2) were compared to night samples (22:00, 02:00, 06:00 h UT+ 2) and the significance of variations were tested using a Student’s t-test after verification of homogeneity of variances. To be able to perform this test, we normalized the data. They were thus expressed in terms of percentage of the 36 h time series means when no trend with time was present, and divided by the fit to the tendency when a 36 h trend was significant.
RESULTS
Hydrodynamic and biological characteristics during the period of study
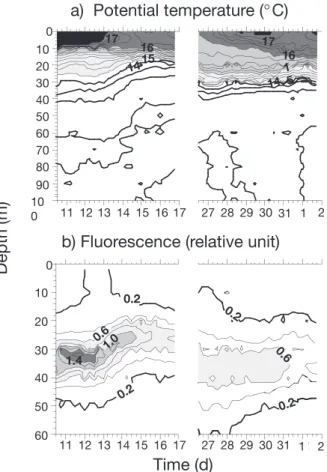
A period of calm characterized the first cycle (11–12 May). Until 13 May, the wind was low (less than 6 m s–1) and the cloud cover particularly weak before 10 May, resulting in a regular warming of the water mass (+185 W m–2for the layer 0 to 30 m), which led to the stratification and phytoplankton development (Andersen & Prieur 2000). A bloom termination was depicted (Fig. 2) around 11 of May, characterized by a narrow and high chl a peak (1.75 mg m– 3) and high primary production (Vidussi et al. 2000). On 13 May, a wind event occurred (up to 16 m s–1), just between C1 (11–12 May) and C2 (14–15 May) inducing the rising of isopycnals towards the surface and nutrient increase in the surface water. The in vivo fluorescence peak moved up from 30 to 20 m depth. Precipitation occurred between 11 and 12 May. During the end of the cruise, the cloud cover was maintained and gener-ally, the wind speed was low (< 8 m s–1), except during 24–25 May, when winds higher than 10 m s–1 were
Literature data 5 m 30 m Nanoflagellatesa 80 120 35 Cryptophytesa 80 120 35 Green algaea 80 120 35 Dinoflagellatesb 200 300 86 Diatomsb 30 45 13 Cyanobacteriab 80 120 35 Prochlorophytesb 80 120 35
aFor nanoflagellates, cryptophytes and green algae, ratios
are those obtained from Fig. 1
bFor the other groups, averages values of ratios C/chl a
were taken from the literature and adjusted for 5 and 30 m depth in order to respect the 3.5-fold ratio (due to photoacclimation) obtained for nanoflagellates
Table 2. C/chl a ratios in phytoplankton species: average
val-ues reported in the literature, and estimated valval-ues at 5 and 30 m depth
observed. After May 27, the warming up of surface lay-ers was observed again and the depth of the thermo-cline was constant.
The succession of the phytoplankton communities described by using diagnostic pigment (Vidussi et al. 2000) was as follows. At the termination of the bloom, chromophyte nanoflagellates (mainly Prymnesio-phytes) dominated the phytoplankton biomass (26 to 50%) except during the first wind event where diatoms (the other dominant group) became predominant within 24 h. Grazing accompanied by
faecal pellet production by herbivo-rous zooplankton largely controlled the particle flux (Goutx et al. 2000). During the second part of the observa-tions (27 to 31 May), the chlorophyll biomass decreased and cyanobacteria contribution increased. The microzoo-plankton (ciliates) abundance and the grazing pressure on primary produc-tion were correlatively enhanced (Pérez et al. 2000). Carnivorous spe-cies predominated in the zooplankton biomass.
Vertical profiles of bacterioplankton properties (abundance, production, ectoaminopeptidase activity) exhibited pronounced gradients in the upper 50 m (Fig. 3). Sub-surface maxima, located near the chl a maximum, varied during the cruise between 20 and 45 m depth. The most striking feature of the profiles was the superimposition of bacterial abundance, bac-terial production and ectoaminopeptidase activity with PNAN (Fig. 3) and CYAN abundance (data not shown). Thus, maximum bacterial abundance was always situ-ated near the chlorophyll maximum and reached up to 2 ×10⁹cells l–1the 11, 12 and 14 of May. After the wind event of 13 May, as the chlorophyll peak shifted to shallower layers, all categories of pico- and nano-sized organisms accompanied this feature, as well as bacter-ial activities and biomass. Integrated values (0 to 200 m) of bacteria (189 and 219 mmol C m–2) and PNAN (122 and 131 mmol C m–2) biomasses were high during 11–12 May (C1) and then decreased slightly (Table 3). Chl a and CYAN followed the same trend but increased again at the end of the month.
Time series of biological and chemical parameters
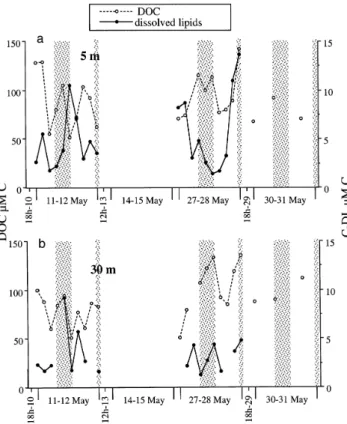
Figs. 4 to 8 display time series of CYAN, PNAN, HNAN, bacterial numbers, ectoaminopeptidase activ-ity, thymidine incorporation rates, POC, DOC, particu-late and dissolved lipids obtained at 5 and 30 m from 11 May to 31 May. Table 4 shows the means and percentages of variation in some of these parameters during each 36 h diel cycle and the significance of the trend with time on a monthly scale.
Photosynthetic microorganisms
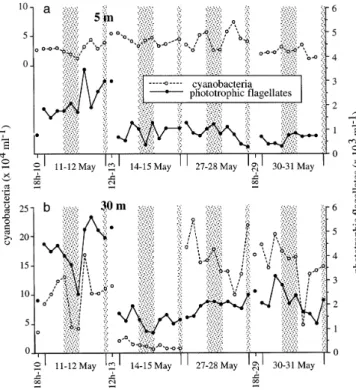
In the surface layer (5 m), CYAN abundance (1.2 to 7.4 × 10⁴ cells ml–1) showed no long-term trend whereas PNAN (0.3 to 3.4 ×10³cells ml–1) significantly decreased with time (p < 0.01, Fig. 4). In the chl a
max-11 12 13 14 15 16 17
a) Potential temperature (
°
C)
10 0 90 80 70 60 50 40 30 20 10 0 27 28 29 30 31 11 12 13 14 15 16 17Time (d)
b) Fluorescence (relative unit)
60 50 40 30 20 10 0 27 28 29 30 31 32 331 2 0.6 0.2 0.2 0.2 1 2 0.6 1.0 0.2 14 1 5 16 1415 16
Depth (m)
17 17 1.4Fig. 2. Temporal variation of (a) temperature and (b) in situ
fluorescence at the sampling site during the 2 periods studied: 10–17 May and 26 May–2 June, 1995 (after Andersen &
Prieur 2000)
Date Bacteria HNAN PNAN Cyanobacteria Chl a
(mmol C m–2) (mmol C m–2) (mmol C m–2) (mmol C m–2) (mg chl a m–2)
11 May 189 24.3 121 27.4 45.2
12 May 219 16.0 131 34.6 47.8
14 May 186 14.4 59.7 24.1 32.9
15 May 170 12.9 55.3 14.1 25.1
31 May 165 15.0 53.8 28.7 35.5
Table 3. Integrated biomasses of bacteria, heterotrophic nanoflagellates (HNAN), phototrophic nanoflagellates (PNAN), cyanobacteria and chl a content
ima layer (30 m), high amplitudes of both organisms were observed during C1. Due to the new position of chl a peak at 20 m, an important decrease of abun-dances was observed at 30 m at C2. During C3 and C4, CYAN abundance increased again but still exhibited high amplitudes. At this depth (30 m), significant changes between day and night samples were observed for PNAN during C1 and C3 (p < 0.05). On the monthly scale however, without data out of the chl a peak (see ‘Materials and methods’), CYAN signifi-cantly increased (p < 0.01) while PNAN signifisignifi-cantly decreased (p < 0.01).
Heterotrophic biomass and activities
Bacterial numbers often exceeded 1 × 10⁶ bacteria ml–1. The bacterial biomass ranged from 1.65 to
3.20 µM C at 5 m (Table 4). At this depth, bacterial number, HNAN, and thymidine incorporation rates decreased significantly through the period of study whereas a positive trend characterized the ectoamin-opeptidase turnover rate (Hr) (Figs. 5 & 6, Table 4). Bacterial biomass ranged from 1.0 to 4.1 µM C at 30 m. At 30 m, the monthly scale trend was unsignifi-cantly different from zero for bacterial abundance and production whereas it was negative for HNAN abundance and ectoaminopeptidase turnover rate (Table 4). At each 36 h cycle and at both layers stud-ied, variation of thymidine incorporation rates and ectoaminopeptidase activity were higher than those of bacterial numbers. Coefficients of variations around each 36 h time series ranged from 15 to 35% for thymidine incorporation rates, from 9 to 45% for ectoaminopeptidase activity, and from 8 to 22% for bacterial numbers.
Fig. 3. Vertical profiles 0 to 200 m of (a) phototrophic nanoflagellates (PNAN), (b) bacterial abundance, (c) thymidine incorpora-tion rates and (d) ectoaminopeptidase turnover rates (Hr) at the Dyfamed staincorpora-tion during May 1995. 11, 12, 13, 14 and 31 May:
Ectoaminopeptidase turnover rate and thymidine incorporation rates were positively correlated at 30 m (r = 0.72, n = 38); however, at 5 m depth, correlation was unsignificant (r = 0.15, n = 39) mostly because pro-duction and ectoaminopeptidase activity were in an opposite phase at the end of the month (Fig. 6). Signif-icant difference between day and night samples char-acterized HNAN during C4 at 5 m, C2 and C3 at 30 m, and thymidine incorporation rates during C1 at 5 m (p < 0.05 for all comparisons).
POC and lipid content
POC concentrations varied from 6.4 to 20 µM C and decreased significantly with time in both surface and chlorophyll maxima layers. Particulate carbon-lipids (C-PL) varied from 0.5 to 7.2 µM C at 5 m and from 0.4 to 7.9 µM C at 30 m, but decreased significantly with time only at the surface (Fig. 7, Table 4). In the surface layer, C-PL exhibited peaks around 10:00 h although there was never a significant difference between night and day. Means of lipid contribution to POC decreased
Fig. 4. Evolution of abundance of cyanobacteria and pho-totrophic nanoflagellates at (a) 5 m and (b) 30 m. In Figs. 4 to 8, the x axis is represented as follows: each 36 h time series
begins at 10:00 h (UT+ 2) and ends at 22:00 h (UT+ 2) the fol-lowing day, and includes 10 points on a linear scale (10:00, 14:00, 18:00, 22:00, 02:00, 06:00, 10:00, 14:00 18:00, and 22:00 h). Shaded area corresponds to night. Note that the x scale
is not linear with time between each 36 h time series
Fig. 5. Evolution of abundance of bacteria and heterotrophic nanoflagellates at (a) 5 m and (b) 30 m. Error bar for bacterial
abundance is the SD between slide fields
Fig. 6. Evolution of bacterial production (expressed in thymi-dine incorporation rates) and ectoaminopeptidase turnover rate at (a) 5 m and (b) 30 m. Error bar for bacterial produc-tion and ectoenzymatic activity is the variability between
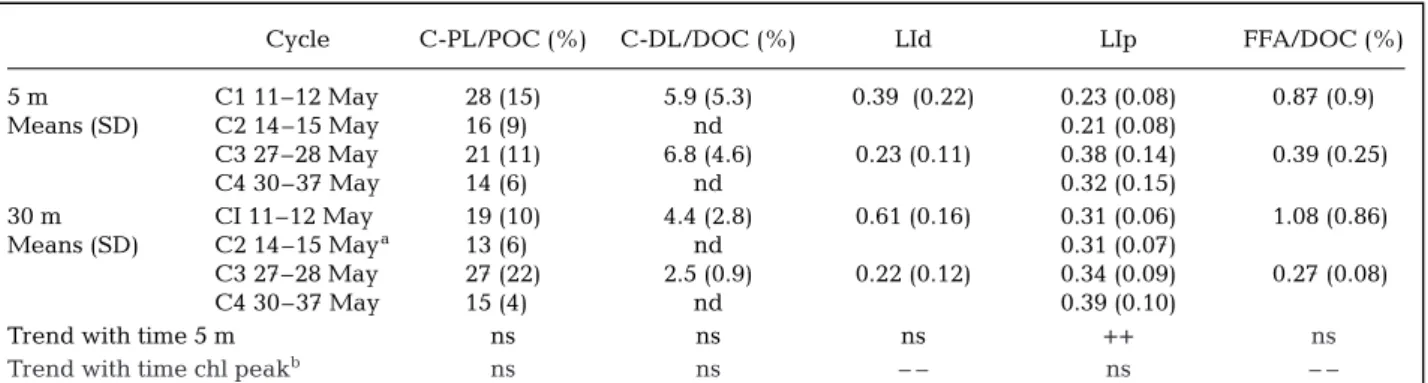
(28% at the beginning of the study, 14% at the end) but not significantly with time in the surface layer while the lipolysis index (LIp), a tracer of acyl-lipid transformation under enzymatic hydrolysis (Goutx et al. 2000, Striby 2000), increased significantly during
the month (Table 5). At 30 m, the lipid content in POC was lower than in the surface during C1 and did not change significantly with time. The LIp was higher at this depth than in the surface layer except at C3. At the
Fig. 7. Evolution of particulate organic carbon (POC) and par-ticulate carbon-lipids (C-PL) at (a) 5 m and (b) 30 m
Cycle Auto BB Tdr Hr POC C-PL DOC C-DL
(µM C) (µM C) (pmol l–1h–1) (% h–1) (µM C) (µM C) (µM C) (µM C) 5 m CI 11–12 May 2.2 (l.0) 2.6 (0.2) 6.4 (0.9) 0.14 (0.02) 13.8 (l.3) 3.8 (l.9) 88 (32) 4.5 (2.6) Means (SD) C2 14–15 May 1.9 (0.7) 2.7 (0.2) 3.7 (0.9) 0.14 (0.01) 13.2 (0.4) 2.0 (0.9) nd nd C3 27–28 May 2.5 (0.6) 2.0 (0.2) 3.4 (l.0) 0.18 (0.02) 10.2 (0.7) 2.1 (1.2) 95 (24) 6.0 (4.4) C4 30–37 May 2.0 (0.2) 2.0 (0.4) 2.9 (0.9) 0.16 (0.02) 9.2 (l.5) 1.3 (0.6) 77 (17) nd 30 m CI 11–12 May 4.0 (1.6) 3.0 (0.7) 6.2 (2.2) 0.24 (0.6)0 16.1 (3.4) 3.0 (1.1) 78 (20) 3.4 (2.7) Means (SD) C2 14–15 Maya 1.4 (0.8) 1.3 (0.3) 1.1 (0.5) 0.67 (0.3)0 10.0 (2.7) 1.1 (0.7) nd nd C3 27–28 May 2.5 (0.7) 2.5 (0.4) 6.1 (1.3) 0.18 (0.03) 11.4 (2.4) 2.9 (2.1) 102 (27)0 3.1 (1.3) C4 30–37 May 2.5 (0.4) 2.2 (0.3) 4.7 (l.5) 0.13 (0.03) 8.9 (l.5) 1.3 (0.3) 96 (13) nd
Trend with time 5 m ns – – – – ++ – – – – ns ns
Trend with time chl peakb – – ns ns – – – – ns + ns
aAt 30 m depth during Cycle 2 (14–15 May) most of the samples were deeper than the chl peak which moved up to 20 m
adepth (see text)
bFor 30 m depth only samples corresponding to the chl peak were included in the regression (n = 21 to 41 according to the
bparameter)
Table 4. Means and standard deviation (SD, in parentheses) during each 36 h diel cycle and trends in long-term time series. Auto: autotrophic biomass, BB: bacterial biomass, Tdr: thymidine incorporation rates, Hr: ectoaminopeptidase turnover rate, POC: particulate organic carbon, C-PL: particulate carbon-lipids, DOC: dissolved organic cabon, C-DL: dissolved carbon-lipids. For long-term trend each parameter is fitted to a linear regression with time. ns: slopes not statistically different from zero (p > 0.05,
variance analysis F-test). +: positive slopes, –: negative slopes at (– –, ++) p < 0.01 and (–, +) p < 0.05); nd: no data
Fig. 8. Evolution of dissolved organic carbon (DOC) and dis-solved carbon-lipids (C-DL) at (a) 5 m and (b) 30 m
end of the month particulate lipids measured at both depths were equivalent (Table 4), both in absolute val-ues and in percent relative to POC.
DOC and lipids
High frequency sampling of DOC and dissolved lipids was restricted to C1 and C3, but on some occasions DOC was measured outside these periods. DOC concentra-tions varied in the range of 51 to 142 µM (Fig. 8). Highest values were observed for C3 cycle at 5 and 30 m. Aver-aged DOC concentrations were 90 ± 25 µM C at 5 m and 91 ± 24 µM C at 30 m and were in agreement with DOC data reported for the Dyfamed station or more generally in the northwestern Mediterranean (Copin-Montégut & Avril 1993, Cauwet et al. 1997, Yoro et al. 1997). Both layers showed similar high frequency variability. At both layers studied, maximum differences between 2 succes-sive DOC samples (4 h) amounted to 74 µM, but on average they ranged from 19 to 30 µM according to the layer and the cycle studied. Concentrations of dissolved carbon-lipids (C-DL) varied from 1.3 to 14 µM. In the surface layer, C-DL represented on average 6.3 ± 4.9% of DOC. In the chlorophyll maxima, it decreased from 4.4 ± 2.8 to 2.5 ± 0.9% (Table 5). The lipolysis index (LId) was much higher at 30 m than at 5 m (Table 5) during C1. Dissolved triglycerides (TGd) (data not shown) exhibited a large variability at 5 m (2.2 ± 1.5 to 2.7 ± 2.7 µg l–1for C1 and C3, respectively) while concentrations decreased at 30 m (5.4 ± 3.8 to 2.7 ± 1.0 µg l–1).
There was no significant trend observed on the monthly scale for dissolved lipids while DOC signifi-cantly increased with time at 30 m (p < 0.05, Table 4), but did not change significantly at 5 m. Significant
increases between day and night samples were ob-served for DOC during C3 at 5 and 30 m. No differ-ences between day and night values were observed for total dissolved lipids; however, dissolved triglycerides (TGd) at C1 and C3 showed consistent peaks around 10:00–14:00 h in most cases and decreased at night at 5 m. At this depth at C1, TGd exhibited an inverse cor-relation (p < 0.001, Fig. 9) with bacterial production, from 14:00 h (May 11) to 06:00 h (May 12). Assuming that TGd were hydrolysed through bacterial activity and that the sources of TGd during that period were negligible compared to TGd degradation, we were able, from decrease of TGd concentrations with time, to estimate a turnover of 3.6 d–1.
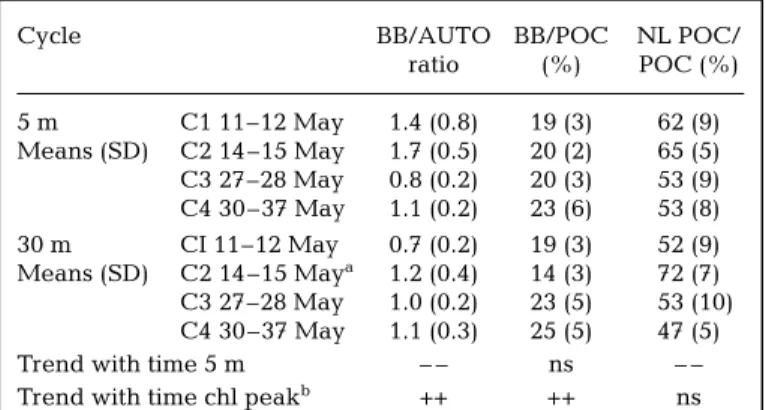
Contribution of heterotrophic and autotrophic biomasses to POC
Bacterial biomass (BB) constituted on average 20 ± 4% of POC in surface waters and 21 ± 6% at 30 m
Cycle C-PL/POC (%) C-DL/DOC (%) LId LIp FFA/DOC (%)
5 m C1 11–12 May 28 (15) 5.9 (5.3) 0.39 (0.22) 0.23 (0.08) 0.87 (0.9) Means (SD) C2 14–15 May 16 (9)0 nd 0.21 (0.08) C3 27–28 May 21 (11) 6.8 (4.6) 0.23 (0.11) 0.38 (0.14) 0.39 (0.25) C4 30–37 May 14 (6)0 nd 0.32 (0.15) 30 m CI 11–12 May 19 (10) 4.4 (2.8) 0.61 (0.16) 0.31 (0.06) 1.08 (0.86) Means (SD) C2 14–15 Maya 13 (6)0 nd 0.31 (0.07) C3 27–28 May 27 (22) 2.5 (0.9) 0.22 (0.12) 0.34 (0.09) 0.27 (0.08) C4 30–37 May 15 (4)0 nd 0.39 (0.10)
Trend with time 5 m ns ns ns ++ ns
Trend with time chl peakb ns ns – – ns – –
aAt 30 m depth during Cycle 2 (14–15 May) most of the samples were deeper than the chl peak which moved up to 20 m adepth (see text)
bFor 30 m depth only samples corresponding to the chl peak were included in the regression (n = 21 to 41 according to the
bparameter)
Table 5. Means (SD) during each 36 h diel cycle and trends in long-term time series. C-PL/POC: particulate carbon-lipid/POC percentage, C-DL/DOC: dissolved carbon-lipids/DOC percentage. Lld: lipolysis index in DOC, LIp: lipolysis index in POC,
FFA/DOC percentage of free fatty acids in DOC. nd and code for trends as in Table 4
Fig. 9. Evolution of bacterial production (BP) and dissolved triglycerides (dTG) during cycle C2, 11–12 May at 5 m
(Table 6), assuming that all bacteria were retained on the GF/F filters. Bacterial biovolume during the period of the study (post bloom conditions) was relatively large (0.08–0.11 µm3) and was in the size range of bac-teria retained by the GF/F filter (Lee & Fuhrman 1987). Heterotrophic nanoflagellates, the highest category of heterotrophic organisms in terms of carbon after bacte-ria, constituted only 2 ± 0.5 and 2.2 ± 1.1% of POC at 5 and 30 m, respectively.
As expected, after computation of autotrophic bio-mass with the depth-dependant conversion factors, autotrophic biomass appears then not so much differ-ent (in terms of carbon) between surface and chloro-phyll maximum layer. The difference which still existed during the termination of the bloom observed on the beginning of the cruise (11–12 May: 2.2 ± 1.0 µM C at 5 m, 4.0 ± 1.6 µM C at 30 m), then disap-peared (30–31 May: 2.0 ± 0.2 µM C at 5 m, 2.5 ± 0.6 µM C at 30 m). Autotrophic biomass ranged 8 to 28% of POC at 5 m, and 5 to 36% within the chloro-phyll maximum (30 m).
At 5 m, bacterial biomass exceeded autotrophic bio-mass until mid-May (average BB/AUTO ratio 1.4 ± 0.8 and 1.7 ± 0.5 for C1 and C2, respectively, Table 6). In the chlorophyll maximum layer, autotrophic biomass was higher than bacterial biomass when chl a peaked at the beginning of the cruise (BB/AUTO ratio 0.7 ± 0.2 during C1). After mid-May the ratios reached values close to 1 (27–28 May and 30–31 May) at both depths.
The sum of autotrophic biomass, BB and HNAN bio-mass was assumed to represent living POC. Non-living
POC (i.e. the difference between POC and living POC) represented in most cases more than 50% of POC. Sig-nificant (p < 0.01) long-term decrease was obtained for POC, non-living POC and percentage of non-living POC in POC at 5 m during the course of the study (Tables 4 & 6). At the chlorophyll peak, the same pat-tern was observed for all parameters except the latter, which showed no tendency.
Potential hydrolysis of non-living POC
In an attempt to point out the origin of bacterial car-bon resources, we estimated a flux of potential hydrol-ysis (PH) of particulate detritus by multiplying ecto-aminopeptidase turnover rates with the calculated non-living POC. The resulting flux ranged from 5 to 15 nmol C l–1h–1at 5 m and 2 to 39 nmol C l–1h–1at 30 m. There was a significant (p < 0.01) decrease of this flux with time at 5 m depth and in the chlorophyll peak during the course of the study.
DISCUSSION
Estimates of carbon from living biomass and detritus
Living biomass
To avoid problems related to carbon/chl a conver-sion factors for the autotrophic biomass estimate (Li et al. 1992, Buck et al. 1996), we took into account both phytoplankton species composition and photoacclimation. At the chlorophyll maximum depth, the peak of autotrophic biomass can be strongly dampened when converted in terms of carbon through a C/chl a conversion factor that considers photoacclimation (Taylor et al. 1997). We found that the C/chl a ratio between the 50% light level (5 m) and the 3% light level (30 m) dif-fered by a factor of 3.5. This value fell in the upper range of values reported by Geider et al. (1997) in their model at 15°C. Similarly, Li et al. (1992) and Campbell et al. (1994) used the factor 3 between the deep maximum chlorophyll layer and the surface mixed layer.
Heterotrophic living biomass was estimated as bacterial + heterotrophic nanoflagellate bio-masses. As ciliates represented only 3% of BB (6.3 mmol C m–2, Pérez et al. 2000), they were not taken into acount. The abundance/carbon conversion factor used in this study for bacteria (20 fg C cell–1) is sometimes considered to be overestimated in oligotrophic systems. However, at the time of sampling the system was not fully
Cycle BB/AUTO BB/POC NL POC/
ratio (%) POC (%) 5 m C1 11–12 May 1.4 (0.8) 19 (3) 62 (9) Means (SD) C2 14–15 May 1.7 (0.5) 20 (2) 65 (5) C3 27–28 May 0.8 (0.2) 20 (3) 53 (9) C4 30–37 May 1.1 (0.2) 23 (6) 53 (8) 30 m CI 11–12 May 0.7 (0.2) 19 (3) 52 (9) Means (SD) C2 14–15 Maya 1.2 (0.4) 14 (3) 72 (7) C3 27–28 May 1.0 (0.2) 23 (5) 53 (10) C4 30–37 May 1.1 (0.3) 25 (5) 47 (5)
Trend with time 5 m – – ns – –
Trend with time chl peakb ++ ++ ns
aAt 30 m depth during Cycle 2 (14–15 May) most of the samples
awere deeper than the chl peak which moved up to 20 m depth a(see text)
bFor 30 m depth only samples corresponding to the chl peak
bwere included in the regression (n = 21 to 41 according to the bparameter)
Table 6. Means (SD) during each 36 h diel cycle and trends in long-term time series. BB/AUTO: carbon ratio of bacterial biomass to autotrophs, BB/POC: bacterial biomass-C to POC percentage, NL POC/POC: non-living particulate organic carbon/POC percentage.
oligotrophic, bacterial numbers often exceeding 1 ×10⁶ bacteria ml–1. The appropriateness of the 20 fg C cell–1 factor was further confirmed by applying the carbon to volume relationship cited in Norland (1993) to our measured biovolumes (ranging from 0.08 to 0.11 µm3). Another potential problem might be an overestimation of bacterial abundance counted by epifluorescence microscopy due to interference with Prochlorococcus cells. However, during the cruise, the abundances of Prochlorococcus were estimated by Martin (1997) using flow cytometry, and ranged from 0.7 to 1 × 10⁴ cells ml–1, less than the error of bacterial counts.
Detrital carbon
Direct estimation of detrital organic fraction in POC, to our knowledge, has not yet been reported. Indirect estimates of particulate detritus have been tentatively depicted in an approach combining transmissiometry and cytometry (Chung et al. 1998, Claustre et al. 1999). Non-living organic detrital particles were estimated to account, on average, for 50% (20 to 60%) of the beam attenuation coefficient of particles in surface layers (0 to 200 m) of the equatorial Pacific (Chung et al. 1998) and 43 to 55% along 150° W in the Pacific Ocean (Claustre et al. 1999). But these methods, while promising because usable with a high frequency of sampling, are still unable to determine detrital carbon. Direct estimates of detrital particles have been made by counting DAPI-yellow particles (Mostajir et al. 1995), or some transparent exopolymer particles (Pas-sow & Alldredge 1994), but conversion of particle abundance in terms of carbon still suffers from prob-lems caused by conversion factors. Our approach con-sisted of an estimation of the detritic carbon by sub-tracting living POC from total POC. By considering assumptions and cautions used in the estimation of autotrophic and heterotrophic biomass, we found that in most cases more than half of the POC was in a non-living form. Extreme values ranged from 33 to 83%. Our values are thus of the same order as those of Cho & Azam (1990) for bulk seawater (the ocean’s euphotic zone), where bacterial biomass + autotrophic biomass comprised about 50% of the POC. Higher values have been described in a diatom-based marine snow, where non-living POC represented 87 to 99% of the total aggregate carbon (Simon et al. 1990).
Evolution of the trophic web
During the period of observation at the Dyfamed site, a transition from mesotrophy to oligotrophy was de-picted through the evolution of nutrients, primary
pro-duction and diagnostic pigments (Andersen & Prieur 2000, Vidussi et al. 2000). The culminating and de-clining phytoplankton bloom phases were observed (Andersen & Prieur 2000, Vidussi et al. 2000). Abun-dance and biomass of bacteria and cyanobacteria were within the upper range reported for comparable off-shore regions of the Mediterranean Sea (Fernandez et al. 1994, Van Wambeke et al. 1996, Yoro et al. 1997, Pedros-Alio et al. 1999) at the beginning of the study. While the numbers of bacteria HNAN and PNAN de-creased, the rather constant number of cyanobacteria depicted the same evolution of the system towards oligotrophy.
With the precautions taken to determine the auto-trophic and bacterial biomass, we observed few varia-tions in the relative contribuvaria-tions of these 2 biomasses. The ratio BB/AUTO ranged from 0.7 to 1.7, much lower than those (up to 6) reported by Cho & Azam (1990), who used a constant C/chl a ratio of 50. Autotrophic biomass exeeded bacterial biomass at the beginning of the cruise in the chl a peak, but not at 5 m. Then, the ratio evolved towards an equilibrium between het-erotrophic and autotrophic biomasses during the month. It seems, from our data and those of Buck et al. (1996), that high disequilibrium towards heterotrophy observed in oligotrophic environments could be due to an inappropriate choice of conversion factors as dis-cussed above. However, true oligotrophic conditions did not prevail at this time, which was depicted as pre-oligotrophy. The other conclusion drawn from our data is that ratios estimated only from surface values (inter-esting because they allow high frequency of sampling by continuous pumping during ship transects) are not necessarily representative of the other layers in the euphotic zone.
During the course of the study, the ratio of non-living POC to total POC significantly decreased with time in the surface but remained unchanged in the chl a peak. This suggests a different evolution in the functioning of the food web at these 2 layers. The non-living POC to total POC ratio has been shown to decrease with the number of trophic levels in top-down manipulated mesocosms (Christaki & Van Wambeke 1995), a lower ratio suggesting that non-living POC turns over more rapidly in complex food webs. It is thus likely that more oligotrophic conditions, appropriate for the develop-ment of more complex microbial food webs, induced an optimal use of available detrital particulate carbon in the surface.
Short-scale variability
During the cruise, bacterial properties were tightly coupled to autotrophs (Fig. 3) which have to modify
activity and physiology with light availability. Day/ night periodicity also was an important parameter reg-ulating zooplankton feeding activity on autotrophs (Goutx et al. 2000). In this context, we expected to observe changes in bacterial carbon sources and feed-ing strategies on the diel scale. Overall, diel variability of bacterial biomass (CV values ranging from 8 to 22%) was lower than that of bacterial production (CV ranging from 15 to 35%). The net trends of bacterial biomass over each 36 h diel study were much lower than time-integrated bacterial production rates, and sometimes negative, showing evidence of an active regulatory mechanism of bacterial populations. Prey-predator relationships might be involved. Indeed, het-erotrophic nanoflagellates were observed, although not systematically, in opposition of the phase with bac-teria (C2, 5 m). Conversely, predation of higher organ-isms like ciliates certainly accounted for the regulation of nanoflagellates numbers (Gonzalez et al. 1988, Perez et al. 2000).
Bacterial production was shown to be significantly higher at night only during C1 at 5 m depth, but nei-ther the day-night difference nor the occurrence of peaks at a particular time of the day were reproducible on all cycles studied. Nevertheless, the daily cycle of bacterial production should be expected with inte-grated values on the entire thickness of the chlorophyll peak. In the western Mediterranean, Gasol et al. (1998) observed an increase in bacterial production in the bulk deep chlorophyll maximum layer around noon, but this signal was not visible at the different discrete depths because of microscale vertical variability. How-ever, this daily variation in bacterial production was not observed at all the stations studied by these authors and was better reflected by data from the leucine method than by data from the thymidine method that we used. Moreover, in the eastern Medit-terranean (Zohary & Robarts 1992), thymidine incorpo-ration per cell exhibited a diel pattern when absolute rates did not.
Diurnal variations of protease activity have been described in lakes (Halemejko & Chrost 1986) and in seawater (Middelboe & Søndergaard 1993, Bochand-sky et al. 1995). On the contrary, in a long-term study in the Bay of Villefranche (northwestern Mediterranean), aminopeptidase activity did not show any clear trend related to daytime (Karner & Rassoulzadegan 1995), as was the case in our study. Bochandsky et al. (1995) and Christaki & Van Wambeke (1995) reported that zoo-plankton activity enhances ectoproteolytic activity in experiments. The influence of night migration was par-ticularly evidenced during C3; carnivorous zooplank-ton species migrated at night and were responsible for an episodic pulse of particulate lipids into sediment traps (Goutx et al. 2000). During C3, bacterial
produc-tion and ectoaminopeptidase activity were also high on both nights investigated.
Lack of diel periodicity for bacterial activities was also observed in marine systems influenced by tidal mixing, sediment resuspension or fronts (Christaki et al. 1996). The Dyfamed site is usually situated outside the influence of the coast and of the Ligurian Current. Andersen & Prieur (2000) demonstrated that horizontal advection in the euphotic zone remained weak during the period of the study but some vertical motion due to Ekman pumping existed. In addition, meteorological conditions (rain, cloudy days, winds) superimposed their effects on diel variability and consequently, prob-ably prevented us from obtaining reproducible diel patterns (Coffin et al. 1993).
Under those conditions, relating bacterial activities to evolution in their resources was not systematically possible on a short-time scale. For example, high fre-quency variability of DOC was observed at 5 and 30 m, which seems to indicate the transitory imbalances be-tween sources and fates of DOC (Carlson & Ducklow 1995). Possible sources of DOC are exudation from phytoplankton, release from zooplankton excretion (Jumars et al. 1989), and dissolution of particles through biotic and abiotic processes (Sempéré et al. 2000), whereas consumption needs to be attributed to bacterial assimilation followed by incorporation in the microbial loop or lost as CO2through respiration. Computation of bacterial growth efficiency (BGE) from bacterial production rates and periods of net DOC decrease, even with the more favourable thymidine conversion factor (2 × 10¹⁸cells mol–1), would lead to BGE as low as 0.1%. Even if exceptionally low values of BGE have been reported in oligotrophic areas (Cherrier et al. 1996), published values are in most cases 10 times higher than this value (del Giorgio & Cole 1998). By considering integrated DOC variations in order to avoid problems caused by short-term evolu-tion in vertical structures, Gasol et al. (1998) were suc-cessful in explaining decreases of DOC, but were not able to explain abrupt increases in DOC. Strong varia-tions on short-time scales have also been attributed, not only to biological activity, but also to horizontal advection and biological patchiness (Kepkay & Wells 1992). We also considered 1 additional hypothesis to explain DOC variations, i.e. the abiotic formation of exopolymeric particles as reported by Kepkay & John-son (1988), that would contribute to DOC removal together with bacterial production and respiration which often accompany such processes. Indeed, agre-gation/disagregation characterized small scale varia-tion in organic matter distribuvaria-tion in the water column at the time of sampling (Stemmann et al. 2000), and large agregates sedimentation was observed (Goutx et al. 2000).
Variations in some particular components of DOC, however, indicate a strong coupling with heterotrophic bacteria on a time scale of a few hours. For example, in surface waters during C1, the inverse correlation between dissolved triglycerides (TGd) and bacterial production (Fig. 9) revealed specific utilization of these compounds by bacteria. Simultaneous release of TGd hydrolysis products (free fatty acids) suggested that bacterial hydrolytic enzyme activity was responsible for TG degradation. Calculated TGd turnover rate (3.6 d–1) fell within the range reported for highly degradable molecules, indicating efficient substrate-bacterial affinity (Kiel & Kirchman 1999).
Partition between bulk DOC and non-living POC for bacterial resources
We also found in lipid indices, indications of evolu-tion in utilizaevolu-tion of DOC on longer scales. The selec-tive decrease in dissolved lipids compared to the bulk DOC pool observed in the chl a peak also sug-gests that bacteria utilized increased fractions of car-bon sources in the DOC. This was also seen through the free fatty acid fraction in DOC, which decreased from 1.08 to 0.27%. The lipolysis index, determined in the particulate fraction, demonstrates also to some extent these trends: It remained quite constant at 30 m depth (0.31–0.39), indicating that detrital POC had no time to accumulate, and thus to be modified in quality by bacterial degradation; thus the products of lipid hydrolysis (free fatty acids) stayed equili-brated compared to the substrates of hydrolysis (lipid esters). In contrast, at 5 m, the lipolysis index of POC increased (from 0.23–0.21 at C1 and C2 to 0.38–0.32 at C3 and C4), indicating an increasing hydrolysis of POC.
To confirm these hypotheses, we made a tentative carbon budget to examine the origin of bacterial car-bon resources. BP was calculated by using both the theoretical and empirical values which cover the best probable estimates of bacterial production calculated using thymidine technique in the western Mediter-ranean (see ‘Materials and methods’). BCD was cal-culated from BP assuming a 20% BGE, which is an average value in open-sea oligotrophic systems (Carl-son & Ducklow 1996, del Giorgio & Cole 1998) and in the Mediterranean (Zweifel et al. 1993, Sempéré et al. 1998). Carbon resources used by bacteria to satisfy BCD were partitioned between detrital POC and DOC, and we considered a third pool, ultralabile DOC. Ultra-labile DOC turns over on a time scale of few hours and was assumed to have no time to accumulate in bulk DOC. Typically, most of the molecules included in this ultralabile pool are sugars, amino acids (free and
com-bined) and lipid moieties, and most commonly, mole-cules issued from rapid hydrolysis. Taking into account data from Skoog et al. (1999), Kiel & Kirchman (1999) and references therein, we considered that up to 40% of the BCD should come from this ultralabile pool in oligotrophic environments (the sum of DFAA + DCAA 15 to 25%, glucose 5%, labile polysaccharides 10%, ultralabile lipids and other labile compounds 5%). Thus, to satisfy BCD, the remaining 60% must be met by semi-labile pools, i.e. bulk DOC or detrital POC.
Measuring detritus degradation rates remains diffi-cult. Most estimates are made on batch incubations (Jahnke & Craven 1995, Sempéré et al. 2000), which are time-consuming and thus inappropriate for high frequency studies. Fluorescent analogs like MCA-leu are easier to manipulate although their significance concerning fluxes remains unclear (Crottereau & Del-mas 1998, Jørgensen et al. 1999, Lamy et al. 1999). Nevertheless, Hoppe et al. (1993) calculated an in situ hydrolysis rate of particulate organic nitrogen (PON) by combining ectoaminopeptidase turnover rates determined with MCA-leu as substrate and concentra-tions of PON. Based on this model, our Hr values derived from MCA-leu hydrolysis (mean 0.038 ± 0.014 d–1, n = 78) fell in the lower range of turnover rates of the slowly degradable pool of POC calculated from experiments investigating the biodegradation of particles in the area (0.045 to 0.13 d–1, Sempéré et al. 2000). These values are also in the same order of mag-nitude as the lower range of the turnover rate (0.03 d–1) of a glucosylated protein (Keil & Kirchman 1999) assumed to represent a pool of ‘limited bioreactivity’. In order to explore the best probable estimates of hydrolysis fluxes, we additionally computed hydrolysis of detrital POC by using a constant value for the hydrolysis rate (0.13 d–1) which corresponded to the higher value cited for the semi-labile pool (Keil & Kirchman 1999, Sempéré et al. 2000). By applying both these constants (our Hr measured with MCA-leu and 0.13 d–1) to non-living POC, we assumed this pool as ‘semi-reactive’. Note that accordingly, the ultralabile pool was considered separately.
Both thymidine conversion factors and hydrolysis turnover rates influenced the carbon budget. We com-puted the 2 extremes: (1) BCD at a maximum with the higher thymidine conversion factor and PH at a mini-mum with the lower hydrolysis turnover rate, (2) BCD at a minimum with the lower thymidine conversion factor and PH at a maximum with the higher hydrolysis turnover rate. Using 2 ×10¹⁸cells mol–1as the thymi-dine conversion factor for bacterial production and using Hr computed from our MCA-hydrolysis rates, the potential hydrolysis of non-living POC (PH) was always lower than the BCD. The PH/BCD ratio ranged from 7 to 30%. PH/BCD ratio increased from 11 to 18%
in surface layers, and decreased from 30 to 7% in the chlorophyll peak. Assuming that the ultralabile pool fueled 40% of the BCD, the percentage of BCD coming from bulk DOC utilization amounted to 100% – 40% – (7 to 30%) = 30 to 53%. Thus in these cases bacteria also used the bulk DOC pool.
Using 0.8 ×10¹⁸cell mol–1as the thymidine conver-sion factor for bacterial production and using 0.13 d–1 as hydrolysis turnover rates, the PH/BCD ratio increased from 105 to 135% in surface layers, and decreased from 106 to 69% in the chlorophyll peak. Thus, in that case, in both layers the BCD is satisfied by both hydrolysis of the detrital pool and ultralabile pools, and some excess release is attained. This excess solubilization, calculated as PH – [BCD × (100% – 40%)] would range from 0.07 to 0.7 µM C d–1. These fluxes are consistent with the spring-summer accumu-lation of DOC in the surface layers (15 to 25 µM, Copin-Montégut & Avril 1993).
In both extreme cases studied, the changes in the way these different sources were shared evolved dur-ing the month and also differed between the 2 depths studied. The percentage coming from detrital POC hydrolysis increased in the surface layer and de-creased in the chlorophyll peak. If the BGE constant was set at another value, this would not modify the tendencies over the month, but would just decrease (or increase) relatively the contribution of detritus hy-drolysis to BCD and increase (or decrease) that of bulk DOC. However, the assumption that BGE is constant on a short time scale is not necessarily true (Middelboe & Søndergaard 1993, Zweifel et al. 1993), and it is also probable that the modifying trophic status over the month would also change the participation of ultrala-bile DOC to BCD. Nevertheless, the tendencies that we observed by examining how different sources used by bacteria are shared is consistent with the hypothe-sis that we made from variations in the lipolyhypothe-sis index, C-DL/DOC and TGd/DOC ratios in particulate and dissolved fractions.
In the water column, the surface layer and chloro-phyll peak appeared as independent zones in which bacteria adapted differently during transition to pre-oligotrophic conditions. In most cases more than half of the POC was in a non-living form. An examination of carbon budgets revealed that potential sources issued from POC hydrolysis are not negligible, and to some extent release of DOC from detritus could occur. The relative share of bulk DOC and detrital POC as carbon resources for bacteria could vary on a monthly scale. The most striking feature was that in the chlorophyll maximum, the potential availability of detrital POC sources decreased whereas it increased in the surface layer. We demonstrated that combining the ap-proaches used herein with correct conversion factors
for BP, BGE and appropriate markers to estimate poly-mers hydrolysis could help in determining the origin of food resources for heterotrophic bacteria, and the fate and turnover of detrital POC on short time scales.
Acknowledgements. This work was supported by
CNRS-INSU, Opération DYFAMED-DYNAPROC (JGOFS-France) and the European program CANIGO-MAST3-CT96-0060. We are grateful to our cruise and project leader V. Andersen. We thank L. Prieur, H. Claustre, J.-C. Marty and anonymous reviewers for useful discussions and comments that helped to improve this manuscript.
LITERATURE CITED
Andersen V, Prieur L (2000) One-month study in the open NW Mediterranean Sea (DYNAPROC experiment, May 1995): overview of hydrobiogeochemical structures and effects of wind events. Deep-Sea Res I 47:397–422
Benner R, Pakulski DJ, Matthew M, Hedges JI, Hatcher PG (1992) Bulk chemical characteristics of dissolved organic matter in the ocean. Science 55:1561–1564
Bligh EG, Dyer WJ (1959) A rapid method of total lipid extrac-tion and purificaextrac-tion. Can J Biochem Physiol 37:911–917 Bochdansky AB, Puskaric S, Herndl GJ (1995) Influence of zooplankton grazing on free dissolved enzymes in the sea. Mar Ecol Prog Ser 121:53–63
Børsheim KY, Bratbak G (1987) Cell volume to cell carbon conversion factors for a bacterivorous Monas sp. enriched
from seawater. Mar Ecol Prog Ser 36:171–175
Buck KR, Chavez FP, Campbell L (1996) Basin-wide distribu-tion of living carbon components and the inverted trophic pyramid of the central gyre of the North Atlantic Ocean, summer 1993. Aquat Microb Ecol 10:283–298
Campbell L, Nolla HA, Vaulot D (1994) The importance of
Prochlorococcus to community structure in the central
North Pacific Ocean. Limnol Oceanogr 39:954–961 Carlson CA, Ducklow HW (1995) Dissolved organic carbon in
the upper ocean of the central equatorial Pacific Ocean, 1992: daily and finescale vertical variations. Deep-Sea Res 42:639–656
Carlson CA, Ducklow HW (1996) Growth of bacterioplankton and consumption of dissolved organic carbon in the Sar-gasso Sea. Aquat Microb Ecol 10:69–85
Carlucci AF, Craven DB, Henrichs SM (1984) Diel production and microheterotrophic utilization of dissolved free amino acids in waters off southern California. Appl Environ Microbiol 48:165–170
Cauwet G, Miller A, Brasse S, Fengler G, Mantoura RFC, Spitzy A (1997) Dissolved and particulate organic carbon in the western Mediterranean Sea. Deep-Sea Res 44:769–779 Cherrier J, Bauer JE, Druffel ER (1996) Utilization and turnover of labile dissolved organic matter by bacterial heterotrophs in eastern North Pacific surface waters. Mar Ecol Prog Ser 139:267–279
Cho BC, Azam F (1990) Biogeochemical significance of bacte-rial biomass in the ocean’s euphotic zone. Mar Ecol Prog Ser 63:253–259
Christaki U, Van Wambeke F (1995) Simulated phytoplankton bloom input in top-down manipulated microcosms: com-parative effect of zooflagellates, ciliates and copepods. Aquat Microb Ecol 9:137–147