Publisher’s version / Version de l'éditeur:
Vous avez des questions? Nous pouvons vous aider. Pour communiquer directement avec un auteur, consultez la première page de la revue dans laquelle son article a été publié afin de trouver ses coordonnées. Si vous n’arrivez pas à les repérer, communiquez avec nous à PublicationsArchive-ArchivesPublications@nrc-cnrc.gc.ca.
Questions? Contact the NRC Publications Archive team at
PublicationsArchive-ArchivesPublications@nrc-cnrc.gc.ca. If you wish to email the authors directly, please see the first page of the publication for their contact information.
https://publications-cnrc.canada.ca/fra/droits
L’accès à ce site Web et l’utilisation de son contenu sont assujettis aux conditions présentées dans le site LISEZ CES CONDITIONS ATTENTIVEMENT AVANT D’UTILISER CE SITE WEB.
Internal Report (National Research Council of Canada. Division of Building
Research), 1971-10-01
READ THESE TERMS AND CONDITIONS CAREFULLY BEFORE USING THIS WEBSITE. https://nrc-publications.canada.ca/eng/copyright
NRC Publications Archive Record / Notice des Archives des publications du CNRC :
https://nrc-publications.canada.ca/eng/view/object/?id=52cf7954-e003-456f-b908-8d636cf7605a https://publications-cnrc.canada.ca/fra/voir/objet/?id=52cf7954-e003-456f-b908-8d636cf7605a
NRC Publications Archive
Archives des publications du CNRC
For the publisher’s version, please access the DOI link below./ Pour consulter la version de l’éditeur, utilisez le lien DOI ci-dessous.
https://doi.org/10.4224/20386767
Access and use of this website and the material on it are subject to the Terms and Conditions set forth at
Measurements of ground temperature frost heave and soil moisture in
normal and insulated pavements
N..".TIONAL RESEARCH COUNCIL OF CANADA DIVISION OF BUILDING RESEARCH
MEASUREMENTS OF GROUND TEMPERATURE, FROST HEAVE AND SOIL MOISTURE IN NORMAL AND INSULATED PAVEMENTS
by
Edward Penner
Internal Report No. 391 ,
of the
Division of Building Research
Ottawa October 1971
PREFACE
The us e of thermal insulation to prevent freezing of frost susceptible subgrades of streets and highways is now quite common. The Department of Transportation and Communications of Ontario
alone has used over 1, 000, 000 bd ft a year, over the past several
years, to remedy severe frost heaving in the existing highway system. Thermal protective covers are also presently being used for services such as sewers and watermains placed at depths less than the normal frost penetration depth.
The present report of an experimental roadway gives measurements of temperatures, frost heave and moisture content
below the insulated and the control section for three successive winters. Special emphasis was placed on the determination of the thermal
regime at the transition zone.
Such field results combined with the thermal values of the various materials in the pavement structure provide sufficient infor-mation for checking numerical methods for predicting thermal
patterns in frost heaving soils. It is hoped that this will also result in an improved design capability where insulation is used to modify the ground thermal regime.
Ottawa
October 1971
N. B. Hutcheon Director
MEASUREMENTS OF GROUND TEMPERATURE. FROST HEAVE AND SOIL MOISTURE
IN NORMAL AND INSULATED PAVEMENTS by
Edward Penner
An experimental road was constructed on the property of the National Research Council of Canada in Ottawa (Figure 1) during the summer of 1965 to study the temperature distribution under an
insulated pavement. the control area adjacent to it. and the transition
zone. Frost heave measurements of the road surface and soil
moisture measurements of the subgrade were also carried out. The
pavement design was the same as is used for service roads elsewhere
on the property. The study extended over a period of three successive
winters, 1965 -66, 1966 -67 and 1967 -68; measurements are to be resumed after a five-year lapse for one winter period to ascertain if any signifi-cant changes have occurred in the effectiveness and performance of the insulation.
There appears to be little information available on the thermal regime in the soil at the transition zone between insulated and
non-insulated areas. Special efforts were made, therefore, to obtain a
detailed thermal picture in this zone of special interest. Such information
will be particularly useful when designing thermal protective covers for services such as sewers and watermains that are placed at depths less than the normal frost penetration depth.
There are still difficulties in predicting frost penetration depths
accurately in soils where frost heaving is extensive. Leda clays fall
into this category because 4 to 5 inches of heave is not unusual. The
study includes information on the changing moisture regime, as well as
ice lensing and frost heave activity. Finally, the field data collected,
together with the information on the properties of materials should be useful for developing numerical methods for predicting thermal patterns in frost heaving soils.
The information contained in this report for the three consecutive winter periods (1965 -1968) is as follows:
(a) soil temperature measurements in both the insulated and
control sections and at the transition zone to a depth of 4 ft (measured daily at 0800 hrs) ;
2
-(b) average daily surface temperatures on the centreline of
the road for some periods;
(c) average daily air temperatures and freezing indices i
(d) weekly frost heave measurements along the centreline;
(e) monthly neutron moisture measurements giving moisture
density of the subgrade consisting of Leda clays (l. 2);
(f) depth of frost penetration as a function of time;
(g) thermal regime in the pavement along the road centreline
near date of maximum frost penetration;
(h) properties of the materials used in the road installation.
Previous publications by the Division of Building Research on the subject of insulated roads (4) (5) provide entry into the literature.
ROADWAY DESIGN, INSTRUMENTATION, MATERIALS AND
CONSTRUCTION
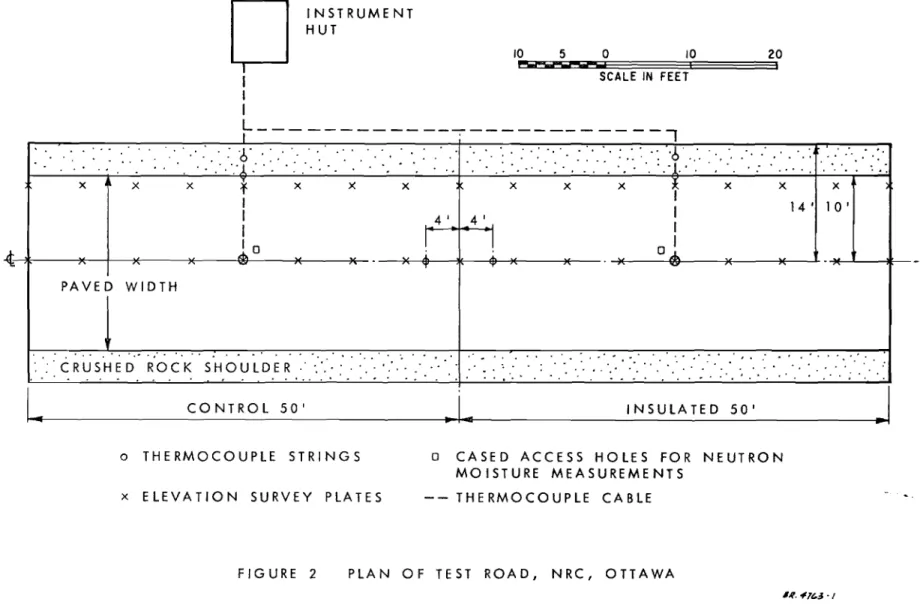
A plan of the 100 -ft long test road giving locations of thermo-couple strings. survey plates and access holes for neutron moisture
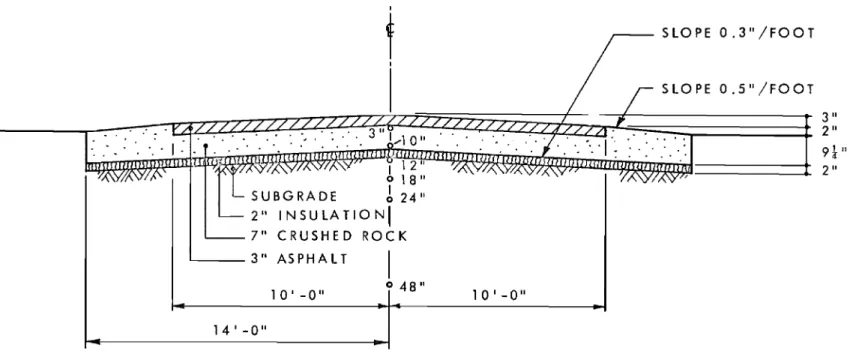
measurements is shown in Figure 2. Cross sections of the control
and insulated sections are shown in Figures 3 and 4.
The insulation used was extruded polystyrene boards, 2 ft x 4 ft
x 2 in. manufactured by Dow Chemical of Canada Limited and sold
under the trade name "Roofmate". It was placed on a fine -graded, hand -raked clay subgrade that provided uniform support for the boards which were staggered and pinned to the subg r ade with 6-in. long wooden dowels.
The subgrade soil is of marine origin usually referred to in the
literature as Leda clay. The moisture content, measured in the autumn
of 1965 to a depth of 6 ft, was about 40 per cent by dry weight.
The base course was end dumped on the insulation from trucks,
spread by hand and compacted with a vibratory roller compactor. A
sieve analysis of it is given in Table 1.
Temperatures were determined using 20 -gauge copper -c on st ant an
3
-to 1i-in. wooden dowels and installed in 6 -In, diameter augered holes. These were backfilled with the same soil and compacted to give good thermal contact. A l-ft length of thermocouple lead was wrapped
around the dowel in a groove at each measurement position to minimize conduction errors. For temperature measurements between the base course and insulation and between the asphaltic concrete and the base course, the leads were brought directly to the edge of the roadway at that level.
All thermocouple outputs were recorded daily at 0800 h r s , During the winters of 1966 -67 and 1967 -68 outputs were recorded at 6-hr intervals and were used to calculate average daily ground tempera-tures.
The area was cleared of snow to obtain frost penetration depths similar to snow-cleared roadways and highways in the Ottawa area.
Elevation surveys for frost heave measurements were carried out twice a month on metal reference markers embedded in the surface of the asphaltic concrete. The markers were located at 10-ft intervals along the centreline and at the edge of the paved surface. Surveys were referenced to a bench mark near the site.
Moisture densities in the subgrade were determined with a neutron moisture meter (1, 2) near the centre of each section on a monthly basis. The access holes for the neutron probe were cased with Ii-in. diameter aluminum tubes. The tubes were kept sealed
with rubber stoppers; a bag of desiccant was kept inside the tubes between readings to prevent moisture condensation on the inner walls.
RESULTS
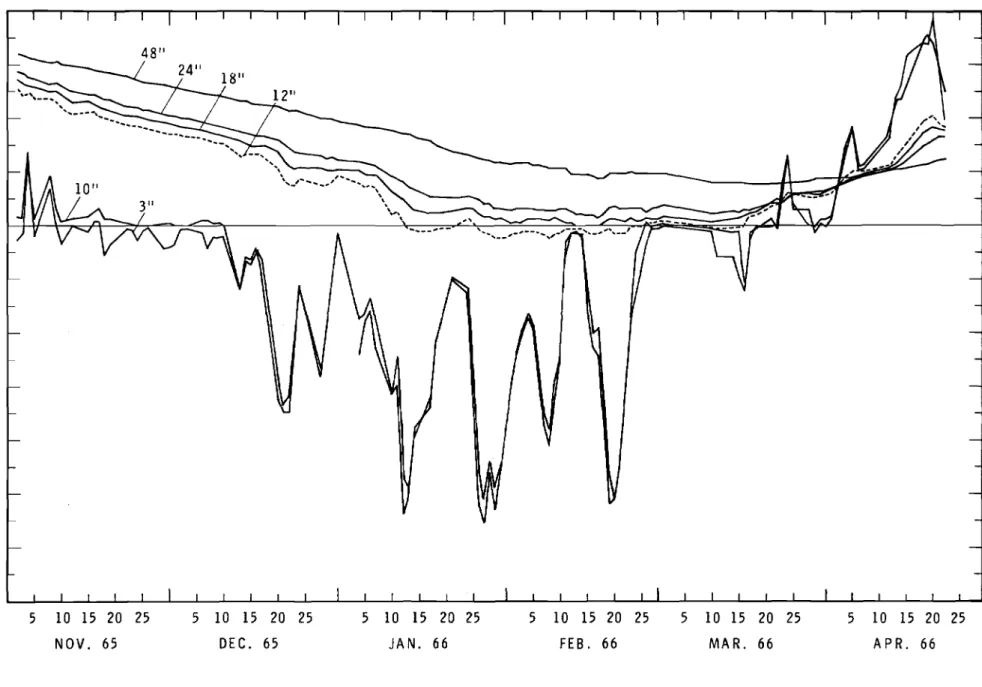
The temperatures measured daily at 0800 hrs are given in
Figures 5 (a and b), 6(a and b), and 7 (a and b) for the three successive winter periods. Temperatures at the 3 -, 12 -, 18 -, 24.- and 48 -in. depths
at the centre of the 50-ft control section are presented in Figures 5. 6 and 7 {a) Temperatures at the centre of the 50-ft insulated area are given in
Figures 5, 6 and 7(b). The thermocouples placed at a depth of 3 inches
were located just below the asphaltic concrete layer. In the insulated section the 10-in. deep thermocouple was located directly above the insulation
4
-Figures 8. 9 and 10 show the depth of the frost line with time on the road centreline for all three winters, based on the O°C isotherm.
Frost penetration depths are given for the centre of the control section, 4 ft inside the control section, the edge of the insulation, 4 ft inside the insulated section and for the centre of the insulated section. Table II gives the results of the maximum depth of frost penetration in convenient form for easy comparison. Table III shows the amount of frost penetra-tion protecpenetra-tion in terms of inches of soil per inch of insulapenetra-tion used.
Figures 11, 12 and 13 give the ground temperature pattern near the time of maximum frost penetration for the three winters. The figures show the temperature distribution along the centreline of the road for both the insulated and control section which are located adjacent to each other and in the contact zone between the two sections.
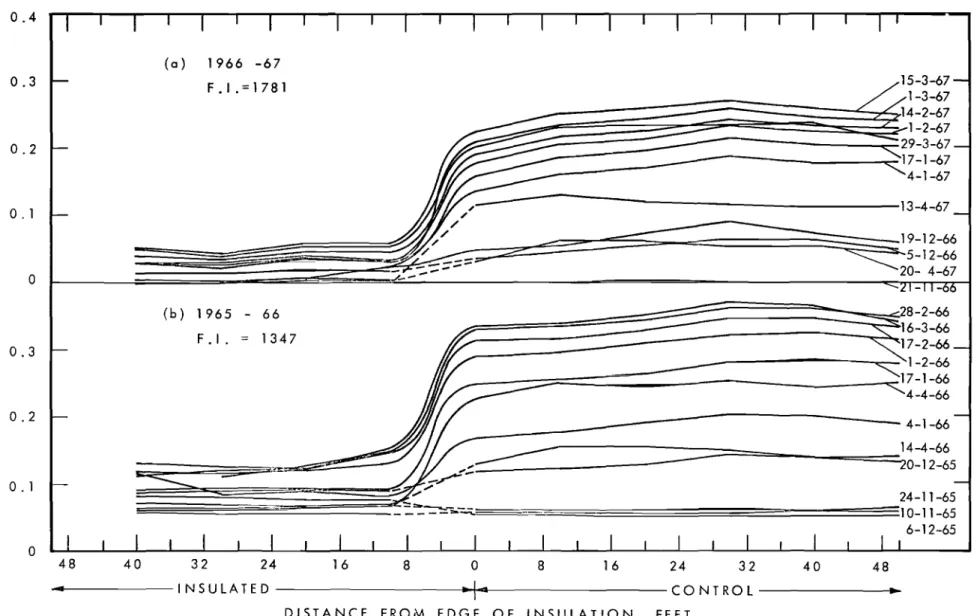
Figures 14 (a and b) and Figure 15 give the level survey measure-ments which were done twice a month along the centreline of the road to establish the heaving pattern. Surveys were continued during the thaw p e r iod when settlement occurred. For each winter period the base elevations were established in early autumn and the results plotted are the differences evident since the first survey.
Moisture density results are expressed in terms of pounds of water per cubic ft of soil. Figures 16 (a and b) and 17 (a and b) give the results of the moisture density measurements for the winters of
1966 -67 and 1967 -68. The measurement started at a depth of 6 in. below the base course and at various depth intervals down to 78 in. The
position of the frost line, based on the O°C isotherm, is given for the control area at the time the moisture density measurements were made. Maximum frost penetration depths are also shown on the graphs.
A photograph of the road surface (Figure 18) shows the abrupt change in elevation at the transition zone between insulation and control section. The thermal properties. densities and moisture condition of the various layers in the road profile are given in Table IV and in Figures
19 and 20.
Temperature measurements for the three winters are tabulated in
Appendices 1, 2 and 3. These include average daily air temperature. daily temperatures (0800 hrs) measured at the contact between the asphaltic concrete, and the base course (referred to in the Tables as surface temperatures) and average daily temperatures based on six hourly readings at contact between the asphaltic concrete and the base course. The average daily surface temperature data is not complete for all three winters. but it is cons idered that there is sufficient informa-tion to be useful for predicting thermal patterns in the ground using
5 -DISCUSSION OF RESULTS
The daily temperature measurements at various depths for the
three winter periods (Figures 5, 6 and 7) are given so that the
tempera-ture pattern for any particular day can be easily ascertained. This
information will be used to check ground temperature predictions at . various times using numerical methods.
The general pattern of frost depths established at all locations including the results below the edge of the insulation are the same for
the three years. Frost depths based on the O°C isotherms in the
central areas (Figures 8, 9 and 10), followed the same trend as the
freezing index i. e., the deepest frost penetration occurred during the
coldest winter. The depths of frost 4 ft inside the control area from
the edge of the insulation are quite sirn i.la r to the centre of the control s e ction (Table II). In the same way the frost depths at the centre of the insulation are quite similar to those 4 ft from the edge of the
insulation. It is noted however that the frost depths below the edge of
the insulation (and on centreline) are not the average depth of the control and insulated areas.
The temperature patterns in the control section. insulated
section and transition zone are given in Figures 11, 12 and 13 for the
day when the frost penetration was close to the maximum. As wo uld
be expected the temperatures in the base course above the insulation
are lower than in the base course of the control section. The results
also show that the edge effect of the temperature di st r ibutron is essentially dissipated at a distance of about 4 ft inside the insulated section.
The protection achieved in term s of the reduction in frost penetration per inch of insulation (Table III) appears to depend on the
severity of the winter. For the three years studied it appears that the
higher the freezing index the greater the apparent effectiveness. Heaving Conditions
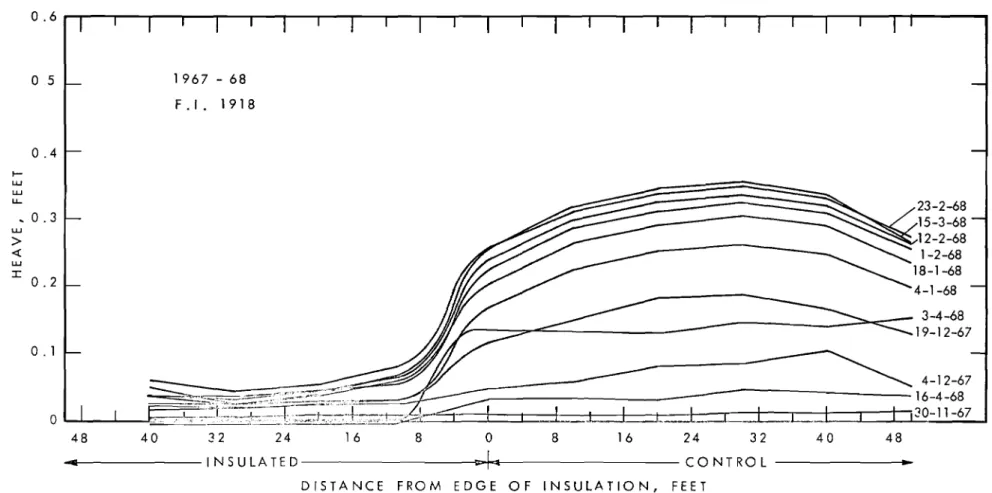
The heave patterns shown in Figures 14 (a and b) and 15 for the
three winters show the severity of frost heave in Leda clay. Some heave
was observed in the insulated area because 2 in. of insulation did not
provide complete frost protection for the subgrade. The water table
characteristically rises to the ground surface each fall, in the vicinity
of the test site and, because the surface of the pavement is level with the surrounding terrain. this resulted in a fully saturated base course.
6
-The heave movement measured each year in the insulated area prior to frost penetration into the subgrade is thought to result from the
expansion of the water in the base course on freezing. The maximum
heave in the control section (4. 2 in. ) occurred in the coldest winter
1967 -68 (Figure 15). The minimum heave did not occur during the
mildest winter; the reason for this is not known.
The abruptness of the heave at the edge of the insulation noted in Figures 14 and 15 would give roads undesirable riding qualities
(Figure 18). Where insulation is used as a remedial protective measure
along sections of the highway that heave excessively, the problem of edge effect may be prevented by gradually decreasing the insulation thickness at the ends of the insulated areas.
Moisture Densities
Moisture densities were determined using a neutron moisture
meter calibrated in Leda clay (2). There are difficulties, however, in
interpreting the results when used in a frost susceptible soil under
freezing conditions. Frost action tends to concentrate the moisture at
the freezing plane in the form of ice lenses. The influence of ice
lenses measured by the neutron moisture meter could be exaggerated if
the "centre of maximum activity" of the probe (1) coincided with the
lenses. Whether this occurred is not known. The technique was to
measure the moisture densities each month at the same depths in the
profile. Measurements were made at 6-In, intervals from 18 to 36 in.
and below this at 12-Ln, intervals down to 78 inches.
A further difficulty in interpreting the results arises because
the expan sion of water on freezing reduces the moisture density. In
the profiles studied the volume of water and solids are about equal at
the existing moisture contents. Since the volumetric expansion of water
on freezing is about 9 per cent this means the soil systems expanded
by about
4i
per cent if all the water was frozen. Hence simply freez mgthe system, without moisture redistribution, would cause the neutron moisture density measurements to decrease.
Despite such anticipated difficulties measurements were made in an attempt to pick up evidence of ice accumulation directly beneath
the insulation layer. As noted previously 2 in. of expanded polystyrene
was not sufficient to keep the frost out of the subgrade completely.
The measurements for the insulated section in the winter of 1966 -67 given in Figure 16 (a), show some moisture (ice) accumulation directly
below the insulation. The diameter of the sphere of soil from whi.ch
thermalized neutrons are back scattered to the detector is app r ox irnat e ly
7
-it depends somewhat on moisture content and dens-ity of the soil. The
increase at the top appears to be offset by some moisture reduction at 30, 36 and 48 in.
Figure l6(b) shows the moisture densities for the control section. While considerable heaving took place as the frost line penetrated the subgrade no obvious accumulation of moisture is evident from the neutron
measurements. The March measurements of moisture densities appear
somewhat lower from 30 to 60 in. and are thought to reflect the insitu expansion of the soil mass upon freezing which reduces the neutron
moisture readings. This interpretation is probably correct because
little heaving took place after the January moisture profile was taken. Figure l7(a) shows some accumulation beneath the insulation
for the winter of 1967 -68. Both the February and March moisture
density profiles gave similar results. The bulge in the moisture
density profile for February and March readings shown in Figure l7(b) is probably due to the expansion of the soil system on freezing when little heaving and ice lensing took place as for 1966 -67.
SUMMARY
1. Three years of field measurements have been presented on
the distribution of temperatures in an insulated pavement section and
an adjacent control area. The information on the thermal pattern
in the t r an sition or contact zone is considered to be particularly
useful as such information is needed when designing thermal protection for municipal services placed at shallow depths.
2. Heaving patterns along the centreline show an abrupt change in
elevation at the edge of the insulation. Special design techniques to avoid
this problem should be used involving a gradual reduction in the thickness of the insulation in steps at the ends of insulated sections.
3. Ice accumulation is observed to occur below the insulation if
frost penetration is permitted in frost susceptible soils.
4. Some difficulties result in the interpretation of moisture density
determination using the neutron moisture meter. The expansion of soil
on freezing reduces the readings; ice accumulations may increase readings. The influence on the moisture density readings is dependent also on the position of the centre of maximum activity of the neutron probe with respect to individual ice lenses.
5. Air and ground surface temperatures are provided in tabular
form (Appendices 1 - 3). This information together with the thermal
properties of the materials (Table IV) is required when using numerical methods for predicting the changing thermal patterns in the ground.
8
-REFERENCES
(1) Burn, K. N., Design and calibration of a neutron moisture
meter, American Society for Testing and Mat e r ial s , S TP 293, p. 1 4 - 26, (1 961).
(2) Burn, K. N., Calibration of a neutron moisture meter in
Leda clay. Canadian Geotechnical Journal, Vol. 1,
No.2, p. 94-103, (1964).
(3) Crawford, C. B., Quick Clays of Eastern Canada, Engineering
Geology, Vol. 2, No.4, p. 239 -265, (1968).
(4) Penner, E. Oo st e r baan , M. D. and Rodman, R. W., Performance
of city pavement structures containing foamed plastic insulation, Highway Research Board Bulletin, No. 128, p.l-17, (1966).
(5) Penner, E., Experimental pavement structures insulated
with polyurethane and extruded polystyrene foam.
International Conference on Low Temperature Science, Vol. 1, Part 2, p. 1311-1322, (1967).
TABLE I
SIEVE ANALYSIS OF THE CRUSHED ROCK BASE COURSE
Sieve No. Sieve Opening Per cent Pas sing
(USS) (rn, rn , ) 1/2 12.7 70. 3 4 4. 76 33.2 8 2.38 10 2.00 18. 9 20 0.84 12. 2 40 0.42 9. 4 60 0.25 7.8 100 0.149 6. 1 200 0.074 4. 6
TABLE II
DEPTH OF FROST PENETRATION (O°C) INTO
SUBGRADE ON ROAD CENTRELINE (IN.)
Insulated 4 ft inside Edge 4 ft
area insulated of inside Control
Year centre area Insulation control centre
1965-66 6.0 10.5 25.5 32.0 32.5
1966-67 7.5 8.0 29.0 37. 5 41. 0
1967 -68 5.0 9.0 30.0 37.5 42.5
TABLE III
FROST PENETRATION PROTECTION FROM INSULATION
Year 1965-66 1966-67 1967-68 15 year average (1953-68) Reduction in depth of freezing (in. of soil per in. of insulation)
13.2 16. 7 18.7 セZcfN
I.
degree-days 1347 1781 1981 1708TABLE IV
THERMAL PROPERTIES, DENSITIES AND
MOISTURE CONDITIONS OF THE VARIOUS LA YERS IN THE ROADWAY
Layer Thickness Water Content Density Y
d Thermal Condo
in. cm. per cent dry weight Ib/ft3 gr/cm3 BTU Mi.l.lic a lo rie s
ft hr 0F ern sec 'C ; 7.62 Asphalt 3
I
-
144 2.3 0.84 3. 46 1 Base Course 7 17.8 4. 0.2 1.25 2.0 0.97 4. 00(Frozen) (measured May 13/71)
2
Subgrade
(Unfrozen)
-
-
40.5 82.5 1. 36 0.50 2.06(Frozen)
-
-
see Fig. 19-
-
see Fig. 203 Insulation .2 5.08
-
-
-
0.021 0.0871 Dolomitic limestone crushed
.2 Undisturbed Leda clay
Figure I Placing insulation boards on Experimental Roadway at the National Research Council of Canada, Ottawa.
SCALE IN FEET 10 5 0 10 20 P S i i - - IIWI I , INSTRUMENT HUT I I IL ,
o
-4
:.: .' ". ::.',: .,'. ': ...:..'...··.1: '. :..'. ':' .... ': '... '.: '.:..
セ
. ..','
...:..': :....::.<'.'.:.:...:.' .:..:.,
セ
.
t .'.... ::...:::.'..'..:
...:
'-'. :
::
'. . ...
'..
x x x f x x x x x x1
x x x I I 14 ' 10' I 4' 4' II
!
I10
.i.01
T 'U' PAVED WIDTH': .: C
RU
S'H'E
セNLR'O
('K" S'H O·U 'L'DER
>... :' : >...: .... '::'" '...
.:'.
':;
:
.:'.
'..'::
... .....
:..
:
::.'
:
...
:
.....
;...
:
'.
:
. ::
..:
:
.'...;:
....
.' . . ' . . . . ' , . . . .L
CONTROL 50' ...ゥセ
INSULATED 50'J
o THERMOCOUPLE STRINGSx ELEVATION SURVEY PLATES
o CASED ACCESS HOLES FOR NEUTRON
MOISTURE MEASUREMENTS
- - THERMOCOUPLE CABLE
FIGURE 2 PLAN OF TEST ROAD, NRC, OTTAWA
3" A SPH A LT 1 0' - 0" 14'-0" I
f
I
048" 10'-0" SLOPE 0.3"/FOOT SLOPE 0.5 "/FOOT:, '.', .:-,1':'
セ セ
..:':":'.: ::. ':.
FIGURE 3 CROSS-SECTION OF CONTROL SECTION
SLOPE 0.3"/FOOT I
t
,I
I 12H o 18" SUBGRADE セ 24" 2" INS U LA T IONI
7" CRUSHED ROCK I 3" ASPHALT 0.5"/FOOT 14' -0" 10' -0" o 48" 10'-0"FIGURE 4 CROSS-SECTION OF INSULATED ROAD SECTION
16 12 8 4 0 u , L.LJ -4 c::: =:J
....
oct: セ -8 c, :E: L.LJ....
-12 - 16 - 20 - 24 - 28 5 10 15 20 25 5 10 15 20 25 NOV. 65 DEC. 65 5 10 15 20 25 JAN.66 5 10 15 20 25 FEB.66 5 10 15 20 25 MAR.66 5 10 15 20 25 APR. 66FIGURE 5a TEMPERATURES AT VARIOUS DEPTHS AT THE CENTRE OF CONTROL SECTION, WINTER PERIOD 1965-66
\ -...__... --\,..
,--
...BG⦅N⦅セGMMNLN⦅
..
-.
__..
_--...
_, ...--... --....⦅MMMMセ \ , ... \...._,...'ッセセセセセセ|
Nセ|
セ
I
4 8 12 -16 i i i i i i i i I i i i i i i I I I I i I I I i I I 16 i i i i i i I I I i I u LLJ- - 4 c:::: セ セ « セ -8 c.. :2: LLJ セ -12 - 20 - 24 - 28' I I I I I ' i ! , I I I ! ! I , , I J I , , " , ! I I , I I I ! ! I , 5 10 15 20 25 NOV. 65 5 10 15 20 25 DEC. 65 5 10 15 20 25 JAN. 66 5 10 15 20 25 FEB. 66 5 10 15 20 25 MAR. 66 5 10 15 20 25 APR. 66FIGURE 5b TEMPERATURES AT VARIOUS DEPTHS AT THE CENTRE OF INSULATED SECTION, WINTER PERIOD 1965-66
5 10 15 20 25 APR. 67 16 12 4 8 24" 18" 4 12"
o '
3" u : -l.J.J -4 0::: :::J f -<: 0::: -8 l.J.J 0.. セ l.J.J f --12 -16 - 20 - 24 - 28 5 10 15 20 25 5 10 15 20 25 5 10 15 20 25 5 10 15 20 25 5 10 15 20 25NOV. 66 DEC. 66 JAN. 67 FEB. 67 MAR. 67
FIGURE 6a TEMPERATURES AT VARIOUS DEPTHS AT THE CENTRE OF CONTROL SECTION, WINTER PERIOD 1966-67
16' i i i i i i i i i I i i i I i i i i I I i i i i i i i i i i i i i i i i ._-... --- ...
_---,-_
..._...---
...⦅セ..
-' \ \ '\---.
|NMMMMセMGMLMBB \ \ \..., \ ...._--\.-lll.\\ ... , ...., 3" TXBセ 24" 18" v; 211 ' - - ... , セ 1 ,-....,1 10" - 20 -16 4 12 -12 8 u I.Ll - 4 0::: =>
....
<l: セ -8 a.. :E I.Ll....
- 24 - 28' I I ! I I I ! J I ! I ! I I , , ! , I ! , ! , ! , , ! , , , I I ! I , , 5 10 15 20 25 NOV. 66 5 10 15 20 25 DEC. 66 5 10 15 20 25 JAN. 67 5 10 15 20 25 FEB. 67 5 10 15 20 25 MAR. 67 5 10 15 20 25 APR. 67.
FIGURE 6b TEMPERATURE AT VARIOUS DEPTHS AT THE CENTRE OF INSULATED SECTION, WINTER PERIOD 1966-67
5 10 IS 20 25 MAR. 68 5 10 IS 20 25 FEB. 68 5 10 IS 20 25 JAN. 68 16
セ
48" 12 8I--- 24" 18"Zセ
u 3" o.
-4 l.l.J 0:: => セ « 0:: -8 l.l.J c, :E l.l.J セ - 12 -16 - 20 - 24 - 28 5 10 15 20 25 5 10 IS 20 25 NOV. 67 DEC. 67 FIGURE 7aTEMPERATURES AT VARIOUS DEPTH AT THE CENTRE OF CONTROL SECTION, WINTER PERIOD 1967-68
- , < , _ " , ...
-
...
\..
"----'---'---,
セML セNNLM| '." ...,... "...'----
'...._, , 16l48'
12 24" 18" I 12" 8 4oセ
u 3" 0 I.LJ -4 c::: :::J I -<: c::: I.LJ -8 c, セ LI.I I --12 -16 - 20 - 24 - 28' I I I I I I I I I I I I I I I I I I I I I I I I I I I I I I 5 10 15 20 25 NOV. 67 5 10 15 20 25 DEC. 67 5 10 15 20 25 JAN. 68 5 10 15 20 25 FEB. 68 5 10 15 20 25 MAR. 68 FIGURE 7bTEMPERATURES AT VARIOUS DEPTHS AT THE CENTRE OF INSULATED SECTION, WINTER PERIOD 1967-68
F . I. 1347 50 CONTROL
J
V'l w 40 J: U Z J: 30 I - 0-w 0 r-V'l 0 tx: 20 u; 1 0 (4 ) (3) EDGE OF INSULAT 10N (2) 4' INSIDE|
G n セ u l a te d I \ I \セ
I. \ruU!rrtcr
(1) CENTRE OF INSULATION FIGURE 8DEPTH OF FROST LINE AT VARIOUS LOCATIONS AS GIVEN IN FIGURE FOR WINTER PERIOD 1965-66
F . I. 1781 (1) CENTRE OF INS U LA T ION 10 50 Vl 40 LU (4 ) 4' INS I DE I CONTROL u Z I 30 I -0... LU Cl I - (3 ) (2) 4' INS I DE Vl 0 INSULATION c::: 20 u. FIGURE 9
DEPTH OF FROST LINE AT VARIOUS LOCATIONS AS GIVEN IN FIGURE FOR WINTER PERIOD 1966-67
60 F.I. 1918 50 V) 40 w J: U Z J: 30 t-a.. w 0 t- (3 ) ED G E OF V'l INS U LA T ION 0 20 ae: LL 10 (4 ) (2) 4' INSIDE INSULA710N I--I \ I \
セHャIcentc{
OFn
--
INSULATIONo
APR. 5 15 25 5 15 25 5 15 25 5 15 25NOV. DEC. JAN.
- - - - 1 9 6 7
.1.
5 15 25 5 15 25
FEB. MAR
1968
-FIGURE 10
DEPTH OF FROST LINE AT VARIOUS LOCATIONS AS GIVEN IN FIGURE 1 FOR WINTER PERIOD 1967-68
0 IASPHALTIC 3 CRUSHED ROCK
.
10 12 I CLAY (LE DA) 20 30 Vl LU :r:: u Z 40 -:r:: I -c, LU 0 50 60 70 AT 3" 10" F.I. 1352 DEGREE-DAYS, of 748 DEGREE-DAYS, °C INSULA TE D -2 FROZEN NOT INSULATED AT 80 25 16 12 8 4o
4 8 1 2 16 25DISTANCE FROM EDGE OF INSULATION, FEET
FIGURE 11
ISOTHERMS NEAR TIME OF MAXIMUM FROST PENETRATION AT END OF INSULATED SECTION ON CENTRELINE OF SNOW CLEARED ROAD, FEBRUARY 8, 1966
ROAD SURFACE 0 3 IASPHALTIC CRUSHED 10
I,
ROCK N SU LA T , 0 N 12 CLAY (LEDA) I 30 VI 30 w :r:: U Z セ 40 :r:: l -c; w o 50 ONCRETE FROZEN -8 -7 -6 -5 -4 -3 -2 60 70 THERMOCOUPLES POSITIONED 3" 10" 12" 18" 24" AND 48" F.I. 1777 DEGREE-DAYS, of 989 DEGREE-DAYS, °C INSULATED THERMOCOUPLES LOCATED AT 3" 12" 18" 24" AND 48"NOT INS U LA TED
80
25 16 12 8 4
o
4 8 1 2 16 25DISTANCE FROM EDGE OF INSULATION, FEET
FIGURE 12
ISOTHERMS NEAR TIME OF MAXIMUM FROST PENETRATION AT END OF INSULATED SECTION ON
CENTRELINE OF SNOW CLEARED ROAD, MARCH 6, 1967
-170.3-/4-0 3
I
ASPHALTIC CRUSHED ROCKZセ
IINSULATIO CLAY (LEDA) 20I-
40% WATER BY WT.I
V> 30 w J: U Z - 40 -I ... 0-w Q 50 60 -7 -6 -5 -4 -3 -2 -13" 1 0 " 1 2 " 18" 2 4" AND 4 8 .. I GZZZセセセZセヲZヲエゥ THE RM0 C0 U P L ESP0 SIT ION E D A T
ᄋᄋZZZZセエイ 3" 1 2" 18 " 24." AND 4.8 " F.I. 1918 DEGREE-DAYS, of 1065 DEGREE-DAYS, °C 70
セ
I II
TO 50'-I
INS U LA TE D+
NOT INSULATED セoUPQ 80 «ClII
1
I
I
I
I
I
I
I
I
i
I 25 16 12 8 4 0 4- 8 12 16 25DISTANCE FROM EDGE OF INSULATION, FEET
FIGURE 13
ISOTHERMS NEAR TIME OF MAXIMUM FROST PENETRATION AT END OF INSULATED SECTION ON ;
CENTRELINE OF SNOW CLEARED ROAD, MARCH 1968
24-11-65 ᄋ]]]]M]]セZZZ]Z]]]]]]]セセセセセ]]]セ]]]]]]]]]]Q 0-11-65 6-12-65 ZZZ]]]]]]]ゥiNtNヲZNセ -セ
-0.1 0.2 0.4I
I I (0) 1966 -67o.
3 セ F . I .=
1 78 1 /"15 -3 -67 ,..1-3-67 ,14-2-67 1-2-67 O. 2 セ /セ セ c:::::::::29-3-67 17-1-67 4-1-67o .
1 • 11161' , 13-4-67セ
セセ
セ
-w / セ === _ _19-12-66::::
=
zgz==;i5L;
セZ
_
ZZZ[[[セ
d?セGUMQRMVV
o
:;;:----
-_---
20- 4-67 w>
セI
(b) 1965 - 66 :r: F.I. = 1347 0.3o
48 40 I'"" l l J N Il<lJI セ 40 48 32 24 16 8 0 8 16 24 32 .. INSULATED セico u r ao
i IDISTANCE FROM EDGE OF INSULATION, FEET
FIGURE 14 FROST HEAVE ON ROAD CENTRELINE OF INSULATED SECTION AND ADJACENT CONTROL
-It-0.6" , i i i , i , , , , , , , i i ' , , , i i i i i i ,
o
5 0.4 セ W W U. _ 0 .3 w > « w :r: 0.2 0.1 1967-68 F . I. 1918 23-2-68 15-3-68 12-2-68 1-2-68 18-1-68 4-1-68 :> 3-4-68 / ::;::>...-::=
---
c::::::::::::
19-12-6 7 48..
FIGURE 15 FROST HEAVE ON ROAD CENTRELINE OF INSULATED SECTION AND ADJACENT CONTROL
O...NNNNNLNMNNNNNLNNMNNNLNNNNMMイMMMLイMNNNNLNセセセセMイMMNNNNLNMNNNNNLNNMNLNNNNMMイMMMLMMイMMイMMNLMセ
3t----...;....---"'---...;..---....;....---'"---...:.----t
CRUSHED ROCK INSULATION
MAXIMUM FROST DEPTH MARCH 6, 1967
NOTE: PERIOD OF SUBGRADE F REEZ I N G FEB RU A RY 6, 1 96 7
TO MARCH 3, 1967
APPROXIMATE SAMPLING VOLUME FOR EACH
POINT SUBGRADE \ \ " , - -
'\:--,
<, :N'
i ""
"
....'.
' \\\ ,\-', \ <, \.'\'. \-.
|セNセ
-,\
"
t
\ i, ----AUGUST 19, 1966 \1\
\:
.,
._._. OCTOBER 13, 1966 |セN \ '. \,
---NOVEMBER 18,1966 , .... \ セ , ' . \ I ... DECEMBER 14, 1966 ,"\ : - JANUARY 11, 1967I
:\l, '. \\I
t: \\
- - MARCH 3, 1967 : -v 72 12 t - - - ' 7 " " ? " ' " ' l o o : - - - t 24 v; w :c 36 u Z :c 48 ... 0-W 0 60 46 44 42 34 36 38 40 MOISTURE DENSITY, LB/FT3 32 30 84 '--...L._...J..._..I...---L_..._..J.-_1---.l._-L..._..I...---L_..._..J.-_l---.l._...J..._.L...--...I 28ASPHALT CRUSHED ROCK 12
l - - - t
24 VI w ::I: 36 u Z ::I: I - 48 0-w 0 60 72 SUBGRADE ---- AUGUST 19, 1966 --- OCTOBER 13, 1966 - - - NOVEMBER 18, 1966 DECEMBER 15, 1966 JANUARY 11, 1967 MARCH 3, 1967 FROST DEPTH DEC. 15, 1966 JAN. 11, 1967 MAX_ MAR. 20, 1967 46 44 42 40 38 36 34 32 30 84 1ooo-....I._-'--_ol-..---l._--l-_...1.-_'--...1.._-'--_ol-..--'_---'-_...1.----''--...1.._-'--_ol-..---1 28 MOISTURE DENSITY, LB/FT3o
3 ASPHALT
CRUSHED ROCK INS U LA T ION
24 V) UJ ::I: 36
u
Z ::I: 48 l -c, UJ NOTE : 0 60 ---- NOVEMBER 3D, 1967 ._._, JANUARY 5, 1968 --- FEBRUARY 9, 1968 - - MARCH 19, 1968 ... APRIL 3D, 1968 '0. I .."..' • __セGGGGGGGGO セ .J,..'-' -セNMiMMMMMZNZNN ----_---;::r -,1..._--...
\ -,':--.
<.セ
,
.... \ <, A PPRO X I MAT E SAM P LIN G ... ", \)
GLLセ セ I VOL U M E FOR EA CH POI N T
• " I
'>!/
'\::Z,
t" PER/OD OF SUBGRADE"7"
FREEZ I N G JAN UA RY 1 0, 1YVXセG
!
TO MARCH 18, 1968 '/!
\.
l,\
GセB|
_セ '\ Nセセ\
",,-
\.
GLLセ|L \MAXIMUM FROST DEPTH
FEBRUARY 25, 1968 1 2 72 84 24 26 28 30 32 34 36 38 40 42 MOISTURE DENSITY, LB/FT3
FIGURE 170 MOISTURE DENSITY PROFILE IN SUBGRADE, 1967-1968
I
I
II
II
II
ASPHALT II
I I II
I CRUSHED ROCK FRO ST DEPT H S,
セ| !-,
,
I ' I ...-. \-,
セイエBB I--,
-JANUARY 5 , 1968 I / ; ..., / / ' : I I セW i ' |セ . / ---- NOVEMBER 30, 1967 \'.
/
セGヲ
I-- ( I : ._._. JANUARY 5, 1968 -I Iセ|
- - - FEBRUARY 9, 1968 , I '. \ FEBRUARY 9, 1968 Ii
;\ \
..
\ - - MARCH 19, 1968 ' : \ \ II : ' \ I - セ セ \,
... APRIL 30, 1968 -MAX IMUM"
'.
'.
,
""
....
'.,
MARCH 1 8, 1968"'<:'" ,',
"
-,,",
"
.-,
10-1 '..
セ)
-\ 1.
i
\
"'.
./
\ 1\
7-..
10-,
.I' ..
-'\:"
<,,\,'
'.'....
""
'.'.
II
II
II
II
II
II
II
II
Io
1 2 24 VI UJ I 36 u Z I 48 l -n.. w 0 60 72 84 24 26 28 30 32 34 36 MOISTURE DENSITY, LB/FT3 38 40 42Figure 18 Heave Difference at end of insulated section, NRC Experimental Roadway, Ottawa.
100 __- - ---..,..---r----r----'r----,----'T""'---, 90 -0.001256747638 T5- 0 . 0 5 6 4 1 18 8 0 1 7 T4 -1.004638235 T3 -8.981458608T2 -41.34711006 T - 0.2285050862 w 20 30 80 T (- °C ) OfcWATER FROZEN 70 0 0 1 32.1 2 55.1 Z 3 65.4 u..J 4 72.3 N 60 0 5 76.5 a::. 6 78.2 u, 7 79.8 a::. 8 80.2 u..J 50 ... 9 80.7
«
セ 10 81 .2 1 1 81 .5 u, 12 81 .7 0 40 1 3 82.0 >R 0 IIs
10 16 14 12 1 0 8 6 4 2OL-_ _....I..- _ _...l-_ _--L L....-_ _..L-_ _...I..._ _--l. _
o
TEMPERATURE, _DC
FIGURE 19
EST I MAT E D PER C E N T 0 F W ATE Reo N TEN T FRO Z EI'J A S A FUN C T I0 セGj
OF TEMPERATURE - SUBGRADE OF INSULATED ROAD M20
4 u c. :'E u u w V ) <, 3 T(-O() K -J
«
u 0 2 06 :'E 1 2.57 2 2.85>-
3 3.03 I -4 3.13>
5 3.20 I -6 3.23 u :::> 2 7 3.25 0 8 3.27 Z 9 3.28 0 1 0 3.29 u 11 3.30 -J«
:'E K 2.655(_T)°·1012 c:r: w :r: I -AVE. M( % DRY WT 40.5セ AVE. DENSITY Ib/ft 3 82.5
% (LAY SIZE 70.0
° °
2 4 6 8 10 12 14 16TEMPERATURE, _O(
FIGURE 20
EST I MATE D C HAN GEl NTH E RMAL ( 0N D U
c
T I V I T Y A S A F U t'Jc
T I0 f'1OF TEMPERATURE - SUBGRADE OF INSULATED ROAD M20
paセ・ 1 appeセdix 1 MEASURED イeセperature (OC) NOV. 65/66 DEC. 65/66 0.5 I -0.,< I
AV. DAILY AVERAGE DAILY 8 A.M. AV.DAILY AVERAGE DAILY
I
8 A.M.DAY AIR TDiP. SURFACE TEMP. SURFACE teセipN AIR TDfP. SURFACE 7:::<? -.- ?-?_-\CE: TE:-fP. INSULATED CONTROL INSULATED COXTROL INSULATED coセZZZrol ihBsセャNNated r CO:-:rROL
AREA AREA AREA AREA AREA ARr::A AREA
I
AREA1 +1.4 +1.7 +2.5 -0.8 -1.4 -0.7 2 -4.2 -1.1 -0.4 +0.8 -0.3 -0.1 3 +6.4 -0.6 -0.1 +0.6 -0.2 -0.1 4 +3.3 +5.1 +5.6 +3.3
-
-5 +1.9 -0.8 -0.5 -2.2 - -6 +5.0-
-
-4.7 -0.5 -0.3 7 +3.1-
-
-6.4 -1. 7 -0.8 8 +1.4 +2.8 +3.2 -4.7 -0.9 -0.5 9 -1.7 +0.2 +1. 0 -0.6 -0.9 -0.5 10 -3.6 -1.4 -0.7 -1.1 -0.8 -0.5 11 +0.3-
-
-
-9.1-
-12 +3.6 0 +1. 6 -7.8 - -13 +5.8-
- -4.4 -4.7 -1. 8 14 -0.3-
- -
-3.6 -2.6 -1.2 15 -2.2 -0.6 -0.5 -1.7 -2.9 -1.5 16 0 +0.3 +0.8 -0.6 -1.3 -0.5 17 -2.2 +0.3 +0.7 -5.6 -3.5 -2.6 18 -4.7 -2.3 -2.3 -4.2 - -19 -2.2 -1.4 -1.4 -13.6 - -20 -3.3-
-
-15.3 -12.9 8.6 -21 -1. 9-
-
-9.7 -13.9 -6.0 22 -1.4 -0.2 -0.2 -5.3 -13.9 -7.6 23 -0.3 -0.3 -0.2 -1. 4 -8.1 -3.G 24 -1.7 -1. 2 -0.6 +3.9 -4.4 c , -...:....-+ 25 -0.6 -0.4 -0.2 -2.2-
-26 +0.8 -0.1 0 -14.4-
-27 0-
- -14.4-
-28 -1.1-
-
-8.3 -11.0 -7.3 29 -3.1 -1.7 -1.1 -0.8 -7.7 ' r -"-;" .l..;-30 -1.9 -1. 6 -1.1 +0.8 -3.3 -1.5 11 --
-
+'i _RAPPENDIX 1
MEASURED TEMPERATURE (OC)
jaセN 1965/66 FEB. 1965/66
pa:;e 2
AV.DAILY AVERAGE DAILY 8 A.M. !f AV.DAILY AVERAGE DAILY 8 A.セセ
DAY AIR TD1P. SURFACE TDlP. SURFACE TE!'lP.
Ii
AIR TEMP. SURFACE TEHP. Sl:R:'ACr: E::.
II};SULATED CO};TROL INSULATED coセtrol I INSULATED ICO};TROL ItセMエZイG Mセ J.; ?-OL
I
t-a
セ ⦅セNZGMjAREA AREA AREA AREA AREA AREA ,AREA I NセNZZN r....
1 +1. 9
-
-
-
-
-7.2-
-
-1l . .:3 ; -9.3 2 -5.8-
-
-
-
-5.8-
-
-9.4 -7. S 3 -2.8-
-3.6-
-
-7.8 -7.0-
-4 -6.1-
-
-9.5 -7.2 -4.7-
-
-6.8 -6.5 5 -3.3-
-
-7.0 -4.6 -8.9-
-
-7.6 - .,i .-to, 6 -5.3-
-
-6.3 -5.0 -13.9-
-
-11.6 ; -1 C).5 7 -14.2-
-
-9.2 -7.3 -15.0-
-
-14.91-
1 2 .3 8 -17.2-
-
-
-
-9.2-
-
-16.4 -12.6 9 -16.1-
-
-
-
-7.5-
-
- l l . S -8.8 10 -6.1-
-
-12.3 -9.0 -1.1-
-
-9.7 -8.1 I I -16.7-
-
-1l.8 -8.9 +3.1-
-
-1.1 -1.3 12 -20.0-
--
-21. 5 -16.7 +1.1 .-
-
-0.5 -2.9 13 -16.1-
-20.2 -15.1 -1.7.-
-
-0.5 I -2.5-
I 14 -13.6-
-
-15.8 -11.1 -3.1-
-
-0.6 -2.1 15 -20.8-
-
-
-
-9.7-
-
-6.9 -7.9 16 -13.6-
-
-
-
-8.9-
-
-9.0 -7.3 17 -9.4-
-
-12.9 -10.4 -11.1-
-
-9.8 -9.4 18 -6.9-
-
-8.7 -7.8 -17.2-
-
-14.1 -10.6 19 -4.2-
-
-
-
-24.4-
-
-20.8 MZGセNo 20 -1. 9 --
-
-
-20.8-
-
-20.4 -2.2.l 21 -2.2-
-
-4.0 -4.1 -14.4-
-
-17.5 -1.2.7 22 -7.2-
-
-
-
-7.8-
-
-11.8 -3.7 23 -5.8-
-
-
-
-5.6-
-
-6.9 -5. 1 24 -5.0-
-
-5.0 -4.3 -8.1-
-
-2.0I
+1. 3 25 -17.8-
-
-13.5 -10.8 -5.0-
-
+0.6 -;-.2.1 26 -17.2-
-
-20.6 -16.8 -0.6-
-
+0.3 j +2.6 27 -20.3-
-
-22.1 -17.4 -1. 9-
-
-0.2 i +1.0 28 -19.7-
-
-18.3 -12.7 -2.5-
-
-0.2 -0.5 29 -18.1-
-
-21.1 -17.0-
-
-
-
-30 -14.4-
-
-18.2 -14.3-
-
-
- -31 -10.0-
-
-15.0 -10.6-
-
-
-
-MARCH 65/66
APPENDIX 1
MEASURED TEMPERATURE (OC)
page 3
APRIL 65/66
AV. DAILY AVERAGE DAILY 8 A.M. II AV.DAILY AVERAGE DAILY 8 A.M.
DAY AIR TOlP. Sl:RFACE TEMP. SURFACE TEMP. I AIR TEMP. SURFACE TEMP. SURFACE AGeセセ_
ESULATED CONTROL INSULATED CONTROL INSULATED CONTROL INSULATED: COXI;\OL
AREA AREA AREA AREA AREA AREA AREA ..
-
LセエGB. .(NZ|N⦅セ 1 +1.7 0 0 -0.6 +0.4 +0.5 2 +1.9
-
-
+1.7 - -3 +0.6-
-
+1. 9 - -4 +0.6-
-
+0.8 +6.4 +3.8 5 +0.6-
-
+2.8 +7.4 +4.7 6 +1.4-
-
+1. 9 +4.3 +3.6 7 -5.6-
-
+3.1 +4.5 +3.2 8 -6.9-
- +1.7 - -9 -4.2-
- +3.1-
-10 +0.6 -0.4 -0.1 +3.6-
-11 -7.2 -0.23 -0.8 +3.1-
-12 -5.0-
-
+6.1 +6.9 +5.3 13 -1.1-
-
+6.4 +9.4 +6.9 14 -1.7 -2.3 -0.5 +8.3 +10.4 +8.5 15 -6.9 -3.8 -1. 7 +6.9 +12.6 +10.5 16 -3.1 -4.9 -0.6 +6.7 - -17 -2.8 -0.9 -0.1 +7.2 - -18 +7.2 -0.1 -0.1 +7.5 +13.7 +11.2 19 +7.5-
-
+9.7 +14.2 +12.2 20 +1.7-
-
+9.7 +13.5 +11.j . 21 -0.3 -0.1 -0.1 +13 .1 +12.0 +11.7 22 +0.8 0 +0.1 +6.7 +10.0 +10.4 23 +5.6 +2.9 +2.3 +6.4 - -24 +5.0 +5.3 +3.4 +9.4-
-25 -1.1 +1.2 +0.4 +10.6-
-26 -6.4-
-
+0.3 - -27 -10.3 --
+0.8-
-28 -7.8 -1.2 -1.1 +1. 4-
-29 -3.3 -0.5 -0.3 +7.5-
-30 +0.6 +0.1 +G.2 +5.8-
-31 0 0 +0.3-
-
-page 1
APPEXDIX 2
MEASURED teセperature (Oe)
NOV. 1966/67 DEC. 1966/67
AV.DAILY AVERAGE DAILY 8 A.M. AV.DAILY AVERAGE DAILY 8 A.M.
DAY AIR TEMP. SeRFAGE TEMP. SURFACE teセpN AIR teセpN SURFACE teセpN SURFACE TEMP.
INSULATED CONTROL INSULATED CONTROL INSULATED coセ[セrol INSULATED coセtrol
AREA AREA AREA AREA AREA AREA AREA AREA
1 +4.7 - - - - -5.0 -0.23 +0.16 +0.3 +0.7 2 +11.1 - - - - -9.4 -1.87 -1.46 -2.2 -1.6 3 +1l.3 - - - - -15.0 -4.84 -4.50 -4.8 -4.7 4 +1.4 - - - - -12.8 -10.05 -6.18 -11.4 -7.8 5 +0.3 - - - - -8.3 - - -12.3 -7.2 6 -0.8 - - - - -2.5 - - - -7 +3.3 - - - - -0.3 - - - -8 +7.8 - - - - 3 .1 - - - -9 +10.3 - - - - 5.3 - - - -10 +12 . 5 - - - - 2 . 5 - - - -II +5.3 - - - - -4 .4 - - - -1 2 +4 . 7 - - - 9 . 7 - - - -13 -2.5 - - - - -5.6 - - -3.7 -3.9 14 -0.6 - - -1.4 +0.4 -3.9 -3.18 -2.53 -4.6 -3.8 15 -1.7 - - -1.5 -1.3 -5.6 -3.03 -2.43 -5.2 _L.::" 16 -3.1 - - -1.2 -0.4 -2.2 -3.16 -1.90 -4.2 -2.6 17 -1.1 - - -0.9 0 2.5 -0.54 -0.10 -0.8 -0.3 18 -1.7 - - -0.5 +0.2 -3.6 -1.43 -1.07 -0.2 0 19 -4.4 - - -3.2 -2.5 -13.9 -9.02 -6.71 -10.9 -3.7 20 -5.0 - - -4.6 -3.8 -10.6 -10.88 -6.31 -12.1 -7.5 21 -3.9 - - -5.5 -4.6 -7.2 -8.46 -3.48 -8.8 -3.3 22 -0.6 -2.08 -1.79 -5.5 -4.1 -5.6 -6.50 -2.55 -7.2 -3.0 23 +1.9 -1.81 -0.75 -3.2 -2.4 -16.4 -11.28 -7.16 -12.5 -8.2 24 セNo +0.24 +1.04 +0.1 +0.4 -13.3 -11.55 -6.47 -12.6 -7.2 25 セNU +2.98 +3.86 +1.9 +3.2 -10.6 -10.27 -4.84 -10.5 -5.2 26 +3.6 +4.37 +3.96 +4.5 +3.9 -9.4 -8.99 -3.16 -9.2 -3.2 27 セNW +3.85 +3.75 +2.7 +2.7 -12.5 -8.14 -2.53 -8.2 -2.6 28 +8.9 +6.20 +5.92 +5.3 +5.2 -12.5 -8.75 -4.55 -8.2 -2.9 29 +6.1 +7.45
I
+6.74 +7.9 +7.2 -10.3 -9.76 -5.31 -9.9 -5.6 30 +3.6 +3.78 +3.73 +2.4 KセNS -11.7 -9.76 -6.55 -9.4 1 -6.3 31 - - - -12.2 -13.72 -8.62 -14.6 -10.1p.:lgc 2
2
APP EN:..:..:D=-I=..;X'-'--__ MEASURED TEMPERATURE (OC)
JAN. 1966/67 FEB. 1966/67
I
avNdaiセy AVERAGE DAILY 8 A.M. AV.DAlLY AVERAGE DAILY 8 aNセNDAY i AIR TLI? SeRFACE TH1P. SURFACE TEMP. AIR TEMP. SURFACE TEMP. sイrZNセNce WeZセpN
I
Il\SULATEDAREA coセtrol AREA INSULATEDAREA CONTROLAREA INSULATEDAREAI
coセZtrol AREA II:\SCLATEDAREA I CO:;E.OLNセZ| E_t.61 -8.3 -11.25 -5.36 -11.5 -5.3 -4.4 -8.86 -6.02 -9.6 -6.7 2 -1.9 -9.33 -2.55 -9.6 -3.6 -7.2 -7.11 -5.23 -6.6 -4.5 3 -2.2 -7.32 -2.40 -8.1 -2.6 -18.3 -14.40 -11.98 -15.5 -13.6 4 0 -4.76 -1. 85 -5.1 -2.0 -9.7 -14.82 -10.77 -16.3 -12.4 5 -3.6 -4.55 -3.18 -4.1 -2.8 -7.5 -10.64 -6.95 -11.1 -7.2 6 -18.1 -14.10 -10.91 -14.6 -12.3 -22.8 -12.62 -11 .10 -11.7 -11.3 7 -11.1 -15.93 -10.80 -16.1 -11.5 -20.3 -18.92 -14.96 -19.9 -16.1 8 -6.9 -11.95 -6.34 -12.7 -6.8 -17.5 -20.50 -15.12 -22.7 -17.3 9 -6.9 -8.35 -5.52 -8.9 -6.1 -6.1 -13.94 -10.11 -14.3 -10.4 10 -6.7 -7.13 -4.78 -7.8 -5.4 -5.3 -10.29 -7.82 -12.1 -9.5 11 -6.4 -6.71 -4.13 -6.3 -4.3 -8.6 -6.82 -6.47 -4.3 -3.9 12 -7.8 -10.61 --6.84 -11.1 -7.7 -28.3 -20.99 -17.53 -22.1 -19.3 13 +1.4 -5.84 -2.74 -6.9 -4.2 -25.3 -25.01 -18.89 -26.3 -20.9 14 -0.8 -3.81 -1.95 -4.8 -3.5 -13.3 -20.06 -14.74 -21.3 -15.7 15 -6.4 -2.73 -2.03 -2.3 -1.5 -6.7 -12.33 -9.36 -13.8 -10.4 16 -11.4 -5.73 -4.71 -6.4 -5.5 -14.4 -9.39 -8.06 -9.4 -7.9 17 -5.6 -6.08 -4.36 -6.6 -4.6 -20.8 -13.24 -13.16 -13.3 -14.2 18 -23.9 -11.74 -10.56 -10.2 -10.6 -21. 4 -19.05 -15.88 -20.1 -17.3 19 -19.2 -19.19 -13.48 -20.6 -15.5 -19.2 -20.17 -15.69 -21.7 -17.4 20 -12.5 -15.77 -9.63 -17.3 -11.3 -15.6 -18.64 -14.29 -18.8 -14.8. 21 -4.7 -12.24 -7.08 -13.3 -8.6 -9.4 -14.20 -10.40 -15.5 -11.5 22 -1.7 -7.05 -3.52 -7.7 -4.0 -10.6 -13.31 -10.93 -15.0 -13 .1 23 -0.8 -3.18 -2.35 -2.7 -2.2 -6.7 -9.18 -7.58 -10.1 -8.3 24 +1.4 -1.54 -1. 64 -2.7 -2.8 -15.0 -11.44 -10.83 -12.1 -11.7 25 -0.3 -0.96 -1. 48 -1. 7 -2.2 -14.7 -14.26 -12.57 -15.6 -1:'.1 26 -1.1 -0.91 -1.90 -1.1 -1.9 -13.3 -14.77 -12.41 -17.1 -15.3 27 -6.7 -3.99 -3.87 -4.6 -4.6 -9.2 -12.22 -9.60 -14.6 -11.8 28 -6.1 -4.10 -3.16 -4.2 -3.3 -4.7 -7.87 -6.67 -8.6 -7.2 29 -11.1 -6.02 -5.58 -5.5 -4.7
-
-
-
- -30 -12.5 -8.48 -6.95 -8.4 -6.2-
-
-
-
-31 -12.5 -11.76 -9.23 -13.8 -11.5-
-
-
-
-APPENDIX 2 page 3
MAR. 1966/67
MEASURED TEMPERATURE (OC)
APR. 1966/67
AV. DA IL Y
r
AVERAGE DAILY 8 A.M. AV. DAILY AVERAGE DA IL Y 8 aNセNDAY AIR teセᄋZpN I SURFACE TEHP. SURFACE teセヲpN AIR TEMP. SURFACE TEMP. SL'R: ACE TE:.:? .
nSULATED COXTROL INSULATED CO:lTROL INSULATED coセtrol IXSl.:l..ATED CO:.. TROL
AREA AREA AREA AREA AREA AREA AREA AREA
1 -15.6 -8.59 -11.50 -7.9 -13.2 +10.0 +7.71 +10.25 +7.1 +5.8 2 -13 .1 -12.19 -11.25 -13.5 -12.8 +5.0 +6.63 +7.94 +5.5 +6.6 3 -3.6 -9.07 -7.29 -11. 4 -10.1 +2.8 +5.97 +5.35 +4.5 +3.8 4 -13.3 -8.38 -9.49 -8.9 -11.1 -1.4 +4.25 +4.01 +0.2 +0.5 5 -13.9 -10.53 -11.23 -11.4 -13.2 +6.1 +7.78 +6.15 +5.6 +4.1 6 -5.0 -8.72 -7.69 -9.5 -9.0 +0.8 +5.87 +4.14 +4.4 .J..?• _ ..,I 7 -5.0 -8.01 -7.34 -8.7 -8.6 +2.2 +5.56 +4.24 +3.8 +2.2 8 -17.2 -10.72 -11 .79 -11.8 -14.0 +3.3 +7.20 +6.10 +2.0 +0.8 9 -11.7 -12.14 -11.28 -14.0 -14.2 +6.6 +10.13 +8.19 +5.7 +4.1 10 +1. 7 -6.31 -4.18 -9.3 -7.8 +3.3 +10.18 +8.19 +9.9 +7.5 11 +2.2 -2.06 -0.94 -3.3 -3.5 -3.6 +3.81 +3.50 -0.1 +0.1 12 -9.2 -3.29
-
-1.01 -8.1 -6.2 -0.6 +5.71 +6.04 +0.1 +G.3 13 -5.3 -3.68 -2.21 -5.6 -4.0 +6.1 +11.57 +10.51 +5.2 +4.3 14 -1.1 +0.29 +0.50 -1.8 -1.7 +6.1 +12.26 +9.64 +10.5 +7.9 15 -1. 9 +0.68 +1.14 -0.7 -0.4 +4.4 +8.47 +6.76 +8.0 +6.2 16 -10.6 -1.12 -0.44 -3.6 -2.5 +6.4 +7.96 +7.22 +6.4 +5.4 17 -15.3 -2.90 -2.92 -5.9 -6.3 +4.2 +6.17 +5.20 +5.6 ..J-I. -, - t • .J 18 -18.1 -6.71 -5.73 -11.8 -10.5 +5.8 +6.81 +6.04 +7.3 +6.6 19 -12.2 -5.65 -3.94 -11.6 -8.9 +6.1 +6.76 +6.40 +5.1 KセNS 20 -2.8 -0.65 -0.18 -4.1 -3.5 +5.0 +10.56 +8.19 +5.8 +5.4 21 -5.0 -0.41 -0.44 -1. 2 -1.5 +3.6 +10.15 +8.21 +9.7 +7.9 22 -1.4 -0.13 -0.008 -0.2 -0.3 +10.3 +9.11 +8.27 +6.5 KsNセ 23 -0.6 +0.5 +0.29 -0.1 -0.1 +4.7 +7.81 +6.69 +6.9 +5.8 24 -0.3 +2.13 +1.53 -0.2 -0.1 +5.6 - - +6.4 +5.9 25 +1.9 KSセXV +3.11 -0.3 -0.1 +4.2-
-
-
-26 -1.1 +5.69 +3.55 +0.4 +0.1 +6.4-
-
-
-27 +1. 9 +3.21 +1.11 +3.9 +0.2 +5.8 - --
-28 +5.6 +5.53 +5.76 +4.6 +2.4 +7.5-
-
-
-29 +3.1 +3.37 +4.73 +1. 2 +0.4 +6.7-
--
-30 -0.6 +3.76 +4.61 -0.2 ·+0.2 +9.7-
-
-
-31 +3.1 +5.40 +6.53 +1.3 +2.0-
-
-
-
-NOV. 67/68
APPENDIX 3
MEASURED TEMPERATURE (OC)
page 1
DEC. 67/68
I
AV.DAILY AVERAGE DAILY 8 A.M. AV.DAILY AVERAGE DAILY 8 A.M.DAY AIR TE:·:P. SURFACE TEMP. SURFACE TEMP. AIR TEMP. SURFACE TEMP. SURFACE TEMP.
INSULATED CONTROL INSULATED CONTROL INSULATED coセ[trol INSULATED coセtrol
AREA AREA AREA AREA AREA AREA AREA AREA
1 +9.4
-
-
- - -6.4 -6.87 -4.81 -9.9 -7.2 2 +11.1-
-
-
-
-6.4 -7.21 -4.57 -9.1 -5.8 3 +9.4-
-
-
- -3.3 -4.42 -1. 97 -4.5 -2.1 4 +7.5-
-
-
-
-2.8 -3.71 -1.38 -4.1 -1.5 5 +1.1-
-
-
- -1.4 -3.26 -1.87 -3.7 -2.2 6 -0.3-
-
-
-
-6.4 -5.55 -4.21 -7.8 -6.5 7 -0.6-
-
-
-
-3.3 -4.13 -0.47 -5.5 -3.7 8 -3.3-
-
-
-
-1.7 -2.03 -1. 22 -2.2 -1. 3 9 -1. 7 --
-0.3 -0.2 -7.5 -4.26 -3.63 -4.5 -3.9 10 +1.1 --
-
-
-11.1 -9.97 -7.05 -11.2 -8.7 11 +3.1-
- -0.2 -0.4 -5.0 -9.79 -6.58 -8.8 -5.7 12 +6.1 +5.30 +6.28 +4.7 +6.1 +3.9 --
-1.3 -0.6 13 -0.8 +3.06 +3.09 +2,1 +1. 9 +3.3-
-
-0.3 -0.4 14 -6.4 -0.52 -0.47 -1.0 -1.3 -0.3-
-
-2.9 -3.2 15 -8.3 -0.15 +0.21 -0.2 +0.3 -6.1 - - -6.0 -5.3 16 -9.4 -1.61 -0.31 -1.8 -0.1 -7.5-
-
-9.6 -7.4 17 -5.0 -0.96 -0.83 -1. 2 -0.9 -6.1-
- -9.9 -7.5 18 -1.1 -0.49 -0.52 -0.6 -0.4 -0.8-
- -3.8 -2.7 19 -0.6 -0.18 -0.36 -0.20 -0.40 +1. 9-
-
-0.4 -0.6 20 -4.5 -0.91 -0.62 -0.3 -0.3 +0.3-
- -3.2 -3.6 21 -8.9 -4.94 -2.71 -5.7 -3.8 +2.2-
-
-4.0 -4.2 22 -2.5 -4.31 -1. 74 -4.9 -2.1 +1.4 --
+0.1 +0.1 23 0 -0.67 -0.36 -0.6 -0.4 -6.4-
-
-3.3 -3.2 24 0 -0.39 "-0.57 -1.1 -1. 2 -10.6-
-
-9.4 -3.3 25 +0.6 MPセRQ -0.26 -1.8 -1. 9 -5.6-
-
-
-26 +3.9 +0.42 +0.29 0 -0.1 -16.4-
- -6.3 -3.5 27 -0.6 -0.02 +0.05 -0.2 -0.5 -16.9-
-
-8.0" -4.7 28 -3.9 -0.07 -1.12 -0.9 -1.4 -11.9-
- -8.8 -5.9 29 -7.5 -2.40 -2.58 -3.8 -3.7 -9.4-
- -8.2 -4.2 30 1 -6.7 -4.39 -4.00 -6.1 ... 5.6 -12.2-
- -10.5 -6.3 31 --
-
-
-
-6.4-
-
-9.0 -4.2JAN. 67/68
APPHOIX 3
MEASURED teセperature (OC)
page 2
FEB. 67/68
AV. DAILY AVERAGE DAILY 8 A.M. AV.DAILY AVERAGE DAILY 8 A.M.
DAY AIR TDlP. SrRFACE teセャpN SURFACE TEMP. AIR TEMP. SURFACE TEMP. SURFACE TEM?
iセsエZlaイed coセtrol INSULATED CONTROL
I
INSULATED CONTROL InSULATED CO:;TROLAREA AREA AREA AREA AREA AREA . AREA AREA
1 -21.7
-
-
-2.5-
-
-4.3 -4.9 2 -21.1 -13.2 -10.4 +-1.9-
-
-0.5 -1.0 3 -15.6 -12.5 -7.1 -3.6-
-
-0.3 -2.3 4 -12.2 -11. 4 -5.9 -8.9-
-
-
-5 -19.4 -13 .9 -10.2 -9.7 -5.07 -5.10 -7.7 -7.8 6 -18.6 -16.1 -10.9 -7.2 -7.00 -6.90 -8.2 -7.6 7 -20.0-
-
-10.0 -8.11 -7. 80 -10.5 -10.1 8 -29.7 -22.8 -21.8 -14.2 -10.72 -9.60 -14.6 -13.9 9 -27. 5-
-21. 4 -13.6 -10.32-a..
72 -14.0 -12.5 10 -21. 7 -23.9 -17.8 '-16.1 -8.41 -7.19 -9.2 -8.1 11 -22.8 -24.5 -19.4 -21. 9 -12.67 -10.93 -9.9 -8.4 12 -18.9 -24.8 -19.7 -21.1 -16.47 -13.91 -18.6 -16.7 13 -15.8 -23.1 -17.7 -16.1 -16.39 -13.24 -17. 9 -15.4 14 -10.6 -20.7 -15.8 -9.4 -12.62 -9.04 -14.1 -11.1 15 -6.9 -13.5 -8.7 -12.8 -10.19 -7.98 -9.9 -7.8 16 -22.5 -12.1 -7.6 -11.1 -14.07 -9.84 -17.1 -15.1 17 -16.7 -15.3 -12.3 -12.8' -9.18 -6.97 -9.0 -7.2 18 -6.1 -13.2 -10.4 -18.3' -9.84 -9.20 -8.5 -8.1 19 -2.5 -6.5 -4.5 -15.6 -14.39 -12.08 -17. 2 -15.1 20 -1.4 -5.1 -5.1 -20.8 -15.63 -12.83 -17.6 -15.9 21 -1.1 -3.3 -3.6 I -20.3 -17.96 -14.12 -20.7 -13 :3 22 -7.5 -5.3 -6.2 -15.3 -16.72 -13.59 -8.6 -15.5 23 -6.7 -5.3 -5.1 -12.5 -14.88 -12.62 -17.3 -15.2 24 -17.2 -11.3 -12.1 -12.2 -12.91 '-10.51 -17.3 -15.4 25 -16.9 -18.9 -16.3 -7.5 -10.29 -7.74 -14.9 -13.3 26 -15.0 -19.1 -14.8 -6.9 -8.30 -5.76 -12.9 -11. 4_ 27 -7.8 -15.4 -12.1 -7.2 -5.02 -3.71 -9.5·I
-8.4 28 -8.6 -9.3 -8.0 -3.6 -1. 90 -2.53 -3.2 -4.5 29 -3.3 -7.5 -7.0 -1.1 -0.62 -0.96 -1. 7I
-2.9 30 -1.9 -1.6 .-2.4-
-
-
-
-31 -7.8 -6.6 -7.9-
-
-
-
-MAR. 1967 /68
APPENDIX 3
MEASURED TEMPERATURE (OC)
page 3
APR. 1967/68
AV.DAILY AVERAGE DAILY 8 A.M. AV. DAILY AVERAGE DAILY 8 A.M.
DAY AIR TEl-IP. SURFACE TEMP. SURFACE TEMP. AIR TE:IP. SURFACE TEMP. SURFACE teセpN
INSULATED CONTROL INSULATED CONTROL INSULATED CONTROL INSULATED' COHROt
AREA AREA AREA AREA AREA AREA AREA AREA
1 -2.2 -0.36 -1.90 -1.9 -4.7 +2.8 +9.42 +6.15 +5.8 +3.3 2 -5.6 -2.27 -3.87 -3.3 -5.1 +4.2