Comparison of explicitly simulated and downscaled tropical
cyclone activity in a high-resolution global climate model
The MIT Faculty has made this article openly available.
Please share
how this access benefits you. Your story matters.
Citation
Emanuel, Kerry, Oouchi, Kazuyoshi, Satoh, Masaki, Tomita,
Hirofumi, AND Yamada, Yohei. "Comparison of Explicitly Simulated
and Downscaled Tropical Cyclone Activity in a High-Resolution
Global Climate Model" Journal of Advances in Modeling Earth
Systems [Online] Volume 2 Number 9 (11 October 2010)©2010
American Geophysical Union
As Published
http://dx.doi.org/10.3894/JAMES.2010.2.9
Publisher
American Geophysical Union
Version
Final published version
Citable link
http://hdl.handle.net/1721.1/60397
Terms of Use
Creative Commons Attribution 3.0 License.
Comparison of Explicitly Simulated and Downscaled
Tropical Cyclone Activity in a High-Resolution Global
Climate Model
Kerry Emanuel
1, Kazuyoshi Oouchi
2, Masaki Satoh
2,3, Hirofumi Tomita
2and Yohei Yamada
21
Program in Atmospheres, Oceans, and Climate, Massachusetts Institute of Technology, Cambridge, Massachusetts, USA
2
Research Institute for Global Change, Japan Agency for Marine-Earth Science and Technology, Yokohama-Shi, Japan
3
Atmosphere and Ocean Research Institute, The University of Tokyo, Tokyo, Japan
Manuscript submitted 13 June 2010; in final form 28 August 2010
The response of tropical cyclone activity to climate change is a matter of great inherent interest and practical importance. Most current global climate models are not, however, capable of adequately resolving tropical cyclones; this has led to the development of downscaling techniques designed to infer tropical cyclone activity from the large-scale fields produced by climate models. Here we compare the statistics of tropical cyclones simulated explicitly in a very high resolution (,14 km grid mesh) global climate model to the results of one such downscaling technique driven by the same global model. This is done for a simulation of the current climate and also for a simulation of a climate warmed by the addition of carbon dioxide. The explicitly simulated and downscaled storms are similarly distributed in space, but the intensity distribution of the downscaled events has a somewhat longer high-intensity tail, owing to the higher resolution of the downscaling model. Both explicitly simulated and downscaled events show large increases in the frequency of events at the high-intensity ends of their respective intensity distributions, but the downscaled storms also show increases in low-intensity events, whereas the explicitly simulated weaker events decline in number. On the regional scale, there are large differences in the responses of the explicitly simulated and downscaled events to global warming. In particular, the power dissipation of downscaled events shows a 175% increase in the Atlantic, while the power dissipation of explicitly simulated events declines there.
DOI:10.3894/JAMES.2010.2.9
1. Introduction
Among the more interesting and potentially consequential effects of changing climate are changes in the intensity, frequency, and spatial distribution of tropical cyclones. But the main tools for projecting climate change – global climate models – have spatial resolutions that are too coarse to adequately resolve these storms. For example, the average horizontal effective grid spacing of the models used in support of the most recent report of the Inter-governmental Panel on Climate Change (IPCC,2007) is of the order of several hundred kilometers, whereas numerical convergence studies using specialized high-resolution trop-ical cyclone models (e. g. Rotunno et al.,2009) indicate that effective grid spacings on the order of 1 km or less are re-quired to fully simulate high intensity events.
To deal with the high resolution requirements for simu-lating tropical cyclones, several downscaling techniques have been developed. These generally involve embedding high
resolution regional or local models within a coarser global model, using initial and boundary conditions from the latter to constrain the former. For example, Knutson et al. (2007) drove a regional, 18-km grid model with boundary and initial conditions derived from a global reanalysis data set (Kalnay and co-authors,1996) and were able to capture the majority of the observed interannual variance in the frequency of North Atlantic tropical cyclones over the past few decades. When the same regional model is embedded in global climate models subjected to increases in long-lived greenhouse gases, the results suggest a decline in the global frequency of storms but an increase in the frequency of high-intensity events (Knutson et al., 2008). A recent review of the results of this and other downscaling exercises as well as of the response of storms simulated explicitly in global climate models supports the general finding that while the global frequency of tropical cyclones should decline under global warming, the frequency
This work is licensed under a Creative Commons Attribution 3.0 License.
To whom correspondence should be addressed.
Kerry Emanuel, Rm. 54-1620, MIT, 77 Massachusetts Avenue, Cambridge, MA 02139, USA
of the destructive, high-intensity events should increase, albeit with large regional and model-to-model variations (Knutson et al.,2010). The large variation in the results among different models and downscaling techniques warrants some caution in interpreting these findings. In particular, the various down-scaling techniques are subject to their own limitations, such as the lack of feedback from the regional or local models to the global models in which they are embedded, mismatches between the physics of the embedded and global models and, in some cases, the use of statistical characterizations of the global models rather than their actual output. The clear benefit of the downscaling techniques is their applicability to coarsely resolved global models, thus obviating the need for high resolution in the global models. But to improve these techniques and acquire some confidence in their quality, rigorous tests of their validity are required. Here we compare the results of one such downscaling technique driven by a particular global climate model to storms simulated explicitly by the same model.
2. Methods
The global model used here is the Nonhydrostatic ICosahedral Atmospheric Model (NICAM) as described in Satoh et al. (2008). This is a cloud-system resolving model run on a grid with approximately 14 km spacing; it does not use any cumulus parameterization. The model exhibits great promise in reproducing cloud-associated disturbances in a series of case studies on the Madden-Julian oscillation (MJO) (Miura et al., 2007) and tropical cyclones (Fudeyasu et al., 2008, Oouchi et al.,2009a). The success of NICAM in simulating tropical cyclones forms the basis for our use of it here.
The use of this model for simulating tropical cyclones in the current climate and again in a climate that has been warmed by the addition of greenhouse gases is described in detail in Yamada et al. (2010). The endeavor consists of a control (CTL) experiment from June to October 2004 and a future global warming (GW) experiment from May to October at the end of the 21st century. May for GW is regarded as a spin-up period and excluded from the analysis. 2004 was chosen as the sample year for the present-day experiment because that year had above-normal global TC activity and a large number of TCs that made landfall in Japan. The large computational demand of our approach prohibits our integrating the model for many months to obtain interannual variability. For CTL, the boundary ditions of sea surface temperature (SST) and sea ice con-centration (SIC) are the same as those in the boreal summer 2004 experiment of Oouchi et al. (2009b). The conditions for GW are created using the dataset of the World Climate Research Program (WCRP) Coupled Model Inter-compar-ison Project phase 3 (CMIP3) with the method of Mizuta et al. (2008). The climate forcing for GW is created by adding to the CTL the SST and SIC differences between the present-day (1979–2003) and GW (2075–2099) periods. The carbon dioxide concentration in GW is uniformly twice that
of CTL, following scenario A1B of the IPCC’s Special Report on Emissions Scenarios (SRES). The initial conditions for GW are taken from a present-day National Centers for En-vironmental Prediction (NCEP) reanalysis dataset for 0:00 UTC 1 May 2004. The model TCs are tracked using the methodology described in Oouchi et al. (2006). We use 17.5 ms21 as the wind speed threshold for our TC defini-tion; no artificial tuning of thresholds is required for the 14-km mesh simulation. Oouchi et al. (2006) also required genesis equatorward of 30 degrees latitude for an event to be counted as a tropical cyclone; here we relax this criterion so as to include all storms that form between 20
˚
S and 50˚
N. With this detection algorithm, the model produces 62 tropical cyclones in the CTL experiment, and 43 in the GW experiment. Given the June-October time frame of the experiments, it is not surprising that most of the storms occur in the northern hemisphere.The downscaling technique applied is that of Emanuel et al. (2008). This technique relies heavily on the application of a highly resolved, coupled ocean-atmosphere model phrased in angular momentum coordinates (Emanuel, 1995). This is an intensity-only model and must be supplied with a tropical cyclone track. In this downscaling technique, tracks are initiated by random seeding in space and time1, and propagated forward using a beta-and-advection model driven by winds derived from the NICAM simulations. The intensity model is then integrated along each track. In practice, a large majority of the events suffer declining intensity from their onset and are discarded; the survivors constitute the tropical cyclone climatology of the model.
The downscaling model relies on large-scale winds both to drive the beta-and-advection track model and for deriv-ing wind shear that is input to the intensity model. As described in Emanuel et al. (2006), the winds are derived from synthetic time series of winds constrained to have the same monthly means as those produced by the global model, as well as the same monthly mean covariances among the wind components at two model levels, where the fluctuations are defined in terms of departures of daily means from monthly means. The wind time series are also constrained to have power spectra that fall off with the cube of the frequency. The thermodynamical input to the intens-ity model consists of monthly mean potential intensintens-ity and 600 hPa temperature and relative humidity derived from the global model. The ocean component of the intensity model requires ocean mixed layer depth and sub mixed layer thermal stratification; in the simulations described here we use present day climatology for both these quantities. Thus the effect of global warming on the thermal stratification of the upper ocean is not considered here.
When driven by NCAR/NCEP reanalyses (Kalnay et al., 1996) during the period 1980-2006, this downscaling tech-nique produces results that explain as much of the observed variance in North Atlantic tropical cyclone activity as does
1Seeding is not done poleward of 75 N or 65 S, or equatorward of 3 degrees.
the regional downscaling technique of Knutson et al. (2007), and captures well the observed spatial and seasonal variabil-ity of tropical cyclones around the globe, as well as the effects of such climate phenomena as ENSO and the Atlantic
Meridional Mode. Thus there are objective reasons to have some confidence in the ability of the downscaling technique to simulate the effects of climate and climate change on tropical cyclone activity.
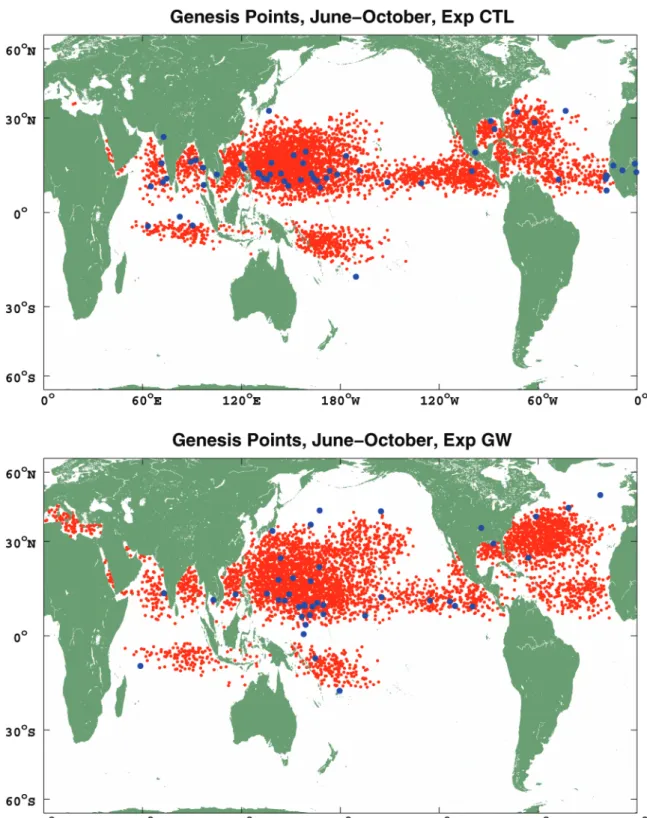
Figure 1. Genesis locations (red dots) of each of 5000 synthetic events in the CTL (top) and GW (bottom) experiments. Genesis locations of explicitly simulated events shown by blue dots.
For the present application, we derive the monthly mean winds, potential intensity, 600 hPa temperature and humidity, and wind covariance fields directly from the NICAM model output for both the CTL and GW experi-ments. We simulate 5000 events globally for each of these experiments. Thus the tropical cyclone sample size is about two orders of magnitude greater than that of the directly simulated events.
3. Results
All of the directly simulated and downscaled genesis points are shown in Figure 1 for both the CTL and GW experi-ments. In the control experiment there is broad agreement in genesis locations, although there is only one explicitly simulated event forming in the South Pacific, and some of the explicit events appear to develop over land.
There is more discrepancy between the explicit and downscaled storms in the GW experiment, though both show a substantial poleward expansion in genesis locations.
The downscaled events show some interesting changes from the CTL to the GW experiment. There are large northeastward shifts in genesis locations in the western North Pacific and North Atlantic basins. These include an event east of Newfoundland, several events not far west of California, and some events forming to the southwest of Spain. In the GW experiment, there is a dearth of events in a broad strip across the central North Atlantic, a region of high shear identified by Yamada et al. (2010). Very few storms form in the Caribbean or Gulf of Campeche in GW, consistent with the high shear and low potential intensity there (see Figure 2 of Yamada et al.,2010). Increased shear in the eastern North Pacific likewise leads to a decline in the number of events there. A decline in events in the South Indian and South Pacific basins is driven by reduced humidity and potential intensity in those regions, though bear in mind that these simulations only encompass June-October and therefore miss the peak season in the Southern Hemisphere. One oddity is the appearance of an explicit event in the central South Pacific near 28
˚
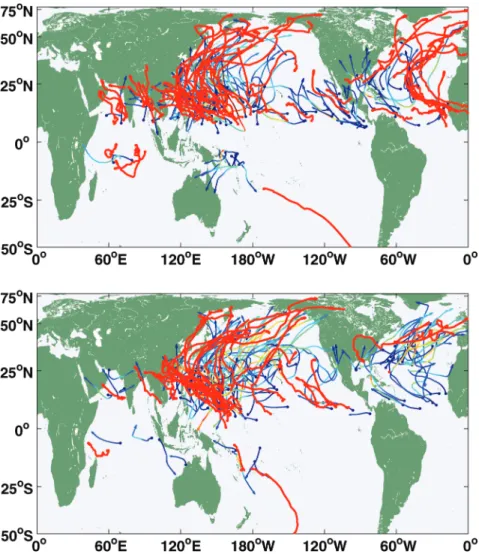
S, a region of veryFigure 2. Tracks of 100 randomly selected downscaled tropical cyclones (multi-colored) and all explicit tropical cyclones (red) for the CTL (top) and GW (bottom) experiments. For synthetic tracks, colors correspond to wind speed, ranging from blue (low) through green (moderate) and yellow (high).
small potential intensity (Yamada et al.,2010). This may be a case in which the detection algorithm misidentifies a baroclinic event as a tropical cyclone.
Of some interest are the large increases in genesis rates in the Mediterranean and the appearance of storms in the Persian Gulf and Caspian Sea under GW.
Tracks of explicit and downscaled tropical cyclones are shown in Figure 2 for both experiments. The tracks are broadly reasonable and the synthetic and explicitly simulated
tracks are similar, though bear in mind that there are only 62 of the latter in CTL and 43 in GW. Note that some of the explicitly simulated events begin over land.
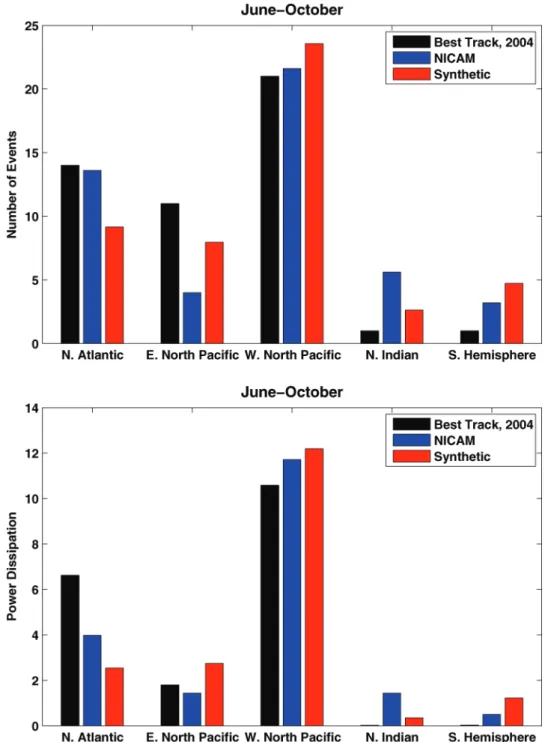
Figure 3a shows that the distributions of both the syn-thetic and explicitly simulated events among the various ocean basins of the Northern Hemisphere compare well with tropical cyclone observations, though the numbers of events in the eastern North Pacific are somewhat under-estimated, while those in the northern Indian Ocean and
Figure 3. Number (top) and power dissipation (bottom) of observed (black), explicitly simulated (blue) and downscaled (red) events during June-October, 2004, in five regions of the world oceans. In both cases, the sum over the basins of the explicit and synthetic events is constrained to equal the sum over observed events.
Southern Hemisphere are overestimated. Tropical power dissipation2(Figure 3b) is underestimated by both techni-ques in the North Atlantic and overestimated in the north-ern Indian Ocean and Southnorth-ern Hemisphere, corresponding to the overestimates of frequency in those regions. Power dissipation in the North Pacific is well represented by both methods. We caution, however, that we are comparing to a
very limited number of real events –48 in total – with only one event in each of the north Indian Ocean and Southern Hemisphere, over the 5 months of June-October, 2004.
The effect of global warming on the downscaled tropical cyclones appears to be quite different from its effect on the explicitly simulated storms. Figure 4 compares the frequen-cies and power dissipations of the explicitly simulated and downscaled events between the CTL and GW experiments. The most dramatic differences are in the Atlantic, where
Figure 4. Number (top) and power dissipation (bottom) of explicitly simulated (solid colors) and downscaled (pastel colors) events for the CTL (blue) and GW (red) experiments.
2Estimated by summing the cube of the maximum wind speed over the
lifetime of the storm.
warming produces a dramatic decline in the number of explicitly simulated storms, but an equally dramatic increase in the number of downscaled events. Likewise, there is a 175% increase in power dissipation by the downscaled Atlantic events, but a considerable decrease in the power of the explicitly simulated storms. The increase in down-scaled power dissipation in the western North Pacific agrees well with that of the explicitly simulated events, but outside the North Pacific, downscaled events increase in power while the power dissipation of the explicitly simulated events decreases.
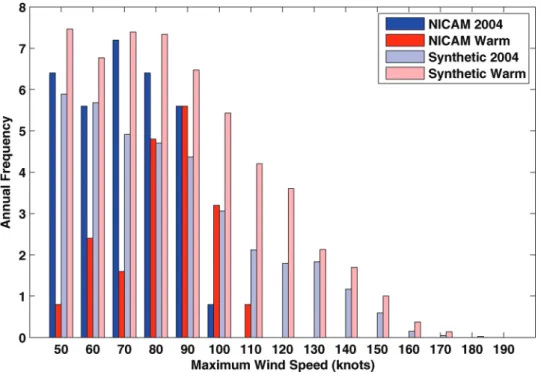
Further insight into the nature of the disparity comes from an analysis of the change in intensity distributions with warming, as shown in Figure 5. The frequency of down-scaled events increases for all categories of storm lifetime maximum wind speed, especially for wind speeds of hurric-ane force and greater, while for wind speeds smaller than 90 knots, there are declines – often dramatic – in the number of explicitly simulated storms.
Note also that there are no explicitly simulated events whose wind speed exceeds 115 knots in either experiment; it is clear from inspection of Figure 5 that the intensity distribution of the explicit events is strongly truncated. This is no doubt owing to limited horizontal resolution… even a 14 km mesh is insufficient for simulating strong events (Rotunno et al.,2009). Possibly for this reason, the global power dissipation of explicit events is essentially unchanged between the CTL and GW experiments, whereas the down-scaling shows a 65% increase in global power dissipation.
4. Discussion and Summary
The downscaling technique of Emanuel et al. (2008) has been applied to the output of a high resolution global climate model for the months of June-October, 2004, and again for the same 5 months of an experiment meant to simulate the effects of global warming. Various metrics of downscaled tropical cyclone activity have been compared to the activity of storms explicitly simulated using the model’s 14 km grid mesh. For the current climate, there is reasonable agreement in the spatial distribution of the explicitly simu-lated and downscaled storms, but the intensity distribution of the explicit events is truncated at around 102 knots, probably owing to the horizontal resolution, which is still too coarse to capture high intensity events. But for the warmer climate there are notable discrepancies between the explicit and downscaled tropical cyclone activity. The down-scaled storms show impressive activity poleward of 30 degrees in the GW simulation, especially in the North Atlantic and North Pacific basins, but also in the Mediterranean, and storms appear in this simulation (but not in CTL) in the Persian Gulf and Caspian Sea.
Explicitly simulated tropical storms and Category 1 hur-ricanes decrease dramatically with warming, whereas the frequency of downscaled events of these intensities increases substantially. (Downscaled storms increase by 45% from the CTL to GW experiments, versus a 44% decrease in explicitly simulated events.) In attempting to explain this disparity, it is tempting to favor the explicit simulations over the down-scaling, yet the latter has been shown to explain much of the
Figure 5. Distribution of events in 10-knot bins of lifetime maximum wind speed. Solid colors show explicitly simulated events and pastel colors show downscaled events. For CTL (blue) and GW (red) experiments.
recent variability of tropical cyclone activity, including basin-to-basin variance, seasonal cycles, the response to ENSO, and secular trends over the past few decades (Emanuel et al., 2008). One climate change effect that is difficult to test in the current climate is the warming of the tropical troposphere that occurs under global warming but is largely absent during regional climate fluctuations in the Tropics. This was shown by Emanuel et al. (2008) to have a large damping effect on tropical cyclone activity through the attendant increase in mid-tropospheric saturation deficit. This increase in saturation deficit enhances convective downdrafts and thereby tends to discourage genesis. But this effect may reasonably be supposed to depend on such matters as the rate of evaporation of rain and other micro-physical processes that are crudely handled in the down-scaling technique and may not be much better represented in global models.
Although the NICAM simulations reported here are among the most highly resolved of current global climate models, the approximate 14 km grid mesh of the model is still too large to resolve intense tropical cyclones, resulting in the truncation of the intensity spectrum evident in Figure 5. Given that a large preponderance of damage done by tropical cyclones in the developed world is done by storms with landfalling winds of greater than 95 knots, trends in such storms are much more important to predict than the overall frequency of events. Yet these stronger events are not well resolved even by the highest resolution global climate models available today. At the same time, the downscaled results reported here suggest potentially large increases in the incidence of high intensity events. Thus we believe that more work needs to be done to better quantify the response of tropical cyclones to climate change.
Acknowledgements: K. Emanuel is grateful for the sup-port of the National Science Foundation, through Grant 0756308. The simulations were performed on the Earth Sim-ulator/JAMSTEC, under the framework of the Innovative Program of Climate Change Projection for the 21st century (KAKUSHIN) project funded by Ministry of Education, Culture, Sports, Science and Technology, Japan.
The analysis of NICAM data was supported also by the Core Research for Evolutional Science and Technology (CREST) of the Japan Science and Technology Agency. References
Emanuel, K., R. Sundararajan, and J. Williams, 2008: Hurricanes and global warming: Results from down-scaling IPCC AR4 simulations. Bull. Amer. Meteor. Soc., 89, 347-367. doi:10.1175/BAMS-89-3-347.
Emanuel, K. A., 1995: The behavior of a simple hurricane model using a convective scheme based on subcloud-layer entropy equilibrium. J. Atmos. Sci., 52, 3959-3968, doi: 10.1175/1520-0469(1995)052,3960:TBOASH.2.0. CO;2.
Emanuel, K. A., S. Ravela, E. Vivant, and C. Risi, 2006: A statistical-deterministic approach to hurricane risk assessment. Bull. Amer. Meteor. Soc., 19, 299-314, doi: 10.1175/BAMS-87-3-299.
Fudeyasu, H., Y. Wang, M. Satoh, T. Nasuno, H. Miura, and W. Yanase, 2008: The global cloud-system-resolving model NICAM successfully simulated the life cycles of two real tropical cyclones. Geophy. Res. Lett., 35, doi: 10.1029/2008GL036003.
IPCC, 2007: Climate Change 2007: The Physical Science Basis. Contribution of Working Group I to the Fourth Assessment Report of the Intergovernmental Panel on Climate Change. The IPCC Fourth Assessment Report, or AR4, S. Solomon, and Coauthors, Eds., Cambridge Uni-versity Press.
Kalnay, E., and co-authors, 1996: The NCEP/NCAR 40-year reanalysis project. Bull. Amer. Meteor. Soc., 77, 437-471, doi:10.1175/1520-0477(1996)077,0437:TNYRP.2.0. CO;2.
Knutson, T. R., J. J. Sirutis, S. T. Garner, I. M. Held, and R. E. Tuleya, 2007: Simulation of the recent multi-decadal increase of Atlantic hurricane activity using an 18-km grid regional model. Bull. Amer. Meteor. Soc., 88, 1549-1565, doi:10.1175/BAMS-88-10-1549.
Knutson, T. R., J. J. Sirutis, S. T. Garner, G. A. Vecchi, and I. M. Held, 2008: Simulated reduction in Atlantic hurric-ane frequency under twenty-first-century warming con-ditions. Nature Geosci., 1, 359-364, doi:10.1038/ngeo202. Knutson, T. R. et al., 2010: Tropical cyclones and climate change. Nature Geosci., 3, 157-163, doi:10.1038/ngeo 779.
Miura, H., M. Satoh, A. Nasuno, T. Noda, and K. Oouchi, 2007: A Madden-Julian oscillation event simulated using a global cloud-resolving model. Science, 318, 1763-1765, doi:10.1126/science.1148443.
Mizuta, R., Y. Adachi, S. Yukimoto, and S. Kusunoki, 2008: Estimation of the future distribution of sea surface temperature and sea ice using the CMIP3 multi-model ensemble mean. MRI Tech. Rep. 56, Meteorol. Res. Inst., Tsukuba, Japan 28 pp. [Available athttp://www.mri-jma. go.jp/Publish/Technical/DATA/VOL_56/56.html.] Oouchi, K., A. T. Noda, M. Satoh, H. Miura, H. Tomita, T.
Nasuno, and S. Iga, 2009a: A simulated preconditioning of typhoon genesis controlled by a boreal summer Madden-Julian Oscillation event in a global cloud-sys-tem-resolving model. SOLA, 5, 65-68.
Oouchi, K., A. T. Noda, M. Satoh, B. Wang, S.-PXie, H. G. Takahashi, and T. Yasunari, 2009b: Asian summer mon-soon simulated by a global cloud system-resolving model: Diurnal to intraseasonal variability. Geophy. Res. Lett. 36, doi:10.1029/2009GL038271.
Rotunno, R., Y. Chen, W. Wang, C. Davis, J. Dudhia, and C. L. Holland, 2009: Large-eddy simulation of an idealized tropical cyclone. Bull. Amer. Meteor. Soc., 90, 1783-1788, doi:10.1175/2009BAMS2884.1.
Satoh, M., T. Matsuno, H. Tomita, H. Miura, T. Nasuno, and S. Iga, 2008: Nonhydrostatic icosahedral atmo-spheric model (NICAM) for global cloud resolving simulations. J. Comput. Phys., 227, 3486-3514, doi: 10.1016/j.jcp.2007.02.006.
Yamada, Y., K. Oouchi, M. Satoh, H. Tomita, and W. Yanase, 2010: Projection of changes in tropical cyclone activity and cloud height due to greenhouse warming: Global cloud-system-resolving approach. Geophy. Res. Lett., 37, doi:10.1029/2010GL042518.