Publisher’s version / Version de l'éditeur:
Journal of Thermal Insulation, 13, pp. 149-159, 1990
READ THESE TERMS AND CONDITIONS CAREFULLY BEFORE USING THIS WEBSITE. https://nrc-publications.canada.ca/eng/copyright
Vous avez des questions? Nous pouvons vous aider. Pour communiquer directement avec un auteur, consultez la première page de la revue dans laquelle son article a été publié afin de trouver ses coordonnées. Si vous n’arrivez pas à les repérer, communiquez avec nous à PublicationsArchive-ArchivesPublications@nrc-cnrc.gc.ca.
Questions? Contact the NRC Publications Archive team at
PublicationsArchive-ArchivesPublications@nrc-cnrc.gc.ca. If you wish to email the authors directly, please see the first page of the publication for their contact information.
NRC Publications Archive
Archives des publications du CNRC
This publication could be one of several versions: author’s original, accepted manuscript or the publisher’s version. / La version de cette publication peut être l’une des suivantes : la version prépublication de l’auteur, la version acceptée du manuscrit ou la version de l’éditeur.
Access and use of this website and the material on it are subject to the Terms and Conditions set forth at
Scaling factors in aging of gas-filled cellular plastics
Bomberg, M. T.
https://publications-cnrc.canada.ca/fra/droits
L’accès à ce site Web et l’utilisation de son contenu sont assujettis aux conditions présentées dans le site LISEZ CES CONDITIONS ATTENTIVEMENT AVANT D’UTILISER CE SITE WEB.
NRC Publications Record / Notice d'Archives des publications de CNRC:
https://nrc-publications.canada.ca/eng/view/object/?id=6e7afd8c-3356-4e20-8a53-1153d207dd4c
https://publications-cnrc.canada.ca/fra/voir/objet/?id=6e7afd8c-3356-4e20-8a53-1153d207dd4c
.
/c'h*I
H a t i d
Research
c o n d
rut-
C ,
3
Council
Canada
de recherches Canada
Institute for
lnstitut de
Research in
recherche en
Construction
construction
Canad8
I
Scaling Factors in Aging
of
Gas- Filled Cellular Plastics
by Mark Bomberg
Reprinted from
Journal of Thermal Insulation
January 1990
Vol. 13
p. 149-159
(IRC Paper No. 1661
)Une des techniques utilisk pour determiner le vieillissement des plastiques 1 alvcSoles remplies de gaz
(PARG)
consiste 1 dtablir une corr6lation entre la resistance thermique de couches minces de ce materiau et celle de panneaux pleine epaisseur. On peut utiliser1
cette fin les modeles de vieillissement ou la methode des coefficients de changement d'khelle. L'auteur edudie id cette derniere en comparant le vieillissement de couches minces et celui de couches 6paisses de PARG, et il souligne ses limites.Scaling Factors in Aging of
Gas-Filled Cellular Plastics
MARK
BOMBERG
Natic~tral Ri~siwrrh Council Carzada
Irrstitirte&r Ri~si,arch
inConstructi~~rt
Oftnu~a,
O t ~ f a r i ~ ~
K I A OR6
ABSTRACT: Chc o f the techniques uscd to dctcrnlinc aging o f gas-filled cellular plastics (GFCP) is to correlate the thermal resistance o f thin material laycrs with that o f full thickness boards. Either models o f aging or scaling factors may be uscd for this purpose. This paper discusses the concept o f scaling factors relating aging o f thin and thick laycrs o f GFCP, and points out their limitations.
1. I N T R O D U C T I O N
E
VER SINCE MEASUREMENTSof thermal resistance following exposure to
elevated temperature
(28 days at 100°C) were introduced to the Cana-
dian standard for polyurethane thermal insulation, their validity has been
questioned. There are two main objections: 1) elevated temperature may
cause rupture of some cells btyond that actually occurring in service, and 2)
the correlation of thermal resistance determined in this test and in-situ has
not been adequately established [I]. Recently, the Institute for Research in
Construction, National Research Council Canada, undertook a review of
procedures for evaluating long-term thermal resistance of GFCP. The dis-
criminatory character of 100°C exposure was once more shown [ 2 ] . More
importantly, it became evident that for some materials use of elevated tem-
perature may not accelerate aging at all.
To demonstrate the limitations of elevated temperature as a means of de-
termining long-term thermal resistance, several polyisocyanurate specimens
cut from two production batches were exposed
to elevated temperature for3, 7, and 12 months and stored in room conditions for 24 months. Table 1
Reprinted from JOURNAL OF THERMAL INSULATION I i ~ h t t t a ~ I . ~ - - J , I I I I I , I ~ ) , I990150 MARK BOMBERG
Table I. Conditions of exposure of PIR specimens.
Initial Exposure laboratory Exposure
Specimen Time, Temp. Time, Temp.
CodeIBatch months O C months OC
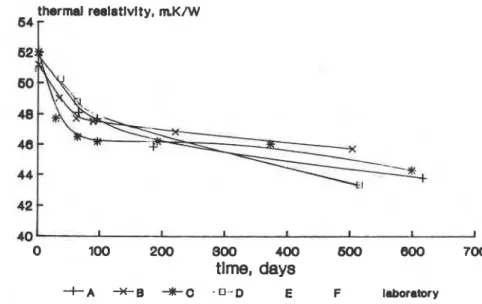
provides details of exposure. Thermal resistivity of the specimens was mca-
sured periodically (Figure
1).
The initial value of thermal resistivity is, for most of the spccimcns, bc-
tween 51 and
52 m.K/W, i.e., within 2%. While initially small, the diffcr-
ences in thermal resistivity of various spcdnlcns has bccn increased with
time, and after one year is as large as XI (44.5
to46.5
nl-KIW). Thcsc
differences appear to overshadow other cffccts. c.g., that of elevated tcnlpcr-
ature. Except for differences in aging curves of various spccimcns. one can-
0 100 200 900 400 600 800 700
tlme,
days
+A +g +O - 0 - 0 E F laboratory FIGURE 1. Agingof polyisocyanuratc board ~ g c d for 3. 7 and 12 111onths at clcv~tcd tcnipcrd- ture and later stored in the laboratory. Spccitiicn codes arc explained in Table I.
Scalitcy Factors it1 Agit~'y i f Gas-Filli,d C(~l11rlar Plastics
151
not sec in Figurc
1 any
trcnd thatwould rc'flt'ct
'theaccclcsating
cffcctof
elevated tcrnperanirc. Ironically, thc highcst thcrrnal rcsistivitics after
twoyears arc shown by spccimcns B and
C.
which were cxposcd
to 100°C.Ncxt
highest thermal resistivity
isshown
by the spccirnens
not ~ x p o s e dto
clc-vated
ternpcrature
butstorcd
inthe labc>ratory. The lowest
thcrmalresistancc
valucs shown
inFigure 1 arc those of specimens E.
D
and F,
which wcrc
cx-posed to 60°C.
Figurc 1 dcn~onstratcs
that for somc GFCP
products thcusc
of elevated temperature is
noteffective
a sa
meansof
accclc.ratingaging.
Thc
onlypractical mcthod of rcducing duration of l-xpcriment
is to mca-
sure aging of thin layers. Results must.
howwcr,be corrclated with
those o fthick
layers.Models of aging [3]
orscaling factors
141can be used. The
latterapproach has already been applied [5], but
thclimitations
of
thcconcept
have
not
bcundiscussed.
To
analyst
thcconccpt of scaling factors and thc
limitations of their use one may draw an analogy with heat and mass
transfer.
2. ANALOGY BETWEEN HEAT AND GAS TRANSFER
The ingress of air into the GFCP slab or egress of blowing agent from the
material may be described by the same equations as for heating or cooling of
a material slab. If a slab with a uniform initial temperature TI has its surface
temperatures lowered to level T2 at time
t =0, the mean slab temperature,
T,, is as follows:
T,
-
T2
81
exp (-Fo
-
(2n
+
.
r 2 )
T1-T2
T ~ , , = , ,(1)
where
L
is slab thickness,
tis time,
Fois Fourier number,
ais thermal diffusion
coefficient,
Xis thermal conductivity coefficient,
cis specific heat and
Qis the
density of the material [6].
For larger values of Fo (achieved at either longer time or a small thickness
of the slab), the series in Equation (1) converges rapidly, permitting use of
the first term only. Thus, Equation (1) may be simplified:
T, -T2
- -8
-
exp (-Fo
.
1r2)
Equation (2) implies that at a certain value of time (for a given material thickness,
L,
and thermal diffusion coefficient, (1, the proccss of cooling, orheating, of the slab becomes strictly exponential. This stagc of the cooling process was designated by Kondraticv
171
"the regular reginlc." stagc. We call it "an advanced stage" of the diffusion proccss, bearing in n ~ i n d that the pro- cess of slab cooling constitutes a specific case of transfer phenomena gov- erned by the theory of diffusion.Gas transfer through closed-cell cellular plastic may also be treated JS a
process of diffusion
[8].
In comparing heat and gas transfer phcnonlcna, it is evident that temperature corresponds to gas pressure; thcrnlal diffiision co- efficient, a; to effective gas diffusion cocfficicnt, D; and ratc of tcrnpcraturc -changes to rate of pressure changes.
O n e may analyze gas transfer phcnonlcna with the help of Equations
(1)
and (2). Equation (2) indicates that logarithm of rclativc pressure of the gas (dimensionless) is linearly dependent o n Fouricr number. While the linear dependence is valid for larger values of Fouricr ni1111ber. Equation (1) states that the logarithm of rclativc gas prcssurc is always proportional to the Fourier number. So, to the extent in which Equation (1) describes the proccss of gas transfer, it may be used for "scaling" thc transfer proccss itself. i.c., for determining the rate of diffusion o n a thin
specimen
and relating it to that of a thick specimen. To ensure similitude of these processes, Fo must be con- stant. This means that to conlpare the diffusion ratc dctern~ined for the slab with any set of properties (thickncss,L,
and effective diffusion cocfficicnt, D) and the reference slab, the measured aging time nlust be nlultiplicd by the scaling factor,Sf:
where
where
L,
and Do arc the thickncss and effective diffilsion cocfficicnts of the reference material layer. Wc restrict further discussion to a material for which one may assume that the effective diffusion cocfficicnt remains unchanged ( D =Do).
The scaling factor is therefore expressed as the ratio of the second power of thickness,SL
:3. THERMAL RESISTIVITY AS AN EXPONENTIAL FUNCTION OF TIME
If pressure changes in the advanced stage of diffusion follow an cxponen- tial curve, would thermal rcsistivity also follow the sanlc type o f depcn- dencc? Traditionally, laboratory measurements of thermal conductivity were presented against the logarithm o f time [9-121. This relation has never, however, been examined in a rigorous fashion. Now it can be done with the model o f aging
[3].
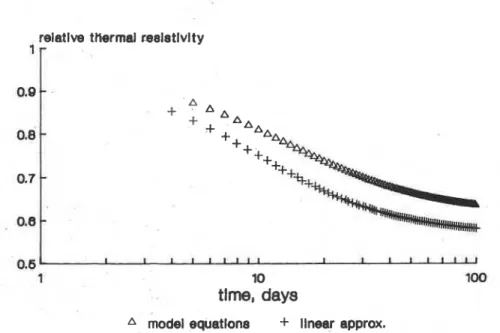
Figure 2 shows calculations o f thermal rcsistivity perfornlcd for a 6 m m thick layer of G F C P placed in a Heat Flow Meter with a hot plate surface of 27OC, cold plate surface o f 23OC, and the following effective diffusion coef- ficients: 0 for oxygen-0.2
x
lo-" n121s for nitrogcn and 0 for CFC-I I. Changes in the cell-gas corllposition arc related to only one diffusion pro- cess, nitrogen diffusion. Further, the calculations are performed with ther- mal conductivity o f the cell-gas calculated in t w o ways: 1) assuming a linear dependence on molar concentration, 2) using the same equations as for the aging model[3].
T h e use o f dfferent approximations o f thermal conduction o f the gas mixture significantly affects the values o f thermal resistivity, but the character o f the aging curve remains the same.relatlve thermal reslstlvlty
1
-
0.9
-
0.8-
0.7-
0.8
-
A
model equatlons
+
llnear approx.
FIGURE 2. Thernwl rcsistivity o f 6-tlmm thick laycr as afictcd by nitrogen diffusion only. (;as conductivity calculated in two ways: ( 1 ) as lincar function o f molar concentrations, (2) as in the model 13).
Figurc
2
indicates
that under idcalizcd r.ot~ditiorls. w l ~ ~ t i rlrily o~lc- F:IS is diffusing into athin
rnatcrial layer; ~ n d
onlythc
~ I C ~ V ~ I I I C C ' C ~ stdgr o f d i K ~ ~ s i o t ~ isconsidered,
thermal rcsistivity h C c r ) l ~ ~ c s ;I srrictly cxpl)nc.nti,ll t i ~ n r ~ t i o r ~af
time.
Thus,although
thcr~rral rcsistivit~will
dcviatc from tlw cs~~or~ciici;rlcharactcr i n thc initial and ftrral stagcs of i l ~ i n g . it is 011 tlir \r.litllc hcnctir-ial to use the senli-logarithmic presentation
of
the c?cpcrinicnt;il rcsults.4. USE OF SCALING FACTORS
4.1.
Ideal Material
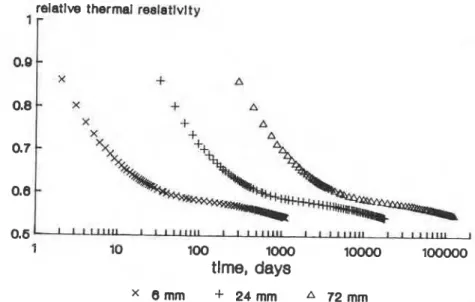
A numbcr ofcurvcs were gcncratcd to rcprcscnt aging of a11 idcal material
[3].
T h e following niatcrial propertics wcrcused
in tlic calci~lations: initial fraction o f CFC-I1
was 0.39. cRcctivc ciiRi~sion cocf?icic.nts wcrc 0.12x
10-lo m21s for oxygen, 0.2x
10-'I 111'1s for 1iitrogc11 a~ici 0.I
x
1 0 - I . ' 111'1s h r CFC-11. T h e density of the solid phasc (polymcr) w.is 1 2 2 0 liglm.', and thc thermal conductivityof
the solid ~ n a t r i x was 0 . 2 7 W1m.K. T h e density o fthe foam was
33
kglm3; it had XS'X, of mass in thc struts and only 15'X) in the cell-membranes. Calculated tlicrnlal rc-sistivity values arc shown ill Fig- ure3
for three layers with thicknc,sscs o f h, 2 4 and 7 2 mm.To limit errors in thc scaling process, a ~ u i ~ ~ i ~ n i ~ n i Fourier nilmbcr
of
0.005 was selected (cf. curve I1 in Figure 12, page102
of
Carslaw K. Jacgcr 161).relatlve thermal rsala
tlvl
t y'
r
1 10 100 loo0 loo00 loo000
tlme,
days
FIGURE 3. Thcriilal rcsistivity o f a l l idral i i i ; ~ t ~ r i . ~ l . C.IICIII.I~C~ tr011i tllc IIIOJCI 1.31 h r tlircc
relatlve thermal reelatfvlty
'
i-
X0.1 1 10 100 loo0 loo00
tlme,
day
x 8 m m
+
24mm A 72mmFIGURE 4. Thcrtnal resistivity of .ln i d c ~ l ~natcrial In relation to thc logarithm o f scalcd tiliic. Six-nln~ I3y~'r sclcctcd :IS rcfcrciicc thickticss.
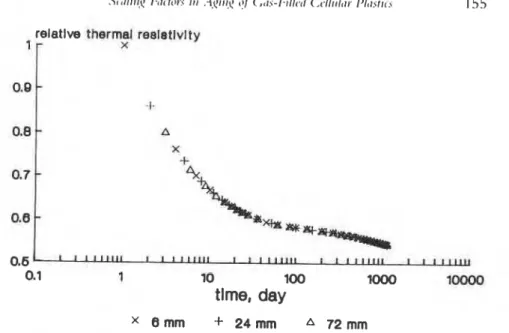
Using Fo = 0.005 and nitrogen diffusion cocfficicnt of 0.2 = l o - " m2/s one obtains
apptoxililatcly
two daysof
agi11g for a10-mm
thick
spucimcn.Thus.
thc
first
two claysof aging wcm
disrcgardcd.T h c
sarnc aging curves as those shown En F i ~ u r c3
arc now pwscnltcd against scaled timc, with a6-mrn
layer ascdas
rhr
rcfcrcncr. In n~ultiplying thc actualtimc
by thcscaling factor,
St,
all laycrs
fi~llr~w
thc
sarnc aging curvc(Figure
4). I tmay bc
sccn chat usc o fthc
scal tng factorConlpCnsatCs
for diffcrcncssin
spccimcnthicknr-ss.
4.2. Homogeneous and Uniform Material:
Core of Extruded Polystyrene
Spccin~cns for tcsting o f thcrn~al rcsistancc wcsc prcparcd in two
stagrs.
Thcy
wcrc czltwith
a horizontal bandsaw. thcnmountcd
for polishing witha carbrln~ndurii
grinder
that nlovcs across thcsurfacc
of
thc Stationaryspcci-
nlcn. This grillding proccss dcstroycd
somr
of thc
cclls, increasingrhc
frac-
tion of oprn
cclts
in thc laycr adjaccnt to thcsurficc Thus, thc
thicknessof
thc
laycr that actually participates in the diffusion process is smaller than the gc.omctrica1thicknrss.
Thc dl-stroycd
surface laycr(TDSL)
wasapproxi-
matrd by comparing thc gconictrica! volunrc tothc volulnc
detcrn~incdby
Incans o f a gas-burcttc (air displacr~i~cnt mcthod). Forcxrrudcd
polystyrt.nc. thcTDSL
was0.
I8m m
andthc actllal chicknr-ss of cach
laycr was corrcctcdby 0.36 tnnl.
,
Figure
5
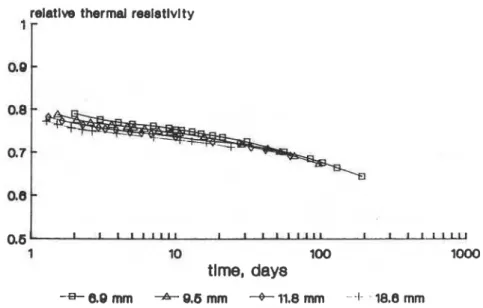
shows the aging of four laycrs cut from the middle of thc cx- truded polystyrene board, using the thinnest laycr as the reference for scal- ing factors. As explained in Figure3,
the rcsults of mcasurcmcnts from thc first two days o f aging of the thin specimen were discarded. Thermal rcsis- tivity measured o n 10,12
and 19-mm thick s p c c i n ~ ~ n s is shown in relation to the logarithm of scaled time. Since an extruded polystyrcnc son~ctinies exhibits small differences in initial thcrn~al resistivity at different locations of the cross-section, it was not surprising that the average value of initial thcr- ma1 resistivity differed for laycrs with different thick~lcss~s. (These differ- ences could, perhaps, be attributed to d i f f ~ r ~ n c c s in thc initial C F C pres- sure).The slopes of each of thc aging curvcs shown in
Figure
5 arc similar indicating that aging rate is practically the sallle for specimens with diffcrcnt thicknesses. Similar agreement was shown by Sa~ldberg 151, who used scal- ing factors for aging of extruded polystyrcnc with dittcrcnt thickness.43. Non-Uniform Material
4.3.1. Core and Surjaci Lnyiprs q i fivtnrthtl 1't)lysryrctrc~ H o t ~ n l
I
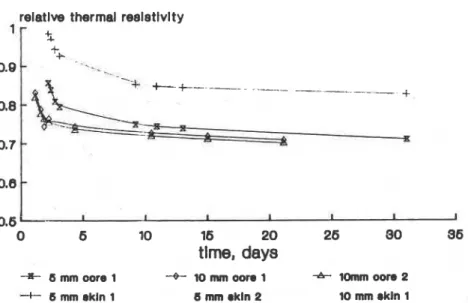
Another extruded polystyrene product was sliced into laycrs with 5- and 10-mm nominal thickness. The actual thickness of each laycr was corrected by subtracting 0.36 mm. Aging curvcs, recalculated to 5-mm thick laycrs, for material cut from different locations in the cross-section are shown in
0.6l
I I I I I I L L 1 I I I l l l l l t L I I I L U1
lo
100 lo00tlrne,
days
-+)- 6.0
mm
-A- 8.6 mm-+
11.8 mm - -1- . 18.8 mmrelatlve thermal reeletlvlty
-
t
--.
.-_
+
t t -+
0.8-
0.7 d 0.6 m 1 I I I L I 0 6 10 16 20 26 30 36time, days
+ 6 mm oore 1 -4- 10 rnm o o n 1 -A- 10mm o m 2 -+- 6 mm rkln 1 6 mm rkln 2 10 mm rkln 1FIGURE 6. Surface and core layers ofcxtrudcd polystyrcnc, ~ r o d u c t "A.3': against logarithtli o f scaled titllc.
Figure
6.All specimens display two stages of aging, although the first stage
(thermal drift) is very short.
~ e ~ a r d l e s i
of the large differences in thermal resistivity shown in Figure
6,
there is good agreement between the rates of aging at each stage, as dem-
onstrated by the similarity in the slopes of the aging curves. The actual
values of thermal rcsisitivity differ, however. Whereas specimens of the same
thickness show agreement when cut from one location, there are large dif-
ferences for core and surface layers. This difference for core and surface lay-
ers may be associated with a density variation in the cross-section of the
material. (Density change may affect both the initial CFC content and the
extinction of radiative heat transfer.) The average density of the core layers
was 34.8 kglm3. The density of 5-mm thick surface layers was 39.4 kglm3.
Thicker 10-tnm surface layers showed an intermediate density of 37.9 kglm3.
4..?.2. G ~ r c ntrd Sutjacc, Laycm lf A~lyisocyanuratc~ BoardAnother test series comprised four 8.45-mm thick sliccs of PIR board
after 400 days of storage under laboratory conditions; but they were cut
from different locations in the cross-section, i.e., from the middle core and
layers adjacent to surfaces. (The original surfaces of the board were removed
before the slices were cut.)
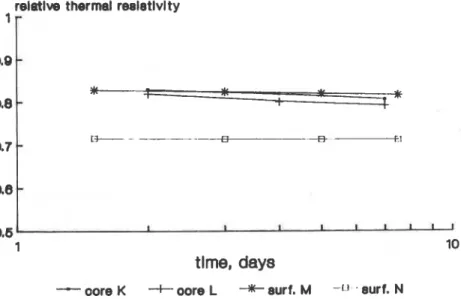
Figure 7 shows thermal rcsistivity as a function of logarithm of time for
the four slices. Again, thermal rcsistivity was exprcssed in dimensionless
relatlve thermal resletlvl ty
'
r
0.6 I I I I I I I l l
1 10
tlme,
days
-
oore K -I- oore L+
surf. M -1-1 . eurf. NFIGURE 7. Surface and core layers o f polyisocyanuratc, against logarithm o f time (no scaling applied).
form (fraction of the initial thermal resistivity value). Since all layers had
identical thickness, no scaling was applied. Results were obtained for three
specimens, two cores and one layer adjacent to the surface that showed good
agreement. They follow the same aging curve. The other surface layer, how-
ever, displays a different aging curve, and after
400 days appears to have
reached a plateau level. Although differences in thermal resistance of full-
thickness specimens cut from this PIR board were very small (standard devi-
ation of 1.l0/0) [3], one may infer a significant difference in material structure
at one of the board surfaces,
asdocumented by the difference in aging rate.
5. DISCUSSION
The scaling factor,
Sf,
depends on both the effective diffusion coefficients
and the second power of thickness. If the aging rates of the surface and corc
layers are similar, the scaling factor,
SL,
will depend on only the ratio of the
second power of the thickness. In this case, and providing that aging history
is known, scaling is easy to apply. Such cases are shown in Figures 4 and 5.
The non-uniform or layered structure of the material often prohibits use
of this simple scaling factor
SL.
Figure
6shows that aging of corc and surface
layers of extruded polystyrene differ. Figure 7 shows the existence of a spa-
tial variability in PIR board. One specimen from the surface layer shows
thermal performance much worse than the average for the board. Results
Sctilit!y F~ritors itr .qyiti,y qf'(;as-~~ilIcti (:cllrrl~ir 1'1,utirs 159
obtained o n other spccin~cns from this surface (not reported in this paper) confirni thc existence o f a systematic difference between both material sur- faces. Scaling factors cannot be used in these cases.
Thus, use o f scaling factors is limited to homogeneous and uniform mate- rials. As most of the currently manufactured board products are laminated and layered, more research is required t o extend the application o f scaling factors t o layered materials. Such an extension appears to be possible as soon as methods o f determining initial C F C concentration and effective diffusion characteristics o f skins and core material arc developed.
ACKNOWLEDGEMENTS
Deep gratitude is expressed to Gerry J. Theriault, John Lackey and Roger
G.
Marchand, w h o performed all the measurements reported here. This paper is a contribution from the Institute for Research in Construction, Na- tional Research Council o f Canada.REFERENCES
1. Kabayama, M. A. "Long-term Thcrmal Resistance Values of Cellular Plastic In- sulations," J. 77ri,rrnal Itis~rlatiotr, 10:286-300 (April 1987).
2. 130nlbcrg. M. and D. A. Brandrcth. "Evaluation of Long-Term Thermal Rcsis- tancc of Gas-Filled Foams: State-of-the-Art," ASTM STP No. 1003 (in print). 3. Bombcrg, M. "A Model of Aging of Gas-Filled Foams,"J. Cellular Plastics, 24:
327-347 (July 1988).
4. Isbcrg, J. "The Thcrnlal Conductivity of Polyurethane Foams:' Div. of Building Technology, Chalmcrs U of Tcchnology, Gothenburg, Swcdcn (1988). 5. Sandbcrg, P. I. "Deterioration of Thermal Insulation Propcrtics of Extruded
Polystyrcnc. Classification and Quality Control System in Sweden." To be pub- lished in ASTM STP on Thcrmal Insulation Conference Dcc 1987, Fla. 6. Carslaw, H. S. and J. C. Jacgcr. Conduction ofHeat in Solids, 0xford:Clarendon
Prcss, p. 97 (1959).
7. Kondraticv, G. M. "Ricgularnyj ticplowoj rczim," Moskva, Gos. Izd. Ticchniko- Ticoriticzcskoj Lit. (in Russian) (1954).
8. Shankland, I. R. "Gas Transport in Closed-Cell Foams,"Advancc,s in Foam Aging, lhl. 1. CAlSSA Ed., Yorklyn, Delawarc, pp. 60-88 (1986).
9. Norton, F. J. 'Thermal Conductivity and Life of Polymer Foams," J. Cellular Plastics, pp. 23-37 (Jan. 1967).
10. Ball, G. S., G. W. Hcalcy and J. B. Partington. "The Thermal Conductivity of Isocyanatc~Bascd Rigid Cellular Plastics: Performance in Practice," European J.
Cellular Plastics, pp. 50-62 (Jan. 1978).
1 1. Mullenkamp, S. P. and S. E. Johnson. "In-Place Thermal Aging of Polyurethane Foam Roof Insulations," 7th Conf. on Roofing Technology, 1983, NRCA. 12. Booth, R. J. "R-Value Aging of Rigid Urethane Foam Products,"Proceedings
