Publisher’s version / Version de l'éditeur:
Vous avez des questions? Nous pouvons vous aider. Pour communiquer directement avec un auteur, consultez la première page de la revue dans laquelle son article a été publié afin de trouver ses coordonnées. Si vous n’arrivez pas à les repérer, communiquez avec nous à [email protected].
Questions? Contact the NRC Publications Archive team at
[email protected]. If you wish to email the authors directly, please see the first page of the publication for their contact information.
https://publications-cnrc.canada.ca/fra/droits
L’accès à ce site Web et l’utilisation de son contenu sont assujettis aux conditions présentées dans le site LISEZ CES CONDITIONS ATTENTIVEMENT AVANT D’UTILISER CE SITE WEB.
Physical Review. B, Condensed Matter and Materials Physics, 82, 3, pp.
033301-033304, 2010-07-12
READ THESE TERMS AND CONDITIONS CAREFULLY BEFORE USING THIS WEBSITE. https://nrc-publications.canada.ca/eng/copyright
NRC Publications Archive Record / Notice des Archives des publications du CNRC :
https://nrc-publications.canada.ca/eng/view/object/?id=9d61c912-ceea-46b1-bc86-3be2235aaa6c
https://publications-cnrc.canada.ca/fra/voir/objet/?id=9d61c912-ceea-46b1-bc86-3be2235aaa6c
NRC Publications Archive
Archives des publications du CNRC
This publication could be one of several versions: author’s original, accepted manuscript or the publisher’s version. / La version de cette publication peut être l’une des suivantes : la version prépublication de l’auteur, la version acceptée du manuscrit ou la version de l’éditeur.
For the publisher’s version, please access the DOI link below./ Pour consulter la version de l’éditeur, utilisez le lien DOI ci-dessous.
https://doi.org/10.1103/PhysRevB.82.033301
Access and use of this website and the material on it are subject to the Terms and Conditions set forth at
Deterministic emitter-cavity coupling using a single-site controlled
quantum dot
Dalacu, Dan; Mnaymneh, Khaled; Sazonova, Vera; Poole, Philip J.; Aers,
Geof C.; Lapointe, Jean; Cheriton, Ross; SpringThorpe, Anthony J.;
Williams, Robin
Deterministic emitter-cavity coupling using a single-site controlled quantum dot
Dan Dalacu,
*
Khaled Mnaymneh, Vera Sazonova, Philip J. Poole, Geof C. Aers, Jean Lapointe, Ross Cheriton, Anthony J. SpringThorpe, and Robin WilliamsInstitute for Microstructural Sciences, National Research Council, Ottawa, Canada K1A 0R6 共Received 4 May 2010; revised manuscript received 27 May 2010; published 12 July 2010兲
Site-selective epitaxy is used to deterministically control the nucleation site of a single quantum dot. A photonic crystal cavity is fabricated at the dot site for a true single quantum dot-cavity system which, by design, contains no background emitters. Cavity tuning at fixed temperature is used to measure the dot-cavity coupling over a large共⬎15 meV兲 detuning range using nonresonant excitation. The low-excitation spectra are modeled using a master equation model based on incoherent excitation. We find that pure phonon dephasing alone does not account for the observed nonresonant cavity emission and an additional cavity feeding mecha-nism, consistent with phonon-assisted dot-cavity coupling, must be included to reproduce the experimental spectra.
DOI:10.1103/PhysRevB.82.033301 PACS number共s兲: 73.21.La, 78.67.Hc
Efficient sources of single photons and entangled photon pairs are required for applications in quantum information processing and quantum key distribution as well as for fun-damental experiments that test the foundations of quantum mechanics.1–3Quantum dots, coupled to semiconductor mi-crocavities, are viewed as a promising solid-state implemen-tation of a nonclassical light source. A decade after the first realization of a coupled single dot-cavity system,4,5 fabrica-tion of devices is becoming increasingly routine6–12 and ad-ditional experiments consistently point to differences be-tween quantum dots and their atomic counterpart, in particular, the role of the environment in the solid state.
In the atomic case, emission is mainly peaked at the emit-ter energy regardless of detuning and there is no cavity mode emission when there is negligible overlap between the dot and cavity linewidths. In the solid state, one observes non-resonant emitter-cavity coupling6,7 even for significant detunings.8,9 Nonresonant cavity emission is predicted from fast dephasing processes,13–15 multiexciton transitions,9 and exciton-phonon coupling16 and is expected to be dependent on excitation type and rate, electron-phonon interactions, charge fluctuations, etc. Nonresonant coupling has major im-plications for quantum information processing10,15 and one needs to understand the physics responsible for the optical response of these solid-state emitter-cavity systems. For ex-periments targeted at coupling single quantum dots to local-ized cavity modes, complications arise due to the statistical nature of the quantum dot self-assembly process; it is simply difficult to control where individual quantum dots are lo-cated. Cavity feeding from background emitters7 masks the very processes that one would like to investigate.
In this Brief Report, we study dot-cavity coupling using devices based on site-controlled quantum dots.17Direct con-trol of the nucleation site of the dot provides systematic spa-tial matching for true scalability, in contrast to deterministic approaches18–20based on registration of randomly nucleated dots. The devices studied here are single-dot devices by de-sign and one can unambiguously rule out the presence of background emitters. Using photonic crystal cavities, we study the dot-cavity coupling for detunings up to 15 meV. Spectral matching is achieved without adjusting the sample temperature,21,22 thereby eliminating the tuning dependence of electron-acoustic phonon interactions.7,10,11The measured
spectra are analyzed using a master equation theory relevant for incoherent excitation.23 We find that pure dephasing alone does not account for the observed nonresonant cavity emission near resonance, and an additional cavity feeding mechanism, consistent with phonon-assisted coupling, is re-quired to reproduce the measured spectra. In contrast to pre-vious results8,9 no cavity emission is observed at low-excitation powers for detunings ⬎5 meV, suggesting that cavity feeding from multiexciton transitions does not play a role in these experiments. We also explicitly show the influ-ence of phonon interactions on the nonresonant dot-cavity coupling using temperature-dependent measurements at con-stant detuning.
A schematic of the device is shown in Fig.1共a兲. Quantum dot site control is achieved through selective-area epitaxy24 which is used to direct the self-assembly process in the InAs/ InP quantum dot material system. The fabrication process
(a) (b) 5 10 15 20 25 Po w e r [u W ] s-shell p-shell d-shell 30 25 20 15 10 XX L In te n si ty (a rb . u n it s) X P o w e r (µ W ) 50µeV 815 820 825 830 835 840 845 850 855 860 30 Energy (meV) 5 820 822 824 826 828 830 P L Energy (meV) (c)
FIG. 1. 共Color兲 共a兲 Schematic of the site-controlled single dot-cavity device.共b兲 SEM images of device at different stages of fab-rication. Top left: plan view of an uncapped InP pyramid showing the InAs quantum dot on the共001兲 top facet. Bottom left: oblique view of a capped InP pyramid. Right: cross-section of the photonic crystal cavity. Scale bars for left共right兲 images are 100 nm 共1 m兲. 共c兲 Excitation spectra of a site-controlled quantum dot showing bound s, p, and d orbitals. The inset shows a representative low excitation spectrum.
involves nucleation of a single InAs quantum dot at the apex of an InP pyramid as shown in the scanning electron micros-copy共SEM兲 image in Fig.1共b兲. The pyramid is grown on a SiO2patterned InP wafer with a thin InP buffer layer over a 1 m thick lattice matched InAlAs sacrificial layer. The pyramid is in registry with alignment marks etched into the substrate, allowing fabrication of a two-dimensional 共2D兲 photonic crystal membrane nanocavity with an optical defect precisely positioned at the quantum dot. An alignment preci-sion of better than 50 nm is determined from SEM images on test structures. Individual dots are characterized prior to cav-ity fabrication, allowing for the cavcav-ity design to be tailored to each dot. Figure 1共c兲 shows typical power-dependent spectra from a site-selected quantum dot. We note the ab-sence of background emitters: the spacing of pyramids is arbitrary and, for the samples studied here, is set to 200 m. A low pump power emission spectrum using above band-gap excitation shows only a single peak over the entire spectral range available to our spectrometer/detector setup, = 1.1– 1.7 m.
Cavity fabrication involves planarization of the InP pyra-mid, dry etching of the holes and wet etching of the InAlAs sacrificial layer to release the resulting membrane. The cav-ity design is based on a modified single missing hole defect25 that is robust against process- and tuning-induced variations of the cavity geometry, with Q-values of 10 000– 15 000.26 Optical measurements are done at 4.2 and 40 K in a continu-ous flow helium cryostat using nonresonant, above band-gap excitation through a 50X microscope objective 共N.A. = 0.42兲. The photoluminescence 共PL兲 is collected by the same objective, dispersed using a single grating spectrometer and detected using a liquid nitrogen cooled InGaAs array.
For spectral matching of the dot and cavity, a two-step process is used: 共i兲 coarse cavity tuning to high energy fol-lowed by 共ii兲 fine tuning to low energy. The as-fabricated cavity is designed with the mode on the low energy side of the dot emission. The cavity is tuned through resonance in 1.7 meV steps using a digital wet etching technique which
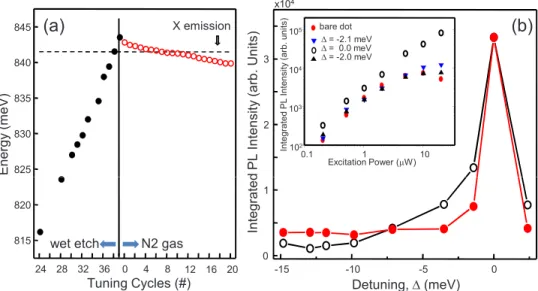
involves sequential cycles of InP native oxide growth and subsequent removal.21The cavity is then tuned back through resonance in arbitrarily fine steps using inert gas condensation.22 Figure 2共a兲 shows the tuning process for a dot emitting at 842 meV. The as-fabricated cavity mode en-ergy was well below 800 meV. Pumping at saturation, P = Psat, it takes 24 wet etch cycles for the cavity mode to
appear at 816 meV and a total of 39 cycles to take the cavity one cycle past the dot emission. From higher energy the cavity is tuned back though the dot by condensing N2gas on the surface of the crystal with the size of the tuning steps dictated by the volume of gas condensed per cycle. For the case shown in Fig. 2共a兲, the cavity was tuned back to 840 meV in 100 eV steps.
The integrated PL intensity of the dot and cavity emission for different wet etch cycle number, plotted as a function of dot-cavity detuning, is shown in Fig. 2共b兲 for excitation at saturation, P = Psat. The dot emission remains approximately
constant for large detunings, the intensity dictated by vertical background radiation leakage into modes above the light line.27At zero detuning, dot-cavity coupling is evident from the enhanced dot emission. A second signature of coupling is the modification of the saturation behavior of the dot near resonance shown in the inset of Fig. 2共b兲. Already at detun-ings of ⫾2 meV, the onset of saturation of the exciton tran-sition has started to shift to higher excitation powers from a cavity-mediated reduction in lifetime28 while at zero detun-ing there is no sign of saturation for the largest excitation powers used. The significant cavity mode emission observed for detunings up to ⌬ = 10 meV is not associated with the ground state emission, but rather with cavity feeding from multiexciton complexes29 共biexciton and transitions associ-ated with population of the p shell兲 and concomitant emis-sion lines which appear around the ground state at high ex-citation rates, see Fig.1共c兲.
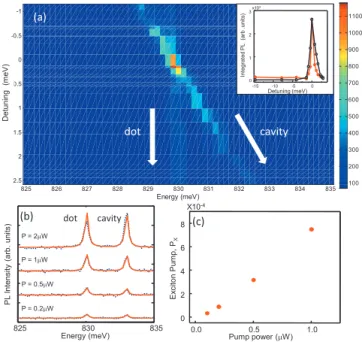
PL spectra as a function of N2 tuning are shown as a contour plot in Fig. 3共a兲for a dot emitting at 830 meV. In this case, the excitation power is well below saturation, P 825 830 835 840 845 E n e rg y (me V) X emission
(a)
0.1 1 10 102 103 104 105 In te g ra te d P L In te n si ty (a rb . u n it s) Excitation Power (µW) bare dot ∆ = -2.1 meV ∆ = 0.0 meV ∆ = -2.0 meV 2 3 d PL In te n si ty (a rb . U n it s) x104(b)
24 28 32 36 0 4 8 12 16 20 815 820 wet etch Tuning Cycles (#) N2 gas -15 -10 -5 0 0 1 In te g ra te d Detuning, ∆ (meV)FIG. 2. 共Color online兲 共a兲 Cavity mode energy during tuning. 共b兲 Integrated PL intensity of the cavity 共open black circles兲 and dot 共filled red circles兲 versus detuning. Inset shows the power-dependent integrated PL intensity of the dot prior to cavity fabrication 共bare dot兲 and for the dot-cavity system near and at resonance.
BRIEF REPORTS PHYSICAL REVIEW B 82, 033301共2010兲
= 0.02Psat, to avoid cavity feeding from higher level
excita-tions, and no cavity emission is observed for detunings greater than 5 meV共see inset兲 as one would expect if there are no extraneous pumping mechanisms. To model the spec-tra we have used the master equation formalism of Yao et
al.23共see also Laussy et al.30兲 which describes the emission from a coupled dot-cavity system under incoherent excita-tion. The total spectrum is divided into emission via radiation modes above the light line, Sr, and emission from the leaky
cavity, Sc: Sc共兲 = ⌫c Re
冋
i具aˆ†aˆ典D共兲 C共兲D共兲 − g2+ ig具aˆ†ˆ−典 C共兲D共兲 − g2册
共1兲 Sr共兲 = ⌫x Re冋
i具aˆ†aˆ典C共 兲 C共兲D共兲 − g2+ ig具ˆ+aˆ典 C共兲D共兲 − g2册
, 共2兲 where C共兲 =−c+ i 2⌫c and D共兲 =−x+ i 2共2Px+ ⌫x+ ⌫x
⬘
兲. c andxare the cavity and dot resonancefrequen-cies, respectively, ⌫cis the decay rate of the cavity, ⌫xand ⌫x
⬘
are the exciton radiative decay and pure dephasing rates, respectively, and g is the dot-cavity coupling rate. aˆ repre-sents the cavity mode operator andˆ+/−
are the Pauli opera-tors of the exciton. The steady-state solutions for the exciton population,具ˆ+ˆ−典, the cavity photon population, 具aˆ†aˆ典, and the cross-term,具aˆ†ˆ−典, are given by:
具aˆ†aˆ典 = g2⌫共P x+ Pc兲 + Pc共2Px+ ⌫x兲
冋
⌫2 4 + ⌬ 2册
g2⌫共2Px+ ⌫x+ ⌫c兲 + ⌫c共2Px+ ⌫x兲冋
⌫2 4 + ⌬ 2册
共3兲 具aˆ†ˆ−典 = − ig冉
具aˆ†aˆ典 − Px 2Px+ ⌫x冊
冋
i⌬ +⌫ 2册
⌫2 4 + ⌬ 2 + g 2⌫ 2Px+ ⌫x 共4兲 具ˆ+ˆ−典 =Px+ ig共具aˆ†ˆ−典 − 具aˆˆ+典兲 ⌫x+ 2Px , 共5兲where ⌫ = 2Px+ ⌫x+ ⌫x
⬘
+ ⌫c. Pxand Pcare the incoherentex-citon and cavity pump rates, respectively, and ⌬ =c−x.
The total emission spectrum is given by the sum
Stot共r,兲 = Fr共r兲Sr共兲 + Fc共r兲Sc共兲, 共6兲
where Fr and Fc are geometric factors determined by the
collection optics for the emission into radiation and cavity modes, respectively.
We first estimate the ratio Fr/Fcby fitting spectra pumped
at different excitation powers when the dot-cavity system is significantly detuned 共⌬ = 3 meV兲. We note that the mea-sured cavity and dot linewidths are instrument-limited at 250 eV. We do not use the resolution-limited linewidths, but rather, use the measured linewidths of test structures measured on higher resolution spectrometers, and include the
P L In te n s it y (a rb . u n it s ) cavity dot (a) P L In te n si ty (a rb . u n it s) 40K 4K cavity dot 825 830 835 Energy (meV) (b) 830.0 830.1 830.2 830.3 830.4 E x ci to n e n e rg y (m e V ) -1 0 1 2 3 Detuning, ∆ (meV) (c) -4 -2 0 2 4 Energy-ωx(meV) Pc / Px Detuning, ∆ (meV) 0.0 0.1 0.2 0.3 0.4 -1 0 1 2 3
FIG. 4. 共Color online兲 Fits 共red curves兲 of Eq. 7 applied to low pump spectra 共dotted blue curves兲 for detunings available to N2
condensation. Inset shows spectra for ⌬ = 1 meV at 4 K共40 K兲 and model fits using ⌫x⬘= 50 eV共⌫x⬘= 575 eV兲. 共b兲 Incoherent cavity
pump rates, Pc/Px, extracted from共a兲. 共c兲 Detuning-dependent shift
of the exciton transition energy. -1 -0.5 0 0.5 1 1.5 2 2.5 D e tu n in g [m e V ] 100 200 300 400 500 600 700 800 900 1000 1100 dot cavity (a) -15 -10 -5 0 0 1 2 3 In te g ra te d P L (a rb .u n it s ) Detuning (meV) x103 D e tu n in g (m e V ) 0.0 0.5 1.0 0 2 4 6 8 825 826 827 828 829 830 831 832 833 834 835 Energy (meV) 100 825 830 835 P = 0.2µW P = 0.5µW P = 1µW P = 2µW Energy (meV) P L In te n si ty (a rb . u n it s) (b) dot cavity E x ci to n P u m p , PX Pump power (µW) (c) X10-4
FIG. 3.共Color兲 共a兲 Low pump power PL spectra tuned using N2.
Inset shows the integrated intensity of the cavity 共open black circles兲 and dot 共filled red circles兲 over the entire detuning range. 共b兲 Measured 共dotted blue curves兲 and fit 共red curves兲 excitation-dependent emission spectra for ⌬ = 3 meV. 共c兲 Incoherent pump rate dependence on experimental power extracted from共b兲.
resolution limit in the model. ⌫cis set to 100 eV which is
a conservative estimate based on test structures fabricated using dot ensembles.26 ⌫x
⬘
is set to 50 eV, which is the typical measured linewidth of the site-controlled InAs/InP dots关see inset, Fig.1共c兲兴. We note that the measurements can be done at 30 K, where the dot-linewidth increases to 250 eV and is no longer resolution-limited, and our find-ings are the same. We also note that these parameters put the system into the strong coupling regime, however we do not expect to spectrally resolve the anticrossing given the dot-cavity coupling rate, g共see below兲.⌫xis set to 2 eV from lifetime measurements on
site-controlled InAs/InP dots 共⬃ 1 ns兲 and only g, Px, and the
ratio Fr/Fc are varied. There is no need to include a cavity
pump contribution for this large detuning to reproduce the experimental spectra; the non-resonant cavity emission is fully described by a dephasing rate of ⌫x
⬘
= 50 eV. Theex-cellent fit to the data is shown in Fig. 3共b兲 from which a value of Fr/Fc= 1 / 10 is obtained. This procedure also allows
us to calibrate the experimental excitation rate in terms of Px
关Fig.3共c兲兴 used in all subsequent fits.
To fit the spectra for different detunings, ⌬ is first deter-mined for each spectrum, then only g and Pcare varied
glo-bally共they are applied to all tuning spectra simultaneously兲. This approach gives excellent agreement only if it is applied separately for large and small detunings. A global fit of Pc
overestimates the cavity emission for ⌬ ⲏ 2 meV while set-ting Pc to 0 underestimates the cavity emission for ⌬
ⱗ 2 meV. As mentioned above, at large detunings Pcis
nec-essarily small. For ⌬ ⱗ 2 meV, however, the spectra are re-produced by the model only by including a cavity pump contribution of Pc/Pxof⬃0.4. In order to fit the entire
tun-ing range Pc is set as a detuning-dependent parameter and
only g is varied globally. The resulting fits are shown in Fig. 4共a兲from which g = 130 eV, indicating good spatial match-ing and is typical of the half dozen dot-cavity samples mea-sured. The extracted Pcvalues as a function of detuning are
plotted in Fig.4共b兲. Note that Pcis fit only for detunings for
which the emission doublet is resolved,兩⌬兩 ⬎ 300 eV 关out-side the shaded region in Fig. 4共b兲兴 to avoid correlations between fit parameters. This near-resonance cavity pump term represents a cavity feeding mechanism that is in addi-tion to that expected from a pure dephasing.10,11The spectral range over which this dot-cavity coupling is important is consistent with cavity feeding based on phonon-assisted tran-sitions from the exciton to the cavity.16
Using the ability to tune independently of temperature, measurements were made of the same dot-cavity sample at 40 K and a detuning ⌬ = 1 meV. The 4 and 40 K spectra are shown in the inset of Fig.4共a兲. The increase in cavity emis-sion at the elevated temperature provides proof of the role of phonon-mediated cavity feeding, both pure dephasing10,11 and exciton-phonon coupling16on the nonresonant dot-cavity coupling. The enhanced cavity emission is consistent with the predictions of Eq. 共6兲 and the 40 K spectrum is repro-duced with no fitting parameters, the dephasing rate is sim-ply increased to ⌫x
⬘
= 575 eV, in direct correspondence withthe experimental linewidth.
As a final remark, we note the detuning-dependent shift of the exciton transition energy observed in Fig. 4共a兲. This is not reproduced by Eqs.共1兲 and 共2兲 but has been added as part of the fit of the detuning. The origin of this shift, which amounts to ⬃300 eV at resonance 关Fig. 4共c兲兴 is unclear, but maybe related to cavity-exciton attraction described in Ref. 31.
In conclusion, we have studied the dot-cavity coupling using a site-controlled single quantum dot coupled to a pho-tonic crystal microcavity. We show that the non-resonant cavity emission cannot be described by pure dephasing only, but requires an additional feeding mechanism consistent with a phonon-mediated process that relies on a combined effect of exciton-cavity and exciton-phonon couplings.
This work was partially supported by the Natural Science and Engineering Research Council and Quantumworks.
1E. Knill et al.,Nature共London兲 409, 46 共2001兲. 2A. Beveratos et al.,Phys. Rev. Lett. 89, 187901共2002兲. 3
P. Hawrylak and M. Korkusiński, Nonlinear Opt. 29, 329 共2002兲.
4P. Michler et al.,Science 290, 2282共2000兲. 5C. Santori et al.,Nature共London兲 419, 594 共2002兲. 6K. Hennessy et al.,Nature共London兲 445, 896 共2007兲. 7D. Press et al.,Phys. Rev. Lett. 98, 117402共2007兲. 8M. Kaniber et al.,Phys. Rev. B 77, 161303共R兲 共2008兲. 9M. Winger et al.,Phys. Rev. Lett. 103, 207403共2009兲. 10S. Ates et al.,Nat. Photonics 3, 724共2009兲.
11
J. Suffczyński et al.,Phys. Rev. Lett. 103, 027401共2009兲. 12A. Laucht et al.,Phys. Rev. Lett. 103, 087405共2009兲. 13A. Naesby et al.,Phys. Rev. A 78, 045802共2008兲. 14M. Yamaguchi et al.,Opt. Express 16, 18067共2008兲. 15A. Auffèves et al.,Phys. Rev. A 79, 053838共2009兲. 16U. Hohenester,Phys. Rev. B 81, 155303共2010兲.
17D. Chithrani et al.,Appl. Phys. Lett. 84, 978共2004兲. 18A. Badolato et al.,Science 308, 1158共2005兲. 19K. H. Lee et al.,Appl. Phys. Lett. 88, 193106共2006兲. 20A. Dousse et al.,Phys. Rev. Lett. 101, 267404共2008兲. 21D. Dalacu et al.,Appl. Phys. Lett. 87, 151107共2005兲. 22S. Mosor et al.,Appl. Phys. Lett. 87, 141105共2005兲. 23P. Yao et al.,Phys. Rev. B 81, 033309共2010兲. 24D. Dalacu et al.,Laser Photonics Rev. 4, 283共2010兲. 25O. J. Painter et al.,J. Lightwave Technol. 17, 2082共1999兲. 26J. Devenson et al.,Appl. Phys. Lett. 89, 191115共2006兲. 27S. Hughes and P. Yao,Opt. Exp. 17, 3322共2009兲. 28E. M. Purcell,Phys. Rev. 69, 37共1946兲.
29M. Korkusinski et al., M. Zielinski, and P. Hawrylak, J. Appl. Phys. 105, 122406共2009兲.
30F. P. Laussy et al.,Phys. Rev. Lett. 101, 083601共2008兲;Phys. Rev. B 79, 235325共2009兲; E. del Valle et al.,ibid. 79, 235326 共2009兲.
31T. Tawara et al.,Opt. Express 18, 2719共2010兲.
BRIEF REPORTS PHYSICAL REVIEW B 82, 033301共2010兲