HAL Id: hal-02742630
https://hal.inrae.fr/hal-02742630
Submitted on 17 Nov 2020
HAL is a multi-disciplinary open access
archive for the deposit and dissemination of
sci-entific research documents, whether they are
pub-lished or not. The documents may come from
teaching and research institutions in France or
abroad, or from public or private research centers.
L’archive ouverte pluridisciplinaire HAL, est
destinée au dépôt et à la diffusion de documents
scientifiques de niveau recherche, publiés ou non,
émanant des établissements d’enseignement et de
recherche français ou étrangers, des laboratoires
publics ou privés.
Infering an ontology of single cell motions from
high-throughput microscopy data
Alice Schoenauer Sebag, Sandra Plancade, Céline Raulet-Tomkiewicz, Robert
Barouki, Jean-Philippe Vert, Thomas Walter
To cite this version:
Alice Schoenauer Sebag, Sandra Plancade, Céline Raulet-Tomkiewicz, Robert Barouki, Jean-Philippe
Vert, et al.. Infering an ontology of single cell motions from high-throughput microscopy data. IEEE
12th International Symposium on Biomedical Imaging, Apr 2015, New York, United States. pp.4,
�10.1109/ISBI.2015.7163840�. �hal-02742630�
INFERING AN ONTOLOGY OF SINGLE CELL MOTIONS
FROM HIGH-THROUGHPUT MICROSCOPY DATA
Alice Schoenauer Sebag
⋆†♯Sandra Plancade
♭C´eline Raulet-Tomkiewicz
†Robert Barouki
†Jean-Philippe Vert
⋆Thomas Walter
⋆⋆
MINES ParisTech, PSL-Research University, CBIO-Centre for Computational Biology,
Institut Curie (Paris), and U900 (INSERM, Paris), France
†
UPD Univ Paris 05 (Paris) and UMR-S 1124 (INSERM, Paris)
♭Math´ematiques et Informatique Appliqu´ees (INRA, Jouy-en-Josas)
♯Agro ParisTech (Paris)
ABSTRACT
Cellular motility is a fundamental biological process. Progress in the fields of gene silencing and high-throughput (HT) mi-croscopy provide us with the tools to study its molecular basis and potential perturbators.
The primary contribution of this paper is to present MotIW, a generic workflow for single cell motility study in HT time-lapse screening data. We successfully apply it to a simulated screen, as well as a genome-wide screen. Fur-thermore, MotIW enables the identification of eigth motility patterns into which all trajectories from this dataset divide up into, without any prior model of cell motion.
Index Terms— High-content (high-throughput) screen-ing, pattern recognition and classification, data mining
1. INTRODUCTION
Cell motility plays a key role in many physiological processes including embryonic development or immune response, and is also involved in tumor invasion and metastasis. It is a com-plex cellular process, regulated by many genes in multiple signaling pathways.
Many assays have been specifically designed to study cell migration mechanisms They typically consist in a perturba-tion (e.g. gene overexpression or downregulaperturba-tion) and a mea-sure of the resulting phenotype in terms of cellular motil-ity. Examples include analysis of cell traces on coated lay-ers while overexpressing genes of interest [1], wound heal-ing assays for the investigation of gene silencheal-ing effect on cell population migratory behaviour [2], or cell tracking in low-throughput time-lapse experiments while silencing key genes [3]. However, a systematic study of single cell motility has not yet been performed at a genome-wide scale.
Thomas Walter has received funding from the European Community’s Seventh Framework Programme (FP7/2007-2013) under grant agreements number 258068 (Systems Microscopy). This work was partially funded by grant SMAC-ERC-280032 of the European Research Council.
The contribution of this paper is to present MotIW (Motility study Integrated Workflow), and its application to motility gene discovery. A generic methodological frame-work, MotIW enables to quantitatively study cell motility at single cell resolution in HT data. It consists of cell tracking, cell trajectory mapping to an original feature space, and out-lier experiment detection (cf figure 1). We show the power of our method by applying MotIW to simulated data, which allows us to estimate recall and precision to be expected on real data. We then apply this workflow to a previously pub-lished genome-wide RNAi1screen, the Mitocheck dataset. It is composed of 200,000 videos of human cell populations, each of them showing the outcome of a single gene knock-down [4]. We thus identify a list of genes whose silencing impacts cell motility and which therefore might play a role in this process. On top of that, MotIW also produces an on-tology of cell trajectories in this dataset: without any prior assumption on cell motion, we are able to identify eight types of cell trajectories. The remainder of this paper is organized as follows : Section 2 gives a brief presentation of MotIW, and Section 3 discusses its application to simulated data and the Mitocheck screen.
2. WORKFLOW OVERVIEW
In this section, we present MotIW, our workflow for the automatic and quantitative analysis of video sets from time-lapse microscopy-based screens. Figure 1 summarizes its different steps. Briefly, for each video, object segmentation and features are extracted using methods we have previously published and which are implemented in Cell Cognition2[5]. Cells are tracked using a new machine-learning based track-ing procedure, described in section 2.1 . The trajectories
1RNA interference: a technique which uses small interfering RNA
(siRNA) for gene silencing.
2An open-source software, developed in collaboration with the IMBA
Fig. 1. Overview of MotIW. Images are acquired and segmented. Object features are extracted, which are used for cell tracking.
Trajectory feature distributions enables to detect if cell motility was modified by chemical exposure. are then mapped to a feature space described in section 2.2.
Presented in section 2.3, an original statistical procedure then enables the detection of experiments in which single cell motility is significantly different than that in control movies.
2.1. Cell tracking
Cell tracking faces several challenges in videos from high content screens like Mitocheck, such as high phenotypic inter-cell variability. Furthermore, the algorithm has to han-dle apparitions, disparitions, divisions and fusions3. Finally, to be applicable in a screening context, as little prior knowl-edge as possible shall be used regarding cell motion. There-fore, we have extended a non-parametric structured learning approach from [6].
The extended model works as follows : each object in each image is characterized by its position, its orientation and a set of 230 features including geometric, shape and texture features [5]. In this approach, the tracking model matches ob-jects in consecutive frames by assigning them the most likely behaviour in the set of possible matching events
E = {move, appear, disappear, split, merge}. The optimal matching is defined as the one that maximizes a likelihood function, which depends on match features and on weights for each feature. This results in a bi-partite graph matching prob-lem; it is solved by an integer linear program. The weights are learned by a support vector machine using annotated tra-jectories, following the formulation of [6].
The extension compared to [6] lies in the choice of match features. Furthermore, we enabled the tracking model cali-bration using partial annotation from different experiments. Finally, the original work took neither three object-split, nor three object-merge into account. We added these possibilities to the set of matching events: they are important in a screen-ing context, where aberrant cell divisions may occur.
To validate MotIW’s cell tracking procedure, we compare it to Cell Cognition’s constrained nearest-neighbour (CNN) tracking algorithm, and to [7] as implemented in Cell Profiler, on a training set with approximately 32,000 matches. The lat-ter come from both control experiments and experiments with significantly altered phenotypes according to [4]. As shown in Table 1, MotIW outperforms the other two methods.
3This event results from occlusion or segmentation errors.
Algorithm Mean recall (%) Mean precision(%)
CNN 72.7 62.8
Jaqaman et al. [7] 78.3 73.0
MotIW 91.1 91.5
Table 1. Mean recall and precision on all types of matches E
(10-fold cross-validation)
2.2. Trajectory features
Once cell trajectories are captured, we extract a set of 15 fea-tures from each trajectory. Robust and precise feafea-tures are needed to account for the partial stochasticity of cell migra-tory behaviour. We use three types of features, as illustrated in table 2.
On top of classical features such as mean squared dis-placement, we have designed features to quantify the tem-porary straightness of a track and the propension of a cell to go from random walk to directed motion. The feature ”track curvature” measures temporally local similarity to a line, whereas the feature ”diffusion adequation” quantifies how well a diffusive model applies to the track. The feature ”movement type” is the power to which time relates to trav-eled distance [8]. All formulae will be detailed in a longer article about the workflow.
Goal Examples of feature
Particle motion features Diffusion coefficient, movement type
Other global features Track curvature
Averaged local features Mean squared displacement, mean signed turning angle
Table 2. Feature types with examples
2.3. Statistical procedure
HT screening data is organized in batches of experiments which have been performed simultaneously. Each batch in-cludes a set of negative controls.Due to a non-negligible batch effect, an experiment can only be compared with controls of the same batch in most of the cases.
Let us consider an experiment i. Following to trajec-tory feature extraction, it can be summarized as a set of
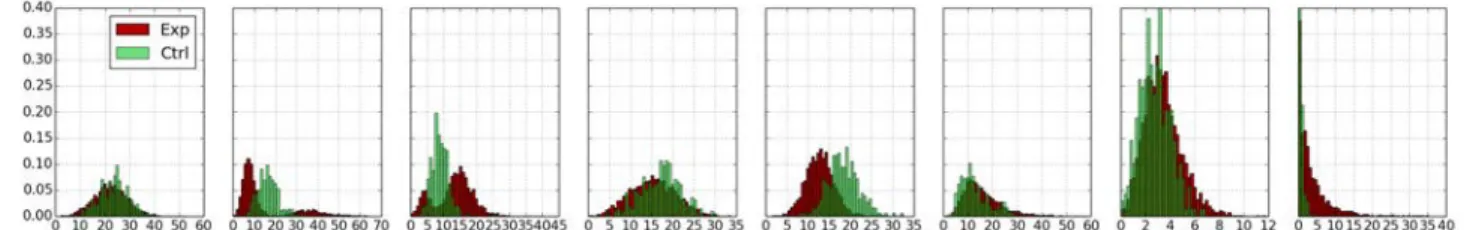
fea-Fig. 2. Comparison of cluster distributions between controls (Ctrl) and experiments (Exp) for the eight trajectory clusters which
were identified in the Mitocheck dataset. The clusters are in the same order as in figure 3.
ture distributions. The comparison of these distributions with those of controls from the same batch Bi, using Kolmogorov-Smirnov 2-sample test, provides a list of p-values.
A final statistic Si combining the p-values of all features is obtained by Fisher’s formula:
Si= −2Pf eaturefln(p-val[f ])
As the features are not independent, Fisher’s combined prob-ability test cannot be directly used. Instead, the same statis-tic is computed by comparing one control experiment from Bi which was not used in the previous comparison, to the other controls from Bi. Then, the comparison of the distribu-tion of S statistics obtained from control-experiment compar-isons, to the distribution of S statistics obtained from control-control comparisons, will permit the computation of empiri-cal p-values. It enables to detect hit experiments with regard to single cell motility. False discoveries are controlled us-ing the Benjamini-Hochberg procedure [9]. An experimental condition, i.e. a siRNA, is detected if more than 50% condi-tion replicates are detected.
3. RESULTS
We first evaluate MotIW on simulated data (see 3.1). We then apply it to the whole genome-wide screen Mitocheck [4], which enables us to identify an ontology of 2D cell trajecto-ries (see section 3.2). In this latter screen, each gene was tar-geted by three different siRNAs, and each experimental con-dition was tried in triplicate.
3.1. Application to a simulated screen
In a first step, three simple types of cell trajectories were de-signed: random, fast-random, curbed-directed, and two more complex ones: one in which cells alternate straight-directed motion in±180◦directions, and one in which cells alternate between random and straight-directed motion.
In a second step, five experimental condition types were designed, each with different trajectory type distributions. ”Normal” movies account both for control movies and ex-periments in which cell motility is similar to that of controls. They contain 80% of random trajectories, and a mix of the
four other trajectory types. This reflects our observation that in real data, all movies contain all possible types of cell trajectories (see fig. 2). All other condition types contain from 50 to 65% random trajectories, the rest being completed according to the movie type. For example, condition type ”fast” is composed of 30% of fast-random trajectories, 60% of random trajectories, and a mix of the three other trajectory types. The number of trajectories in each movie was drawn at random in real data, and the number of trajectory of each type in each movie was drawn from the corresponding movie type multinomial distribution.
The third step was the simulation of approximately 50,000 experimental conditions (distributed on 130 plates). Each condition was simulated in three separate experiments, as in a plausible experimental setup. On each plate, between 5% and 15% of the experiments were selected to be other than ”nor-mal” movies. Our workflow successfully recognized more than 98% of the experiments, as detailed in table 3.
Recall (%) Precision (%) Experiment detection 99.2 98.9 Condition detection 99.5 100.0 Trajectory clustering 91.4 ± 2.1 89.4 ± 4.8
Table 3. Results from the application of MotIW to simulated
data
Our simulation pipeline was also used to estimate how useful our trajectory feature set is to capture the differences between different types of trajectory motion. Hence, we also simulated 500 samples of each of the trajectory types and ex-tracted their features. We then applied k-means to this data set. Due to the fact that many simulation parameters (e.g. each track length) are chosen at random, and that k-means’ results are depending on its initialization, we repeated this procedure 10 times. The results are presented in table 3.
3.2. Application to the Mitocheck dataset
When we applied MotIW to the Mitocheck dataset, we were able to identify the experiments which significantly deviate from control movies (5%; 7, 153 out of 144, 909). It amounts to1, 180 genes (out of 17, 816), some of which are known to
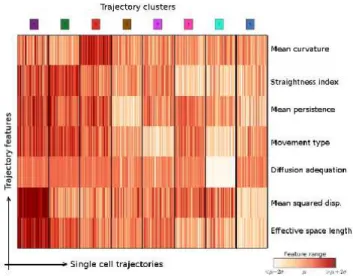
Fig. 3. Characterization of our ontology of trajectories. Each
column is a single cell trajectory ; trajectories are grouped by cluster label. 1,000 trajectories were randomly selected per trajectory cluster.
be involved in cellular motility, such as RhoA (Ras homolog family, member A) or CDK5 (cyclin-dependent kinase 5).
Prior to MotIW’s design was the question to know whether there exists an ontology of cell trajectories. We could not obtain any valuable clustering from pooling trajectories from the whole dataset, as measured by how the silhouette score and cluster cohesion index vary with respect to the num-ber of clusters [10]. The approach proved successful when pooling trajectories from MotIW’s detected experiments, as this smaller dataset is enriched in rare trajectories.
It enabled us to identify eight clusters. Each column of fig. 3 corresponds to one cell trajectory, for which the rows show the standard scores of a subset of features. Interestingly, there is more than speed for differenciating trajectory types. For example, types 2 and 3 present very similar mean squared displacements and space length. However, trajectory curva-tures are different: the feacurva-tures mean curvature and
straigth-ness index(another measure of trajectory curvature) are quite distinct between the two clusters.
This can be observed in the Supplementary movie, where cells whose trajectory belongs to cluster 2 (green) are much straighter than those belonging to cluster 3 (red). In this video, cells whose trajectory passed the trajectory quality control have a dot, whose colour corresponds to its cluster as indicated in fig. 3.
4. CONCLUSION
This paper presents a generic methodological framework for studying single cell motility in a high-throughput setup. It combines single cell tracking, newly designed trajectory
fea-tures and an original statistical procedure. Furthermore, it is unsupervised: cell motion types were infered from the data without using any prior knowledge. As cell population mi-gration during embryogenesis and metastasis are thought to be led by some leader cell, it is crucial to study single cell motility. Therefore, studying single cell motility ideally com-plements previous studies on population migration.
In a next step, we are going to apply this workflow to newly generated Environmental Toxicology data in order to identify environmentally relevant chemicals which perturb cell motility.
5. REFERENCES
[1] S. Naffar-Abu-Amara, T. Shay, et al., “Identification of novel pro-migratory, cancer-associated genes using quantitative, microscopy-based screening,” PLoS ONE, vol. 3, no. 1, pp. e1457, 2008.
[2] K. J. Simpson, L. M. Selfors, et al., “Identification of genes that regulate epithelial cell migration using an siRNA screening approach,” Nat. Cell Biol., vol. 10, no. 9, pp. 1027–1038, Sep 2008.
[3] H. Zhang, P. Y. Wu, et al., “An integrative approach for the large-scale identification of human genome kinases regulating cancer metastasis,” Nanomedicine, vol. 9, no. 6, pp. 732–736, Aug 2013.
[4] B. Neumann, T. Walter, et al., “Phenotypic profiling of the human genome by time-lapse microscopy reveals cell division genes,” Nature, vol. 464, no. 7289, pp. 721–727, Apr 2010.
[5] M. Held, M. H. Schmitz, et al., “CellCognition: time-resolved phenotype annotation in high-throughput live cell imaging,” Nat. Methods, vol. 7, no. 9, pp. 747–754, Sep 2010.
[6] X. Lou and F.A. Hamprecht, “Structured Learning for Cell Tracking,” in NIPS 2011, 2011.
[7] K. Jaqaman, D. Loerke, et al., “Robust single-particle tracking in live-cell time-lapse sequences,” Nat.
Meth-ods, vol. 5, pp. 695–702, Aug 2008.
[8] I. F. Sbalzarini and P. Koumoutsakos, “Feature point tracking and trajectory analysis for video imaging in cell biology,” J. Struct. Biol., vol. 151, no. 2, pp. 182–195, Aug 2005.
[9] Y. Benjamini and D. Yekutieli, “The control of the false discovery rate in multiple testing under dependency,”
Annals of Statistics, vol. 29, pp. 1165–1188, 2001. [10] M. Halkidi, Y. Batistakis, and M. Vazirgiannis, “On
clustering validation techniques,” Journal of Intelligent