Development of High-Throughput Platforms for
Single-Cell Analysis
by
Denis Loginov
B.Sc., M.Sc. Applied Physics and Mathematics
Moscow Institute of Physics and Technology
Submitted to the Department of Materials Science and Engineering in partial
fulfillment of the requirements for the degree of
Master of Science in Materials Science and Engineering
at the
MASSACHUSETTS INSTITUTE OF TECHNOLOGY
February 2015
© 2015 Massachusetts Institute of Technology. All rights reserved.
Signature of Author:
Department of Materials Science and Engineering
September 25, 2014
Certified by:
J. Christopher Love
Associate Professor of Chemical Engineering
Thesis Supervisor
Certified by:
Darrell J. Irvine
Professor of Materials Science and Engineering
and Biological Engineering
Thesis Co-Advisor
Accepted by:
Donald Sadoway
Chair, Departmental Committee on Graduate Students
Development of High-Throughput Platforms for Single-Cell Analysis
by
Denis Loginov
Submitted to the Department of Materials Science and Engineering
on September 25, 2014 in partial fulfillment of the requirements
for the degree of Master of Science in
Materials Science and Engineering
Abstract
Many important areas of research regarding human health, such as immunology and
cancer biology, deal with highly heterogeneous populations of cells where the
contributions of individual players cannot be ignored. Single-cell technologies aim to
resolve this heterogeneity by analyzing many individual cells in a high-throughput
manner. Here we developed two examples of such tools that rely on microfabricated
arrays of microwells. The first platform merges fluorescence cytometry with label-free
profiling of the small molecule composition of tens of thousands of cells based on
matrix-assisted laser desorption/ionization (MALDI) mass spectrometry. We evaluated several
materials and approaches to chip fabrication suitable for interfacing with a MALDI
instrument. We also developed an analytical pipeline for efficient processing of cells on
the chip and demonstrated its application to the analysis of brain tumor samples. The
second platform provides a new format of microwell arrays for fluorescence cytometry
that improves their compatibility with a range of automated equipment and enables more
efficient processing of a greater number of samples, while preserving viability and
identity of cells for subsequent analyses. We demonstrated its utility for on-chip
enrichment and recovery of circulating tumor cells (CTCs) and high-content
immunophenotyping of small clinical samples.
Thesis Supervisor: J. Christopher Love
Title: Associate Professor of Chemical Engineering
Thesis Co-Advisor: Darrell J. Irvine
Acknowledgements
I would like to thank my advisors Professor J. Christopher Love and Professor Darrell J. Irvine, along with my unofficial advisor Professor Nathalie Y. R. Agar, for their enormous support in all my pursuits. Their constant encouragement, patience and willingness to guide my work at any level, both professional and personal, made a tremendous difference.
I would also like to acknowledge all my collaborators in Nathalie’s group at BWH that made the first part of this work possible. Special thanks goes to Dr. David Calligaris, Revaz Machaidze, Isaiah Newton, and Dr. Xiaohui Liu for helping me with the different stages of my experiments. Revaz got me started with cell culture and was supportive in other aspects ever since. I would not have gotten far without David’s expertise on MALDI imaging and analysis. Isaiah was instrumental in getting computers to do their job. Xiaohui helped with the first proof-of-concept experiments that outlined the prospects of the project.
The second half of my thesis was inspired and made possible by my interactions with Viktor Adalsteinsson at the Love lab. His enormous ability to postulate research problems and find simple solutions, along with assistance in experiments for half of this work, made all the difference. I’d also like to mention the efforts of Mark Kalinich, who helped Viktor and me with the most laborious part of counting cells, along with other experiments. I cannot understate my gratitude to Dr. Todd Gierahn, who developed MuSIC and performed immunophenotyping experiments that I discuss later on. I also thank Todd and Viktor for reviewing this thesis.
In addition, I would like to recognize members of the MTL staff who taught me basic microfabrication techniques that underlined this work: Kurt Broderick, Scott Poesse, Bob Bicchieri and many others were extremely helpful in this regard. Not least, MIT’s MTL and ISN provided instrumentation for microfabrication and characterization. In addition, I would especially thank the ISN for financial support. Finally, Dr. Andy Kamholtz provided useful discussions on “where the rubber meets the road” of soft embossing and injection molding.
It is hard to express my personal gratitude to all members of my advisors’ labs. Yvonne, Yuan, Debo, Todd, Viktor, Ayca, Brittany, Alex, Rita, Qing, Tim, Alan, the Rachels, the Johns, Lionel, Nick, Kartik, Li-Lun, Brinda, Ross, Mei-Chen, Arnon, Revaz, David, Isaiah, Greg and others not only provided useful tips, general assistance and stimulating thoughts or requests at some point in time, but became my friends at work and often beyond.
Outside of the labs, my friendly classmates Joaquin, Neel, Ami, Akira, Kunal, Mehmet, Alan, Ryan and many others shared the struggles and triumphs of the first year. Joaquin has remained a close friend ever since.
Life as a graduate student at MIT would not be possible without a dedicated residence – Sidney-Pacific – that became the best place to be over these years. Endless interactions with my buddies Ahmed, Amy, Chelsea, Tim, the Georges, Holly, Mirna, Brian and others, as well as the housemasters Marks and Tangs provided the comfort of home away from home.
Last but possibly the most important is unconditional love from my parents. I cannot thank you enough for everything you have done for me throughout my whole life.
Table of Contents
1. Introduction ... 9
1.1 Overview of technologies for single-cell analysis ... 9
1.2 Scope of thesis ... 14
2. Small-molecule profiling of cells by MALDI MSI ... 15
2.1 Introduction ... 15
2.2 Results ... 21
2.2.1 Cell transfer ... 22
2.2.2 Plastic devices ... 25
2.2.3 Si chips ... 29
2.3 Discussion ... 42
2.4 Methods ... 46
3. Nanowell plates for cytometry and recovery of single cells ... 54
3.1 Introduction ... 54
3.2 Results ... 55
3.2.1 Identification and recovery of CTCs ... 63
3.2.2 Immunophenotyping of small samples. ... 68
3.3 Discussion ... 71
3.4 Methods ... 75
4. Conclusion ... 80
4.1 Summary ... 80
4.2 Perspectives ... 82
References ... 85
List Of Figures
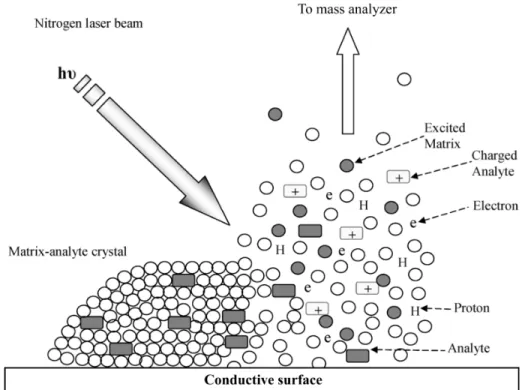
Figure 1. Ionization process in a MALDI time-of-flight (TOF) instrument. The matrix-analyte
crystal is bombarded with a UV laser beam that excites the matrix, which, in turn, transfers the energy to the analytes. This results in the ionization and desorption of the analytes, mainly as singly charged species. The remaining charge dissipates via a conductive substrate. Adapted from [30] ... 18
Figure 2. Spatial resolution of matrix deposition methods. Reprinted from [39] ... 19
Figure 3. Schematic of the massively parallel sample preparation using the stretched sample
method. (A, B) Pressure and heat are used to form a layer of glass beads on a Parafilm M
membrane surface. (C) A thin tissue slice is placed onto the glass bead layer. (D) The Parafilm M membrane is manually stretched. As a result, the tissue slice is fragmented into thousands of spatially isolated pieces. (E) After MALDI matrix application, individual pieces of tissue may then be investigated with MALDI MS. Reprinted from [40]. ... 19
Figure 4. Schematic diagram of the processes involved in microengraving. (1) A suspension of
cells is deposited onto an array of microwells fabricated by soft lithography. (2) The cells are allowed to settle into the wells and then the excess medium is removed by aspiration. (3) The dewetted array is placed in contact with a pretreated solid support, compressed lightly and incubated for 2–4 h. (4) The microwells are removed from the solid support and placed in a reservoir of medium. (5) In parallel, the secreted factors captured on the solid support can be quantified in a microarray scanner. (6) Printing for secreted factors can be done repeatedly to different slides. (7) The cells of interest can be retrieved by micromanipulation and transferred to a 96-well plate for downstream analysis. Adapted from [13], [43]. ... 21
Figure 5. Agilent Microarray Hybridization Chamber ... 23
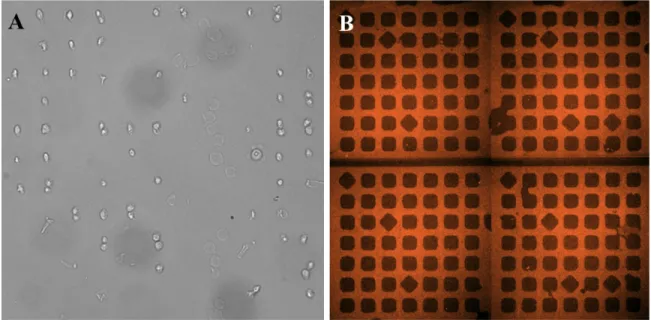
Figure 6. (A) Cells transferred from a PEG-g-PLL-coated PDMS stamp with 30 um well size to a
PLL-coated glass slide in a metal clamp centrifuged at 1000 rpm (~200g) for 5 min. (B) Rhodamine-conjugated 5mg/mL BSA contact printed from PDMS with 50 um wells to a PLL-coated ITO slide. PLL is a 0.01% w/v stock. Both images were taken on Zeiss AxioObserver Z1 at 10x with 800 um field of view corresponding to one block of wells. 4 adjacent images are stitched and their contrast enhanced in B. ... 25
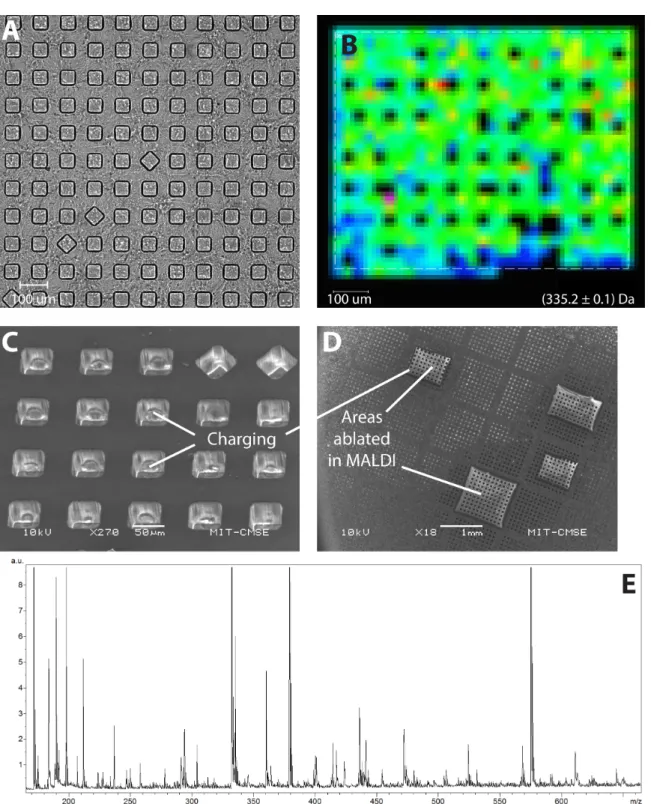
block of wells soft-embossed in COP. (B) Molecular ion image of a block. (C) Secondary electron (SE) image of the wells in SEM. (D) SE image of the ablated blocks in SEM. (E) MALDI spectrum from top of the wells. ... 28
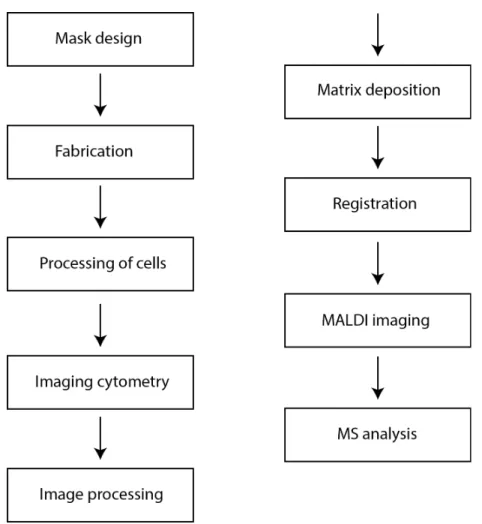
Figure 8. Workflow for on-chip cytometry with Si chips. ... 30
Figure 9. Design of the mask for fabrication of Si chips. Red rectangle delineates one field of view of the camera. Blue linesillustrate built-in overlap between these. Other features are
explained in the text. ... 33
Figure 10. Fabrication of Si chips. ... 34
Figure 11. Fabricated Si chip. (A) Overview of a block of wells in SEM. (B) Close-up on
multiple wells; black dots are cells settled in the wells. (C) A column number labeling position of the block on the chip. (D) A single well harboring a cell. (E) Overview of a finished chip in visible light. ... 35
Figure 12. Part of an image analyzed by Enumerator. ... 36
Figure 13. Map of a Si chip with calculated positions of cells for acquisition in MALDI (blue dots). ... 38
Figure 14. Receiver operating characteristic for prediction of wells with MALDI signal based on
fluorescence. Green curves correspond to wells with cells, gray – to empty wells. ... 38
Figure 15. Phospholipid profiling in MALDI. Visualization of matrices of the phospholipid
signal (700–860 Da, horizontally) across 1152 spectra (vertically) for each of U87 cells (A) and NIH3T3 cells (B). Each cell line was processed independently on a separate chip. (C) PCA score plot delineating the two populations. (D) PCA loading plot for certain mass peaks. The peaks in blue could be identified as phospholipid markers of cellularity, while the peaks in orange could be associated with U87 cells. Figure courtesy of Dr. David Calligaris, BWH ... 39
Figure 16. (A) MALDI spectra for two lines of cells processed on a single chip. (B) The same
cells as seen in the fluorescence microscope: U87 stained with DAPI (blue), NIH3T3 expressing eGFP (green). (C) PCA score plot of the two populations processed separately (blue and green) or on a single chip (red). U87-specific signal (m/z 760.4, 782.4 & 808.4) can still be detected from the mixture. Figure courtesy of Dr. David Calligaris, BWH ... 40
of non-treated cells (B). PCA score plot illustrates two distinct populations (C). Figure courtesy of Dr. David Calligaris, BWH ... 41
Figure 18. Schematics of the sublimation apparatus used for deposition of the matrix. Figure
courtesy of Dr. David Calligaris, BWH ... 50
Figure 19. Detection of phospholipids from NIH3T3 cells. Green spectrum corresponds to wells with cells, gray – empty wells (as detected by fluorescence). Figure courtesy of Dr. David
Calligaris, BWH ... 51
Figure 20. Cell-specific (B, C) and non-specific (D) MALDI signal, as compared to fluorescence (A). Red circles indicate locations of empty wells. Courtesy of Dr. David Calligaris, BWH ... 52
Figure 21. Design of the nanowell plate. (A) Schematics and dimensions of the macrowell piece
(upper part). (B) Design of the grid of nanowells (bottom part). (C) Relative dimensions of the macro- and nanowells. ... 56
Figure 22. Steps for microfabrication of masters with DRIE. ... 59
Figure 23. Alternative designs of nanowells. (A) Nanowells produced with anisotropic etching of
Si. (B) DRIE of wells with vertical walls. (C) SEM images of nanowells produced with DRIE. . 60
Figure 24. Nanowell plate for single-cell cytometry. ... 62
Figure 25. Workflow for single-cell analysis using the nanowell plates ... 62
Figure 26. Direct density-based immunomagnetic enrichment and recovery of CTCs using the
nanowell plates. Figure courtesy of Viktor Adalsteinsson, MIT. ... 66
Figure 27. Comparison of cell recovery rates between old and new designs. (A) Design of the
study. (B) Results; whiskers display the range of values (n=3). Figure (A) adopted from Figure
26b. ... 67
Figure 28. Immunophenotyping with MuSIC. (A) Gating of various cell subpopulations from
peripheral blood mononuclear cells (PBMCs) imaged on the nanowell plate. (B) Comparison of PBMCs and cytobrush samples in the new and the old designs. Figure courtesy Dr. Todd Gierahn. ... 70
Figure 30. Spread of well centroids across an array (shown for an old chip design). ... 73
Figure 31. Magnetic plate (MagPlate) for CTC enrichment. ... 77
Figure 32. Process of gravity-based settling of cells loaded with beads through the layer of
1. Introduction
1.1 Overview of technologies for single-cell analysis
The last several decades have seen a tremendous progress in our understanding of biological processes. An ever-growing number of assays, made available through highly-automated tools such as quantitative PCR instruments and high-throughput DNA sequencers, have allowed us to uncover molecular mechanisms of these processes in exquisite detail [1].
Despite these advances, research in many important fields, such as immunology and cancer biology, has made it increasingly clear that bulk measurements (i.e. on the level of cell populations and tissue homogenates) can mask characteristics of individual cells or subsets of cells that contribute significantly to biological processes, but may not be identical to the “population average” measured by these techniques. Such heterogeneity appears not only in genetically diverse populations (as in the case of many tumors, or T and B lymphocytes), but also at the clonal level, based on differences in epigenetic states of the cells and stochasticity in cellular signaling [1], [2]. In addition, interactions between individual players may not be resolved if only an “average” behavior is studied. As a result, traditional methods may draw a misleading picture of dynamic responses of cells to the given perturbations, necessitating development of technologies for single-cell analysis.
Important classes of measurements include characterization of genotype, proliferation, cell surface markers, secreted molecules and interactions between individual cells [2]. Tracing these parameters for every cell may reveal not only new biology (such as specific pathways and interactions in the immune system), but also inform diagnosis and treatment (for example, based on known mutations in cancer). Although taking in vivo measurements would in many cases be preferable to preserve the natural state of cells and their microenvironments, it is often impossible or impractical. In vitro measurements are less restrictive, but may also pose limitations on the number and types of assays that may be applied. First, they should offer a means to isolate
individual cells for subsequent interrogation. They should also be sensitive enough to reliably detect signals associated with each cell. The number of simultaneously detected signals (multiplexity) may become another limitation. Some measurements (such as genetic profiling) may be done as an end-point assay, while others (such as functional or phenotypic characteristics) may be repetitive due to their non-destructive nature. Another important aspect is the throughput of any assay, which poses a practical limit on how many measurements and on how many cells can be feasibly done in a given time; methods that process cells in parallel may be much more efficient than serial ones. No less important is the number of cells required for a particular method, which implies the kinds of samples that could be processed with it: while cell lines and animal models are an abundant source of material used in research, clinical samples often barely meet this criterion [2]. In this regard, any method that preserves viability and identity of cells for subsequent analyses (i.e. being modular) may provide additional flexibility. Finally, fine control over individual cells and their measurements should be carefully balanced with the overall simplicity of the approach, as doing so may drastically affect the costs and labor spent on any analysis.
Optical tools have become a de-facto standard for the majority of measurements in biological research, both at the bulk and the single-cell levels. Indeed, high sensitivity and resolution (down to the single-molecule level) enabled by advanced light sources and detectors – lasers, photomultiplier tubes (PMTs), electron multiplying charge-coupled devices (EMCCDs) etc. (which in turn, resulted from advances in physical sciences and microfabrication) – coupled with the generally non-destructive nature of optical measurements (allowing repeated, time-course and modular experiments) and an ever-growing availability of fluorescent probes, provided a unique framework for studying biological processes not easily achieved with any other physical observations. However, optical measurements still suffer from reduced multiplexity due to the overlapping spectra of the dyes, the requirement for labels specific to target molecules, and
orthogonal methods that complement or substitute fluorescence measurements by relying on alternative physics, have been developed [1]: Raman spectroscopy, mass spectrometry, methods using electric and magnetic fields (capillary electrophoresis (CE), dielectrophoresis (DEP), iso-dielectric separation (IDS)), as well as mechanical forces (acoustic or inertial focusing). All these techniques greatly expand the arsenal of tools available for single-cell analysis, allowing researchers to choose the best set of tools for each case.
While the majority of tools for bulk and even single-cell analysis has traditionally been developed at the “macro” scale, the advancement of technologies for fabrication of microstructures in recent years has enabled production of miniaturized systems, or “lab on a chip” (LoC) devices. These tools utilize the concept of confinement of cells or their lysates and associated reagents to a small volume, often on the order of nanoliters or less. They not only serve to isolate cells from each other, but also increase local concentrations of analytes to achieve higher sensitivity, reduce cost of consumables and time spent on each analysis (often by processing many cells or reactions in parallel or in fast iterations), as well as automate analytical pipelines and reduce potential for human error [1]. Prominent examples include passive [3] and actively actuated [4] microfluidic traps, droplet encapsulation [5] and microwell arrays [6]. Passive devices trap one or a few cells in weir structures and trace their growth or responses to stimuli with fluorescence microscopy [3]; although efficient trapping is possible [7], it provides inhomogeneous shared environment dependent on the position of a cell in the stream [2]. Actively actuated traps may offer better control over microenvironment and cross-contamination, but require the use of a complicated set of microfluidic valves and pumps that is limited by the number of connections and as such is not scalable to large numbers of cells (>103–104) [2], [4]. Droplet-based devices encapsulate cells in small volumes of water-in-oil emulsions [5] and provide room for combinatorial screening [8], [9] and sorting [9], [10]; although highly-controlled and efficient loading is possible [5], [11], and cell viability may be preserved over extended time [8], controlling individual droplets still requires significant manipulations [2]. In
all cases above, a high degree of control, efficiency and throughput, guided by computational optimization based on hydrodynamics simulations [7], is achievable; however, it comes at a cost of an overall complexity of the analysis and limited potential for retrieval of individual cells of interest. In contrast, arrays of microwells utilizing stochastic loading of cells from suspension have offered a straightforward way of tracing characteristics of large numbers of single cells [6], [12], [13]; just like arrays of passive traps, they simplify automated microscopy but also allow cell recovery and expansion into the possible number and types of assays [13], generally making them more modular than micro total analysis systems (µTAS) described above [2].
The most common choice of material for LoC devices has been poly(dimethylsiloxane) (PDMS). Its wide adoption in academic labs is based on a unique combination of properties [14]: ease of replication based on soft lithography, high optical transparency and low autofluorescence compared to common plastics, versatility in surface modifications and elasticity allowing it to conformally seal against hard surfaces and be actuated, permeability to gases, relative inertness and biocompatibility, along with a few others. Even with all these advantages, however, PDMS is not an ideal material for some applications [15]: its high permeability to small non-polar molecules and water vapor may severely affect measurements involving hydrophobic moieties and affect viability of cells sensitive to changes of osmolality in the media; its high elasticity precludes fabrication of microstructures with aspect ratios higher than 2:1 (e.g. tall posts) or lower than 0.2 (shallow channels or wells), and affects reliable registration for large-scale devices [16]. Finally, and perhaps most importantly, PDMS is not readily amenable to large-scale replication: while manual handling in an academic lab is straightforward, it takes a substantial time to cure the polymer (1–2h), and the overall process may leave residues on the mold. Industrial processes (such as injection molding), to the contrary, benefit from materials that can easily be processed and ejected in a matter of seconds, making large-scale production cost effective. There are alternatives to PDMS that may share some of its excellent properties but offer
(COP) [17], as discussed in Chapter 2.
During initial development, any single-cell technology, along with associated materials and methods of fabrication, may be suboptimal or cater only to the needs of an academic lab. However, as we consider a wider adoption of these technologies and a greater impact in both scientific and clinical circles, we need to carefully evaluate and design each set of consumables and processes at each stage of their development. Steady improvements in these directions may make a substantial difference in how a technology is used, and bring about new revolutions in methodologies similar to the one that started with next-generation DNA sequencing.
1.2 Scope of thesis
In this thesis, we demonstrate two examples of single-cell technologies that exhibit some of the features described above. Particular focus is given to the design and development of tools that address certain aspects of single-cell analyses. We also demonstrate application of these technologies to several biological questions, although we don’t aim to obtain substantial insights.
Chapter 2 covers the development of a new mass spectrometry-based technique to analyze tens of thousands of cells in a high-throughput fashion on a single chip. This method merges fluorescence cytometry with orthogonal label-free profiling of the lipid or metabolic content of each cell. We evaluate several choices of materials and approaches to chip fabrication suitable for interfacing with the mass spectrometric instrument. We also develop an analytical pipeline to efficiently process cells on the final device and demonstrate its application to the analysis of brain tumor samples.
Chapter 3 introduces an improvement over an existing platform for single-cell cytometry developed by our group. We design a new format of our arrays that improves their compatibility with a range of automated equipment and enables more efficient processing of a greater number of samples, while preserving viability and identity of each cell. We demonstrate its utility for enrichment, identification and recovery of rare circulating tumor cells (CTCs) and high-content immunophenotyping of small clinical samples.
2. Small-molecule profiling of cells by MALDI MSI
2.1 Introduction
The World Health Organization (WHO) classifies over 125 types of brain tumors based on histopathological evaluation [18], assigning type, subtype and grade (I-IV) to each one of them. Gliomas, tumors of the tissue that support and protect neurons, account for 30% of them, with astrocytoma and oligodendroglioma being the most malignant forms, 70% grade III or higher. Glioblastoma (GBM) is astrocytoma grade IV, with a median survival of 12 to 15 months. Meningiomas account for another 34.7% of all brain tumors [19]. GBM is infamous for being one of the most heterogeneous tumors in existence, as defined by numerous phenotypic and genetic factors [20], [21]. Tumor sustainability and drug resistance are direct results of this heterogeneity, wherein tumor survives due to hyper-adaptive subpopulations. Identification of these tumors based on histopathology and magnetic resonance imaging (MRI) can be challenging, and decisions on surgical resection are in many cases too aggressive if the boundary between the tumor and the normal tissue is unclear [22]. This results in postoperative morbidity, i.e. undesired neurological deficits.
To help with identification and characterization of tumor heterogeneity, new modalities for tumor imaging are in dire need. More complete knowledge about the tumors could inform clinical decisions, and further enhance our understanding of tumor biology. Whereas conventional tools for resolving heterogeneity revolve around fluorescence microscopy at the proteomic and genomic levels, mass spectrometric techniques for identification and quantification of complex (≳100Da) molecules have also become available in the last two decades. Desorption electrospray ionization (DESI) mass spectrometry has recently been shown to accurately identify tumor type, grade and cellularity based on lipid imaging of tissue sections from stereotactic biopsies with a high degree of accuracy in near real time (i.e., during an operation) [19], [23]. Matrix-assisted laser desorption/ionization (MALDI) mass spectrometry imaging (MSI) has been
used for a proteomic-based prognosis in a similar context [24]. These advances demonstrate a clear clinical impact associated with such technologies.
While conventional methods rely on expensive probes (such as antibodies and DNA tags) that are specific to the molecules of interest, mass-spectrometric techniques mentioned above allow for direct imaging of small and large molecules without the need for any labeling. In case of small molecules (such as lipids and metabolites), highly specific probes may not even exist. Additionally, this allows us to work in “discovery mode”, where mass spectrum signals can be analyzed with little or no a priori knowledge of what particular molecules to look for, which would not be possible with methods that rely on labeling of target analytes. Little or no sample preparation also reduces the time and effort required for MSI compared to probe-based analyses.
At the same time, the number of parameters that could conceivably be simultaneously accessed through MSI-based tests is measured in the hundreds, which is vastly greater than for fluorescent or isotopic probes. While some inconvenience and ambiguity in interpretation of the spectra may exist due to inaccuracy of the instruments and complex fragmentation patterns of the molecules, steady improvements in these directions will allow for even better specificity and increased dimensionality in the future.
As mentioned above, imaging mass spectrometry has mainly concerned itself with the analysis of tissue sections, but not at the single-cell level. There are multiple factors that account for this. First, the maximum spatial resolution of current instruments is limited by the diameter of the scanning probes, which is ca. 125 um in case of DESI and ca. 20 um for MALDI. While this limit could be somewhat improved through the use of “oversampling” [25], i.e. spatially overlapping consecutive desorption events, it still hardly approaches the size of individual cells and is not reliable enough to resolve neighboring cells. We can reasonably hope that future improvements in instrumentation will allow us to bridge this gap. However, methods relying on spatial isolation of individual cells are currently required. MALDI also seems to be a clear winner
Second, the sensitivity of the instruments is limited by the amount of material needed to build a peak, i.e. the number of molecules counted by the detector. While the limits of detection achievable by MALDI have been reported to be in the attomole (and potentially down to low zeptomole) range [26], this still amounts to a detection threshold of ~105 molecules and is not readily available for most substances and instruments. Realistically, only femtomole amounts of material are detected in a typical setup, limiting us to the detection of the most abundant molecules in native samples or upconcentrated analytes extracted from a tissue after chromatography.
The instruments for MSI have certainly progressed over the years, providing incremental improvements over mass sensitivities, as well as better spatial and mass resolutions. However, because of the cost, time and technical expertise required to upgrade the instrumentation, it has not been always under direct researcher's control to improve hardware characteristics. To the contrary, sample processing protocols could easily be changed from their standardized counterparts. An overarching topic in the literature on increasing sensitivity based on sample preparation is minimization of spreading of analyzed molecules, which up-concentrates them in more confined areas. Various methods to prevent lateral diffusion have been proposed.
As suggested by its name, MALDI uses a special coating (“matrix”) that incorporates analyzed molecules, and absorbs the energy of laser irradiation to vaporize together with these molecules, ionizing them in the process (Figure 1). One approach to sample preparation involves fixation of the tissues or cells with a chemical treatment either before or during the matrix deposition [27], [28]. Different fixatives allow for extraction of lipids and salt adducts from the sample, while exposing internal cellular structures for co-crystallization with the matrix, as well as dehydrating the sample to minimize diffusion. Alternatively, some solvents are compatible with lipids and can in fact enhance their signal by cross-linking peptides and proteins [28], [29].
Figure 1. Ionization process in a MALDI time-of-flight (TOF) instrument. The matrix-analyte crystal is
bombarded with a UV laser beam that excites the matrix, which, in turn, transfers the energy to the analytes. This results in the ionization and desorption of the analytes, mainly as singly charged species. The remaining charge dissipates via a conductive substrate. Adapted from [30]
Another important aspect is the method of deposition of the matrix. The main focus is to prepare homogeneous matrix crystals that optimally incorporate analytes of interest, while also minimizing their lateral spread. Various deposition techniques have been developed to address these points (Figure 2). Among these are nebulized spray coating through a nozzle [31], commercially realized in the Bruker ImagePrep instruments; electrospray [32] and automated piezoelectric inkjet-type deposition [33], [34]; matrix microinjection [35]; sublimation with recrystallization [36], [37]; or combinations of these [38]. A comparison of them can be found in [35] and [39]. Important aspects of all these techniques are their cost-effectiveness; time and reagent consumption; quality, size and homogeneity of the crystals and analyte incorporation; and potentially some other factors. In the context of high-throughput processing and spatial resolution, matrix sublimation with recrystallization appears to be the most effective thus far.
Figure 2. Spatial resolution of matrix deposition methods. Reprinted from [39]
Figure 3. Schematic of the massively parallel sample preparation using the stretched sample method. (A, B) Pressure and heat are used to form a layer of glass beads on a Parafilm M membrane surface. (C) A thin
tissue slice is placed onto the glass bead layer. (D) The Parafilm M membrane is manually stretched. As a result, the tissue slice is fragmented into thousands of spatially isolated pieces. (E) After MALDI matrix application, individual pieces of tissue may then be investigated with MALDI MS. Reprinted from [40].
Finally, spatial separation of analyzed spots could ultimately prevent sample cross-contamination and lateral spread. A number of techniques have been used in this regard, starting with robotic spotting or ink-jet printing as noted above. However, many of such approaches are serial in nature, not allowing for the highest throughput that could be achieved with parallel methods. More recently, a stretched tissue approach has been proposed to address this problem (Figure 3) and demonstrated the feasibility of tissue analysis at a single-cell scale: an array of glass beads is embedded in parafilm, and a tissue slice is mounted onto the beads and then uniformly stretched to produce single-cell sized pieces separated by hydrophobic regions, which prevent further analyte migration. This approach has the same effect as dried-droplet preparation
of samples on the commercial AnchorChipTM [41].
The idea of compartmentalization drove the bulk of research on increasing sensitivity based on sample preparation. Indeed, one of the first methods to detect attomole amounts of analytes proposed the use of picoliter pyramidal vials etched in Si [42]. In these vials, solvent evaporates in a few seconds and leads to homogeneous micron-scale crystals at the edges of the pyramids. Interestingly, the authors also concluded that "the potential of transferring single cells to the picolitre vials, followed by the addition of the matrix solution, gives the possibilities of following cell-specific processing of proteins, post-translational modifications and peptide sorting and targeting to different intracellular sites". To the best of our knowledge, however, they never followed up on this promise, which we attribute to the lack of the tools for high-throughput imaging and automation available at the time, as well as an overall sensitivity of the instruments.
As described in Chapter 1, the use of microwells to compartmentalize cells is not novel. Recent advancements in soft lithography allowed for a wide-spread use of poly(dimethylsiloxane) (PDMS) stamps to trap and image single cells in the microwells of a suitable size [6]. In the context of our laboratory, these devices have been successfully used to study protein secretion from heterogeneous cell populations, whereby the wells are sealed against a glass slide to provide a local microenvironment for each cell, up-concentrate secreted factors and capture them on the surface of the slide [13], [43] (Figure 4). Microwell arrays are amenable to automated imaging and image processing, simplifying spatial localization of the isolated cells. Yet, to the best of our knowledge there are currently no high-throughput platforms based on microwells that would directly couple fluorescence-based assays to MALDI MSI to combine the advantages of both. Here we present the first example of such a system.
Figure 4. Schematic diagram of the processes involved in microengraving. (1) A suspension of cells is
deposited onto an array of microwells fabricated by soft lithography. (2) The cells are allowed to settle into the wells and then the excess medium is removed by aspiration. (3) The dewetted array is placed in contact with a pretreated solid support, compressed lightly and incubated for 2–4 h. (4) The microwells are removed from the solid support and placed in a reservoir of medium. (5) In parallel, the secreted factors captured on the solid support can be quantified in a microarray scanner. (6) Printing for secreted factors can be done repeatedly to different slides. (7) The cells of interest can be retrieved by micromanipulation and transferred to a 96-well plate for downstream analysis. Adapted from [13], [43].
2.2 Results
Microwell devices currently used in our laboratory cannot be directly imaged in a MALDI time-of-flight (TOF) instrument. The latter requires conductive substrates such as indium tin oxide (ITO) coated glass slides, or metal plates. TOF mass analyzers measure the time travelled by ions over a spatially fixed electric potential difference and thus depend on the initial velocities/kinetic energies of the ions [44]. If the substrate is non-conductive, electrons resulting
from ionization do not dissipate, accumulating charge locally and distorting the accelerating potential, resulting in reduced mass resolution and accuracy [45], [46]. Although this effect can be reduced in ion-trap mass analyzers such as FTICR because they measure cyclotron frequency ω = qB/m that only depends on ion charge/mass ratio and the magnetic field, we expect that charging effects may still negatively impact overall quality of the signal and complicate calibration [46], [47].
Here we developed two approaches to address this problem. In the first approach, we can still use PDMS devices without or with only a minor modification of the established protocols. We would then seal the array with an ITO-coated slide, and transfer the cells from the microwells to the slide. This approach could allow us to conduct cytometry and serially print for secreted proteins, and only perform the destructive step of MALDI on cells of interest in the end.
In the second approach, we make microwell devices conductive by themselves. This allows us to perform all the steps on the same chip, precluding potential loss of cells and their patterns in the process of transfer. We will also explore several materials suitable for making devices conductive.
2.2.1 Cell transfer
We first sought to transfer cells from existing PDMS-based microwell arrays to an ITO slide. High-quality flat glass substrates commercially coated with ITO are ideally suited for microscopic imaging due to over 90% transmission of ITO in the visible range [48] and its high conductivity on the order of 104 S/cm [49]. However, we need to ensure that the cells are transferred efficiently, and that we could relate their locations on the slide to their prior locations in a microwell array.
For the process of transfer, we needed a high shear force that would act on cells to drive them out of the wells onto the slide. In the regular process of microengraving, a PDMS stamp and a glass slide are conformally sealed together using a metal clamp with a tightening screw (Figure
5). Several other sealing configurations were tested when the microengraving process was
developed, but the metal clamp gave the best results when “printing” for secreted factors. As such, it was natural to repeat this process for cell transfer as well.
Figure 5. Agilent Microarray Hybridization Chamber
To confirm cell transfer, we would then unseal the stamp and the slide and observe them separately under a microscope. The unsealing process introduces additional shear forces that could destroy the pattern if we are not careful enough. To address this, we placed the “sandwiched” stamp and slide in phosphate-buffered saline (PBS) and either let the slide float away, or gently pry opened the assembly with tweezers.
To apply the forces for cell transfer, we first tried to rotate the clamp such that an ITO slide sits at the bottom, and tap it against a hard surface. Unfortunately, the forces provided in this way were insufficient, as most cells stayed in the wells, and the slide remained essentially clean.
We then applied a more universal way to pull down the cells, used in most wet laboratories, – centrifuging. We placed the metal clamps in prototyped Styrofoam holders, and rotated them at a high r.p.m. This process finally gave us positive results, although the rate of transfer was still not sufficient.
To facilitate the transfer further, we sought to prevent cells from holding onto the stamp. This could be accomplished with a “slippery” coating applied to PDMS before we loaded cells on it. In a regular microengraving process, we coat the stamps with bovine serum albumin (BSA) to prevent their surface from adsorbing secreted proteins. Although this process works well for the
proteins, it was insufficient to prevent cell attachment in our tests. A more robust biocompatible coating that is ubiquitously used to passive surfaces is polyethylene glycol (PEG). To attach the nonpolar PEG molecules to the surface of the stamp, we used PEG-g-PLL, a graft copolymer of PEG with poly-L-lysine. PLL is positively charged at physiological pH, and will adsorb to any negatively charged surface. PDMS is normally nonpolar, but can be temporarily oxidized with a plasma discharge [50].
Although coating of PDMS with PEG provided a more reliable cell transfer and we could distinctly observe rectangular arrays of cells (Figure 6A), we still needed a means to trace the location of each cell after its transfer from the stamp to the slide. In the microengraving process, we face a similar problem of identifying the locations of secreted proteins in the array; we normally solve this by spiking the printing media with a “background” molecule, which would be present in every well and as such would provide an “imprint” of an entire array on the slide. While this approach could certainly work to identify cell locations after cell transfer, MALDI imaging is notoriously sensitive to any background signal that could dominate the spectra and make the analysis infeasible. One solution to this problem would be to “invert” the background, whereby the molecule to be used as background would be present everywhere but the locations of the wells (and cells). In fact, PDMS has been extensively used in micro-contact printing (µCP), which is a soft-lithographic technique to “print” molecules from the raised features of the stamp to the substrate. While µCP has initially been developed to produce self-assembled monolayers of alkanethiols on gold-coated slides, it has since been shown to work for many other combinations of “inks” and substrates [51]. We decided to print fluorescently labeled BSA onto PLL-coated ITO slides (that is, to use essentially the same materials as in the normal microengraving process). While µCP in this case proved successful over small areas (Figure 6B), large-scale repeatability of the printing was inconsistent (with huge “pockets” of surface not transferred at all), which we attribute to inhomogeneity of the stamp and applied pressure across large areas, as well as presence of liquid in some areas between the stamp and the slide. Overall, µCP could still
be used for partial registration of the slide when absolutely needed.
Figure 6. (A) Cells transferred from a PEG-g-coated PDMS stamp with 30 um well size to a
PLL-coated glass slide in a metal clamp centrifuged at 1000 rpm (~200g) for 5 min. (B) Rhodamine-conjugated 5mg/mL BSA contact printed from PDMS with 50 um wells to a PLL-coated ITO slide. PLL is a 0.01% w/v stock. Both images were taken on Zeiss AxioObserver Z1 at 10x with 800 um field of view corresponding to one block of wells. 4 adjacent images are stitched and their contrast enhanced in B.
As noted above, BSA proved to be less effective at preventing adhesion of cells to the stamp, while providing only subpar registration pattern. A better alternative, PEG could not be printed to the slide; but even with PEG the cell transfer rate was not as high as desired (tentatively, <50%). These problems led us to look for a more direct approach to sample cells with MALDI.
2.2.2 Plastic devices
The microwell devices could be directly used in a MALDI instrument if we modified them in certain ways. Since PDMS is a dielectric, we sought to create a conductive film on top of the wells to match that of the commercial ITO-coated slides (sheet resistance 100 Ohm/sq or higher). PDMS had to also be substituted for a hard plastic that would provide enough rigidity as a substrate for film growth and mechanical handling (thin films created on a soft layer would
easily crack).
In recent years, cyclic olefin polymers (COPs) have gained popularity as a substitute for PDMS in lab on-a-chip applications [17]. Unlike the latter, COPs are thermoplastics, suitable for high-volume production using injection molding. They also provide superior optical properties, with the highest level of transmission (~92%) from near-UV to near-IR range among other common plastics (PS, PMMA etc.), and a low level of auto-fluorescence. COPs, similarly to polypropylene (PP), are also chemically inert and biocompatible. We prototyped COP chips using soft embossing, a technique of replication of microscopic features whereby an elastomeric stamp is used as an intermediary mold for replication [52] (Figure 7A); the initial master remained the same as for our regular PDMS stamps.
To facilitate imaging cytometry, we decided to keep the devices transparent. A thin layer of ITO (~120 nm) or gold (~20 nm, with Ti for adhesion) could be a suitable material for a transparent conductive film. Common processes for thin film deposition that are compatible with low-temperature processing of the thermoplastics include sputtering and e-beam evaporation. Sputtering provides improved sidewall coverage, as required to form a continuous film on top of the chips as an electrode for MALDI; sputtering also preserves stoichiometry of compound materials, such as ITO (nominally 90% In2O3, 10% SnO2 wt.).
After fluorescence cytometry, we coated the chip with a suitable matrix using Bruker ImagePrep system for matrix nebulization, which is normally used for MALDI imaging of tissue section samples (a sublimation apparatus was not available at the time). We then attempted to image rectangular areas of the chip in a MALDI instrument to get a sense of the spectra. However, we were unable to acquire a high-quality signal. The molecular image of the wells appeared dark (no signal) (Figure 7B), and the secondary electron images of the wells in a scanning electron microscope (SEM) demonstrated a charging effect at the walls of the wells (Figure 7C). These results suggested that the sputtering procedure might not have formed a continuous conductive layer at the sidewalls, leading to excessive charge buildup inside the wells
during these observations (however, we have not confirmed this with a cross-sectional SEM, since we decided to abandon the entire approach, as described below). This charge would alter initial velocities of the ions in a time-of-flight MALDI instrument and prevent us from getting a suitable signal. Another possible reason for the absence of MALDI signal is the occlusion of the laser beam by the vertical profile of the walls, as the laser is directed at the surface of the chip at an oblique angle.
MALDI signal was also dominated by peaks reminiscent of the underlying polymer (Figure 7E), suggesting that the laser beam could have ablated the polymer through the film. Indeed, typical laser fluence in MALDI instruments is 10–100 mJ/cm2 or higher [53], nearing threshold fluence for the ablation of most polymers [54]. The film should be relatively transparent to the wavelengths of the laser (337nm and 355nm): according to the tabulated values of the absorption coefficient, α ~ 104 cm-1 for ITO [48] or α ~ 6x105 cm-1 for gold [55], which for the thicknesses d ~ 120nm (ITO) or d ~ 20nm (gold) translate to an exponential decay of 0.9 (ITO) or 0.3 (gold). Excessive charging of the ablated areas in SEM also suggested that the conductive layer might have been fully or partially removed (Figure 7D).
Finally, the polymer contaminated the vacuum in the MALDI instrument, which we attributed to its ablation mentioned above, as well as possible outgassing of the chip in the vacuum. Subsequently, the instrument ceased to detect any signal (even for unrelated experiments), and had to be cleaned extensively before it could be used again.
Although we could design a quarter-wavelength stack of films to be reflective to the laser, or simply increase the thickness of the film (>100nm of gold, which demonstrated similar results), this would complicate the fabrication procedure without necessarily improving the performance of the chip, while also making it optically opaque for imaging cytometry. As such, we decided to abandon this approach and use a more robust material for our devices.
Figure 7. MALDI imaging of a plastic chip coated with gold. (A) Transmitted light image of a block of
wells soft-embossed in COP. (B) Molecular ion image of a block. (C) Secondary electron (SE) image of the wells in SEM. (D) SE image of the ablated blocks in SEM. (E) MALDI spectrum from top of the wells.
2.2.3 Si chips
While thermoplastics would be desirable materials for the mass-production of our devices, their stability was not sufficient for MALDI experiments, as described above. The primary material used in the fabrication of microstructures, however, is silicon. It is directly compatible with well-established and reproducible microfabrication procedures used in cleanrooms, providing the means for a high-volume production. It has high thermal and vacuum stability, preventing any contamination due to melting or outgassing in a MALDI instrument. Si wafers provide an extremely flat surface, and the rigidity of silicon ensures strictly rectangular arrangement of the wells, without long-distance warping and pattern distortions characteristic to polymers. Finally, the crystal structure of Si allows for anisotropic etching of microfeatures with slanted walls [56], which could address the problem of occlusion of the laser beam mentioned above. Additionally, silicon could act as a conductive material on its own, precluding the need for any conductive coatings.
The basic workflow for successful on-chip cytometry using Si chips is outlined in Figure
8. The process starts with the design of a suitable mask that is then used to photolithographically
define arrays of the wells and registration marks on Si wafers during the fabrication procedure. After the devices are fabricated, we prepare and load cells on a chip. We then image the array in an automated fluorescence microscope. Acquired images need to be processed to identify the locations of wells with the cells. To prepare the chip for MALDI MSI, we deposit the matrix using a custom sublimation protocol. The MALDI imaging software requires a global “map” of an entire chip for navigation; the global positions of the wells of interest need to be defined with respect to the corner points on this map. After this registration is done, we proceed with an automated acquisition of MALDI spectra across the array. Finally, we analyze the spectra to define peaks of interest and relate them back to the fluorescent signal.
Figure 8. Workflow for on-chip cytometry with Si chips.
To design masks, we created custom software that generates CAD files from user-defined parameters and is tailored to the arrangement of features in our arrays. We arranged features into blocks, with each block corresponding to one field of view of the camera on the microscope (Figure 9). To be able to later create a “map” of the chip by stitching the images together, we engineered an overlapping space spanned by the camera between neighboring blocks. We also introduced numbers labeling the positions of blocks on the chip to facilitate visual navigation in the MALDI instrument, as well as to help with the stitching. Since the undercut resulting from anisotropic etching of <100> Si is minimal only when the features’ edges are either parallel or orthogonal to the wafer flat, the digits had to be broken up into little squares instead of remaining solid pieces. Due to the minimal undercut, the features corresponding to the wells could be placed
as close as 10um to each other if we wanted to analyze more cells and reduce the “dead” area of the chip. We also engineered a border surrounding the chip, such that when placed in the instrument, the wells would be raised, with their bottom corresponding to the reference plane expected by the instrument, as there was some concern that being out of plane would affect the measurements. For identification of the chips and their orientation, we placed a side caption detailing the geometric parameters of the chip, to be viewed with a naked eye. Finally, we added calibration areas and registration marks at the edges of the chip, although we have not used them in the final protocol. Since we had multiple chips per wafer area, we also drew the guides to cut out individual chips with a die saw.
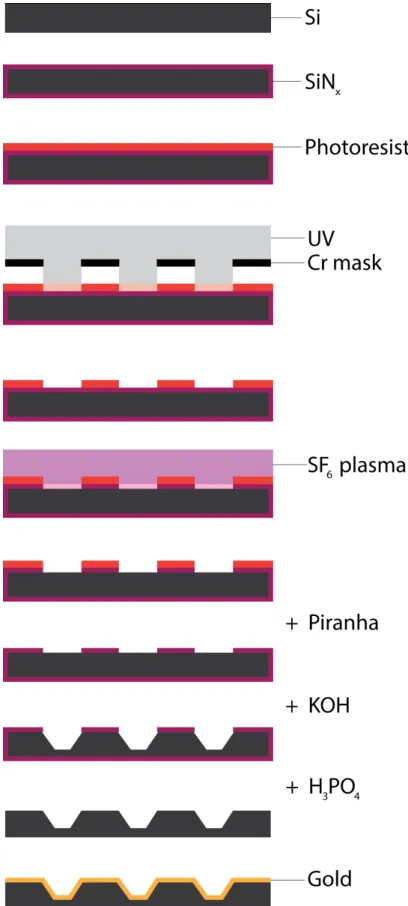
For the fabrication of chips, we adopted a standard process used by the MEMS industry to produce cantilevers using anisotropic etching of Si (Figure 10). Briefly, we used low-pressure chemical vapor deposition (LPCVD) to deposit low-stress silicon nitride that would act as a masking layer during anisotropic etching. We then used photolithography to translate the features from our mask to this substrate. The photoresist pattern served as a temporary mask when we plasma-etched the silicon nitride to reveal the underlying Si. We then stripped photoresist with piranha solution and etched the silicon with a heated solution of potassium hydroxide (KOH) for a predetermined amount of time. Finally, we stripped the remaining nitride in hot phosphoric acid. Additionally, we used e-beam evaporation to deposit a thin layer of gold that served as an electrode on top of Si, as bare Si normally doesn’t provide a good Ohmic contact because of the build-up of the depletion layer and native oxide (see Discussion on how to overcome this issue).
Figure 11 illustrates the final look of the wells in a scanning electron microscope (SEM) and an
overview of an entire chip in visible light.
The protocol for processing of cells was developed using cultured cell lines. Before loading cells into the wells, we placed the chip in a plasma cleaner to promote removal of organic residues and make the surface more hydrophilic. The cells were stained and re-suspended in PBS to reduce the amount of background signal coming from the culture media or blood; cell
concentration was adjusted such that the total number of loaded cells would match several times the number of wells on the chip, to ensure efficient distribution of cells across the wells. We spread the solution of cells across the chip and, after a short incubation, washed out the excess by gently dispensing PBS from the short edges of the tilted chip; loaded cells remained trapped in the wells. Unfortunately, we could not observe the process of loading in transmitted light (as done regularly for the PDMS stamps), because Si is not transparent. Since we used an inverted setup for fluorescence microscopy, we also had to fix the cells to prevent them from falling when imaging face down; fixing might also help with extraction of small molecule analytes for MALDI imaging, as mentioned in the Introduction.
Fluorescence imaging was performed in an automated fashion using a pre-determined list of positions corresponding to locations of the blocks on the chip. We defined support points by focusing at the bottom of the wells for several locations in the array, and relied on spline interpolation of these points for all the positions in the list. To define the locations of the wells for subsequent image analysis, we had to modify our microscope setup to obtain bright-field (non-fluorescent) images of the blocks; we used a wide-band dichroic mirror to pass the excitation light (reflected from the sample) to the camera, and adjusted its intensity with a neutral density filter. Finally, we adjusted the magnification of the microscope to considerably reduce the amount of time spent on imaging, with minimal loss in resolution; this was possible because the camera had a high pixel count and low pixel size, and high resolution is not required for our purposes.
Figure 9. Design of the mask for fabrication of Si chips. Red rectangle delineates one field of view of the camera. Blue linesillustrate built-in overlap between these. Other features are explained in the text.
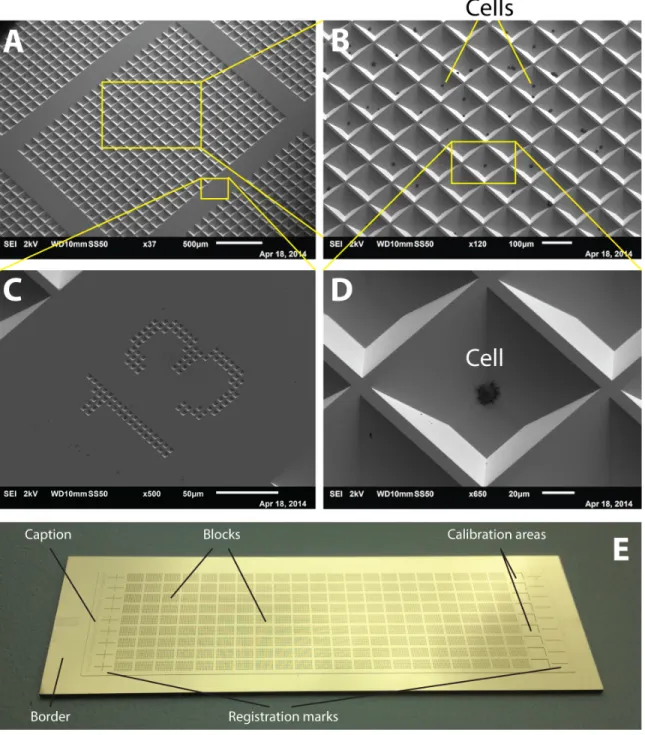
Figure 11. Fabricated Si chip. (A) Overview of a block of wells in SEM. (B) Close-up on multiple wells;
black dots are cells settled in the wells. (C) A column number labeling position of the block on the chip.
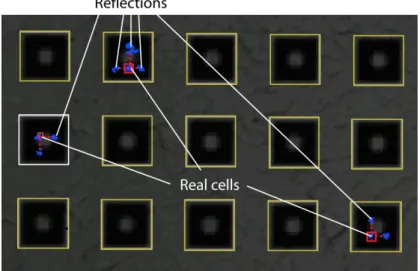
Images of individual blocks were subsequently processed with a version of in-house automated image analysis software (Enumerator), modified to correctly detect pyramidal wells. Unfortunately, slanted walls of the wells were highly reflective, producing mirror images of each cell in the 4 walls of a well (Figure 12). These images were falsely identified as cells and prevented us from accurately counting the number of cells in each well. However, the mirror images had a specific pattern (forming a “cross” around each cell), which could be used to deduce the real locations of the cells if sub-well localization was required.
Figure 12. Part of an image analyzed by Enumerator.
To prepare the chip for molecular imaging in a MALDI instrument, we needed to deposit a matrix layer on top of the cells. As described in the Introduction, one of the methods of matrix deposition most suitable to our analysis is sublimation with re-crystallization. A custom sublimation apparatus and an optimized procedure were created to ensure a homogeneous layer of matrix, as described in Methods. We also re-crystallized this layer in a solvent-humidified chamber to partially incorporate the analytes of interest (i.e. phospholipids) into the matrix crystals.
composite image of an entire chip is required. We employed a stitching plugin from ImageJ in a custom script to piece together the images of individual blocks (provided with pre-engineered overlap area and numbering) with sub-pixel accuracy. Along with excellent dimensional stability of Si, this allowed us to register wells with high precision, potentially suitable even for sub-well navigation.
To generate a list of positions to be acquired by MALDI, we exported an XML file with calibration information from flexImaging, and parsed it using a custom Python script to add the list of wells with cells as defined by Enumerator, along with a randomized list of empty wells used for control. An example map of the chip with added positions is shown in Figure 13, and the procedure for acquisition of MALDI signal is described in Methods.
As an initial test of the experimental workflow, we compared the detection of phospholipid signal in MALDI to the detection of fluorescent signal as the gold standard. Mouse fibroblast cells expressing enhanced green fluorescent protein (eGFP) were loaded onto an array, and wells containing cells were identified through fluorescent imaging. Occupied wells, along with a random sample of empty wells, were then subjected to MALDI analysis. Receiver operating characteristic (ROC) curves (Figure 14) suggest a high degree of correlation between fluorescent and MALDI signal for many m/z values that were handpicked by a trained specialist from the MALDI spectra.
We next determined whether single cell MALDI spectra were capable of identifying unique cell populations. We initially compared phospholipid profiles of two distinct cell lines processed on separate chips (Figure 15). Principle component analysis (PCA) successfully segregated the two cell lines (Figure 15C). The analysis also revealed characteristic peaks that could serve as cellular signatures (Figure 15D). We then mixed these two populations on a single chip and confirmed that cell lines could indeed be split from each other based on such signatures (Figure 16).
Figure 13. Map of a Si chip with calculated positions of cells for acquisition in MALDI (blue dots).
Figure 14. Receiver operating characteristic for prediction of wells with MALDI signal based on
Figure 15. Phospholipid profiling in MALDI. Visualization of matrices of the phospholipid signal (700–
860 Da, horizontally) across 1152 spectra (vertically) for each of U87 cells (A) and NIH3T3 cells (B). Each cell line was processed independently on a separate chip. (C) PCA score plot delineating the two populations. (D) PCA loading plot for certain mass peaks. The peaks in blue could be identified as phospholipid markers of cellularity, while the peaks in orange could be associated with U87 cells. Figure courtesy of Dr. David Calligaris, BWH
Figure 16. (A) MALDI spectra for two lines of cells processed on a single chip. (B) The same cells as seen
in the fluorescence microscope: U87 stained with DAPI (blue), NIH3T3 expressing eGFP (green). (C) PCA score plot of the two populations processed separately (blue and green) or on a single chip (red). U87-specific signal (m/z 760.4, 782.4 & 808.4) can still be detected from the mixture. Figure courtesy of Dr. David Calligaris, BWH
Figure 17. Comparison between 280 mass spectra of drug-treated U87 cells (A) and 192 spectra of
non-treated cells (B). PCA score plot illustrates two distinct populations (C). Figure courtesy of Dr. David Calligaris, BWH
To demonstrate the ability of the assay to identify unique primary cell populations, we analyzed human primary glioblastoma cell line (U87-MG) pre- and post-treatment with lipid kinase inhibitor BKM120 (processed on separate chips). This potent drug penetrates the blood-brain barrier and acts on class I phosphatidylinositol-3-kinase (PI3K) intracellular pathway implicated in many cancers, including glioblastoma; along with its metabolites, this small molecule drug can be imaged directly (i.e. without further labeling) with MALDI MSI [57]. Although the drug has a particular molecular signature as described in [57], we have not attempted to replicate the results of that study; instead, we imaged the cells in the same m/z window as the two lines from above. Using this technique, we were able to segregate treated and untreated cells, demonstrating our ability to estimate the effect of defined perturbation (drug treatment) on the phospholipid profile of a given population of cells (Figure 17).
2.3 Discussion
Here we demonstrated a platform that couples fluorescence microscopy to MALDI mass spectrometry at the single-cell level. To the best of our knowledge, this is the first systematic solution to the problem of imaging large numbers of cells in a high-throughput manner using both of these imaging modalities. A unique aspect of our approach is the use of a regular array of microwells that help compartmentalize cells and image them in an organized manner. While the individual aspects of this platform have been proposed or implemented in the past, here we combined them in a single pipeline that allows for routine imaging for clinically relevant applications.
Although the mass spectrometric techniques relying on soft ionization have enabled a whole suite of “omics” studies in the last two decades, analysis at the single-cell level has remained mostly unexplored. While this disparity could be attributed to an overall lack of interest in single-cell measurements (fueled by simplifying assumptions) that until recent times permeated
the research community, we argue that technical difficulties played an equally important role. The main problems included overall low sensitivity and resolution of the instruments for such types of analyses, as well as a lack of automated pipelines that are necessary for high-throughput processing of single cells. Capitalizing on advances in instrumentation, we have developed such a pipeline and demonstrated the ability to routinely profile tens of thousands of cells at the small-molecule level. This approach complements traditional techniques that rely on labeling reagents and mainly target proteins and nucleic acids, while specific probes for small molecules may largely be inaccessible. This new imaging modality enables a more comprehensive analysis of cellular biochemistry that is necessary for understanding such complex diseases as cancer, which are accompanied by considerable changes in metabolic states of cells and cannot be resolved in enough detail at the population level. We have showcased two examples of such analyses: a study of heterogeneity of mixed samples of cells that is particularly relevant for aggressive tumors (e.g. glioblastoma) and could be resolved by lipid profiling of single cells, and characterization of drug susceptibility of a model cell line, where the single cell analysis could resolve metabolic responses to a particular stimulus.
While single-cell profiling could potentially be performed in plating experiments where the cells are simply attached to a flat surface in a chaotic manner, the use of microwells is beneficial in several aspects. First, it allows us to compartmentalize the cells, forming individual “chambers” that isolate cells from each other, reduce paracrine signaling and decrease the lateral spread of molecules that may occur during the sample preparation for MALDI (thus effectively up-concentrating these molecules to meet the sensitivity requirements of the instrument). These chambers could also enable microengraving, whereby each microwell would be sealed against an elastomeric surface that captures the secretome of each cell. Finally, the spatial arrangement of the wells in a rectangular grid streamlines image processing and registration of the locations of individual cells, which is critical for subsequent acquisition of the molecular signal in a MALDI instrument in a confident and timely manner.