HAL Id: hal-00295940
https://hal.archives-ouvertes.fr/hal-00295940
Submitted on 20 Jun 2006
HAL is a multi-disciplinary open access
archive for the deposit and dissemination of
sci-entific research documents, whether they are
pub-lished or not. The documents may come from
teaching and research institutions in France or
abroad, or from public or private research centers.
L’archive ouverte pluridisciplinaire HAL, est
destinée au dépôt et à la diffusion de documents
scientifiques de niveau recherche, publiés ou non,
émanant des établissements d’enseignement et de
recherche français ou étrangers, des laboratoires
publics ou privés.
Modelling the budget of middle atmospheric water
vapour isotopes
A. Zahn, P. Franz, C. Bechtel, J.-U. Grooß, T. Röckmann
To cite this version:
A. Zahn, P. Franz, C. Bechtel, J.-U. Grooß, T. Röckmann. Modelling the budget of middle atmospheric
water vapour isotopes. Atmospheric Chemistry and Physics, European Geosciences Union, 2006, 6
(8), pp.2073-2090. �hal-00295940�
www.atmos-chem-phys.net/6/2073/2006/ © Author(s) 2006. This work is licensed under a Creative Commons License.
Chemistry
and Physics
Modelling the budget of middle atmospheric water vapour isotopes
A. Zahn1, P. Franz2,3, C. Bechtel4, J.-U. Grooß6, and T. R¨ockmann2,51Institute of Meteorology and Climate Research, Forschungszentrum Karlsruhe, Germany 2Max-Planck-Institute for Nuclear Physics, Heidelberg, Germany
3National Institute for Water and Atmospheric Research (NIWA), Wellington, New Zealand 4Robert Bosch GmbH, B¨uhl, Germany
5Institute for Marine and Atmospheric Research Utrecht, Utrecht University, The Netherlands 6Institute of Chemistry and Dynamics of the Geosphere, Forschungszentrum J¨ulich, Germany Received: 11 June 2003 – Published in Atmos. Chem. Phys. Discuss.: 28 July 2003
Revised: 10 February 2006 – Accepted: 22 April 2006 – Published: 20 June 2006
Abstract. A one-dimensional chemistry model is applied to study the stable hydrogen (D) and stable oxygen isotope (17O,18O) composition of water vapour in stratosphere and mesosphere. In the troposphere, this isotope composition is determined by “physical” fractionation effects, that are phase changes (e.g. during cloud formation), diffusion processes (e.g. during evaporation from the ocean), and mixing of air masses. Due to these processes water vapour entering the stratosphere first shows isotope depletions in D/H relative to ocean water, which are ∼5 times of those in 18O/16O, and secondly is mass-dependently fractionated (MDF), i.e. changes in the isotope ratio17O/16O are ∼0.52 times of those of18O/16O. In contrast, in the stratosphere and mesosphere “chemical” fractionation mechanisms, that are the produc-tion of H2O due to the oxidation of methane, re-cycling of H2O via the HOxfamily, and isotope exchange reactions con-siderably enhance the isotope ratios in the water vapour im-ported from the troposphere. The model reasonably predicts overall enhancements of the stable isotope ratios in H2O by up to ∼25% for D/H, ∼8.5% for17O/16O, and ∼14% for 18O/16O in the mesosphere relative to the tropopause values. The17O/16O and18O/16O ratios in H2O are shown to be a measure of the relative fractions of HOxthat receive the O atom either from the reservoirs O2 or O3. Throughout the middle atmosphere, MDF O2 is the major donator of oxy-gen atoms incorporated in OH and HO2 and thus in H2O. In the stratosphere the known mass-independent fractiona-tion (MIF) signal in O3 is in a first step transferred to the NOxfamily and only in a second step to HOxand H2O. In contrast to CO2, O(1D) only plays a minor role in this MIF transfer. The major uncertainty in our calculation arises from poorly quantified isotope exchange reaction rate coefficients and kinetic isotope fractionation factors.
Correspondence to: A. Zahn ([email protected])
1 Introduction
Water vapour (H2O) belongs to the most important trace gases in the Earth’s atmosphere. It plays a key role for numerous homogeneous and heterogeneous chemical reac-tions (Lelieveld and Crutzen, 1990, 1994) as well as for the short-wave and long-wave radiative budget of the atmo-sphere (IPCC, 2001). Its extremely complex atmospheric cy-cle is not understood in sufficient detail, in particular since atmospheric water is present in the gaseous, liquid, and solid phase.
The interest in middle atmospheric H2O was further in-tensified following observations made by Oltmans and Hof-mann (1995) and after this by others (SPARC, 2000, and ref-erences therein; Rosenlof et al., 2001) who found increasing H2O concentrations of 30–150 nmol/mol yr−1in the middle atmosphere since 1954. Not only the possible causes of this trend but also the consequences for Earth’s climate and the chemistry of the middle atmosphere are a matter of vital dis-cussion (Forster and Shine, 1999, 2002; Kirk-Davidoff et al., 1999; Stenke and Grewe, 2004; R¨ockmann et al., 2004).
To date primarily H2O concentration measurements, sup-ported by atmospheric circulation models, have been used to place constraints on the hydrological cycle in the middle at-mosphere (Dessler et al., 1995; Rosenlof et al., 1997; Randel et al., 2001). Independent information can be gained from the analysis of the isotopic composition of water vapour.
The isotope ratios in water vapour are usually reported as per mil deviation of the ratio “rare isotopologue” to “most abundant isotopologue” relative to the Vienna Standard Mean Ocean Water (V-SMOW) reference, e.g. δ18O(H2O) =(R18O, sample/R18O, V−SMOW−1)·1000‰, where R18O de-notes the isotopologue ratio H218O/H216O of a sample or V-SMOW, respectively. RD, V−SMOW is 0.31152·10−3 (Hagemann et al., 1970; DeWit et al., 1980; Tse et al., 1980), R17O, V−SMOW is 0.3799·10−3 (Li et al., 1988), and R18O, V−SMOW is 2.0052·10−3 (Baertschi, 1976). All δD,
2 δ17O, and δ18O values in this paper are given with respect
to V-SMOW.
The major source of atmospheric water vapour is the ocean having an isotope composition close to V-SMOW, i.e., δ18O(H2O)≈0‰. Evaporation into the atmosphere leads to depletion in the rare H2O isotopologues relative to to H216O, due to their lower vapour pressure compared to H216O, the vapour pressure isotope effect (v.p.i.e.). Typ-ically, δ18O(H2O) is −12‰ and δD(H2O) is −85‰ just above the ocean (Rozanski et al., 1993). Cooling during upward air movement causes cloud formation and (due to the v.p.i.e.) preferential condensation and subsequent re-moval of the rare H2O isotopologues by precipitation. The D/H,17O/16O, and18O/16O isotope ratios in H2O thus de-crease with altitude and reach tropopause values in the range of δD(H2O)≈–(450–750)‰, δ17O(H2O)≈–(30-70)‰, and δ18O(H2O)≈–(60–130)‰, respectively (see Sect. 2). This isotopically depleted water vapour is transported to the stratospheric overworld, almost exclusively within the trop-ics (Holton et al., 1995; Highwood and Hoskins, 1999).
There and in contrast to the troposphere, chemical reac-tions considerably modify the isotope composition of the water vapour imported from the troposphere such as: (i) methane (CH4) oxidation, the main in situ source of H2O in the stratosphere, (ii) exchange of oxygen atoms with molec-ular oxygen and ozone via the HOxand NOxfamily, and (iii) oxygen isotope exchange reactions e.g. between H2O and OH (Greenblatt and Howard, 1988; Masgrau et al., 1999). Importantly, all of these processes enrich the water vapour imported from the troposphere in the rare isotopes.
Using a one-dimensional (1-D) model we show in this pa-per, how these chemical reactions modify the stable isotope composition of middle atmospheric H2O and how H2O iso-tope observations may be exploited to infer constraints on these reactions and on the budget of stratospheric water. Four previous model studies on the isotopic composition of strato-spheric H2O have been made. Kaye (1990) first studied δ18O(H2O) in the middle atmosphere and suggested a sig-nificant increase in δ18O(H2O) with altitude due to18O-rich excess water from CH4 oxidation. Ridal et al. (2001) and Ridal (2002) focused on δD(H2O) in the stratosphere. They found a strong vertical increase of δD(H2O), also due to CH4 oxidation which is additionally modulated by the seasonally varying H2O input from the troposphere (the “tape recorder effect”). Johnson et al. (2001a) applied a simple photochem-ical model with many simplifications, but inferred excellent agreement with own δD(H2O) and δ18O(H2O) balloon-borne observations conducted between 1989 and 1997.
The major difference of the present model study compared to earlier work is first that all three stable isotope signatures
δD(H2O), δ17O(H2O), and δ18O(H2O) both in the strato-sphere as well as in the mesostrato-sphere are combined, and sec-ond that a large number of isotope exchange reactions and all isotope fractionation coefficients measured so far are consid-ered. Special emphasis is put on the specific pathways of D,
17O, and18O from their reservoir species CH
4, H2, O2, and O3into the end product H2O.
2 Available stable isotope data of H2O
Due to the difficulty to measure the isotopic composition of stratospheric water with sufficient accuracy, only a limited number of H2O isotope data have been gathered so far, which are grouped in the following according to the analytical tech-nique employed.
(i) Most stable isotope H2O data were collected using remote-sensing infrared spectroscopy techniques (Abbas et al., 1987; Carli and Park, 1988; Guo et al., 1989; Dinelli et al., 1991, 1997; Rinsland et al., 1984, 1991; Stowasser et al., 1999; Johnson et al., 2001; Kuang et al., 2003). They all reveal strong depletions of δD(H2O) with respect to V-SMOW which significantly decrease with altitude, from about –(660 ± 80)‰ at the tropical tropopause (Moyer et al., 1996; Johnson et al., 2001; Kuang et al., 2003; McCarthy et al., 2004) to typically –(450 ± 70)‰ at 40 km. Observations by Stowasser et al. (1999) showed extreme δD(H2O) deple-tions as low as –830‰ at 17 km inside the Arctic vortex, which was attributed to condensation and subsequent sedi-mentation of polar stratospheric cloud (PSC) particles.
For δ17O(H2O) and δ18O(H2O), most studies report val-ues between 0 and –100‰ and a weak vertical increase. However, this increase is mostly not significant due to the large measurement uncertainties of 50–120‰. In contrast, early observations by Guo et al. (1989) showed increasing
δ18O(H2O) values from (80 ± 140)‰ at 22 km altitude to (400 ± 250)‰ at 37 km. Using a balloon-borne spectrom-eter, Johnson et al. (2001) obtained low isotope ratios of – (300-30)‰ (average: –128‰) for δ18O(H2O), and of –(400-0)‰ (average: –84‰) for δ17O(H2O) at 12–20 km altitude.
(ii) Cryogenic in situ sampling and subsequent laboratory-based mass spectrometry (MS) analysis constitutes the po-tentially most accurate technique, but suffers from the very small sample amounts available and their difficult handling and MS analysis. Most observations are from the upper tro-posphere and lowermost stratosphere (Ehhalt, 1974; Smith, 1992; Zahn et al., 1998; Zahn, 2001) and to date there is only one set of balloon-borne stratospheric δD(H2O) profiles available (Pollock et al., 1980). These data likewise show a continuous increase in δD(H2O) with altitude, from about –450‰ at 25 km to about –360‰ at 35 km.
The single investigation on the oxygen (δ17O and δ18O) isotope composition of stratospheric H2O samples was conducted by Franz and R¨ockmann (2005) using sam-ples obtained between New Zealand and Antarctica in Au-gust/October 2004 at altitudes of up to ∼5 km above the local tropopause. The data show an increase of δ18O con-comitant with decreasing H2O mixing ratios above the lo-cal tropopause. This was interpreted as mixing of tropo-spheric and stratotropo-spheric overworld air in the high latitude
lowermost stratosphere. Notably, the data show no oxygen isotope anomaly with very small errors of 117O(H2O) <2‰. (iii) In situ infrared laser spectroscopic techniques are challenging, potentially very accurate and may additionally offer high spatial resolution. First applications on board air-craft have been reported.
Using the tunable diode laser absorption spectrometer (TDLAS) ALIAS on board the high-flying NASA WB-57 aircraft, Webster and Heymsfield (2003) observed (expect-edly) decreasing δD, δ17O, and δ18O values in H2O with in-creasing height up to the tropical tropopause. The high tem-poral resolution measurement also revealed a very high de-gree of variability, e.g. δD values ranging from 0 and −900‰ near the tropopause and clearly different values for ice and gas water, respectively. Surprisingly, the mean δD:δ18O ratio for this data set is only <3 in the lower stratosphere.
In May 2004 Kerstel, Romanini, and Jost applied a cavity-ring-down technique (off-axis cavity enhanced absorption spectroscopy, OF-CEAS) on-board a DC-10 aircraft at alti-tudes of up to 13 km. They reported on excellent measure-ment uncertainties of below 10‰ for all three stable isotopo-logues over a certain 10 min sampling interval with particular constant H2O mixing ratios of ∼200 ppmv (personal com-munication).
High measurement accuracies are reported by Keutsch et al. (Havard University) who measured δD and δ18O in H2O at altitudes of up to 20 km in autumn 2004 by using off-axis in-tegrated cavity output spectroscopy (OF-ICOS) on-board the NASA WB-57. On the same flights a photofragment laser-induced fluorescence (LIF) technique were applied for mea-suring δD in H2O by Hanisco et al. (Havard University) with similarly low measurement uncertainty.
3 Information provided by the H2O isotopic composi-tion
The isotopic composition of tropospheric water vapour is controlled by the hydrological cycle. Hence, H2O isotope data can be used as tracers for the condensation history of probed air masses (Taylor, 1984), e.g. for studying the trans-port of tropospheric H2O into the lowermost stratosphere (Zahn, 2001).
Both, δD(H2O) and δ18O(H2O) are primarily determined by the v.p.i.e. (see Sect. 1) and thus undergo similar vari-ations. Indeed, in surface precipitation both isotopologues are closely related by the meteoric water line (MWL):
δD(H2O)≈m×δ18O(H2O)+10‰, with m≈8 (Craig, 1961). This relationship was found to hold reasonably well even on Mount Logan (Canada) at 5951 m altitude, with m=7.5 (Holdsworth et al., 1991). At cold temperatures as encoun-tered in the tropical tropopause layer (TTL), however, kinetic isotope fractionation during formation of ice cloud particles, their lofting in convective cells and mixing of air masses with different H2O isotope compositions are assumed to
consid-erably reduce δD(H2O) depletion compared to δ18O(H2O) (Moyer et al., 1996; Keith, 2000; Johnson et al., 2001; Kuang et al., 2003; Dessler and Sherwood, 2003). In fact, using the isotope composition of water vapour entering the stratosphere of δD(H2O)=−679‰ and δ18O(H2O)=−128‰ as measured by Johnson et al. (2001), a mean slope m=5.4 is calculated. Due to the mass-dependent nature of isotope fractionation processes in the troposphere, 117O(H2O) is set to 0‰ at the tropical tropopause. Potential deviations from this assumption e.g. owing to an interplay of equilibrium and kinetic isotope fractionation factors with different three-isotope relationships (Eq. 1) were not observed yet and thus are not considered.
In this paper, we define mass-independent fraction (MIF) by using the formulation
117O=[ln(1+δ17O/1000)−λ·ln(1+δ18O/1000)]·1000‰(1) suggested by Miller (2002) which quantifies the deviation from mass-dependent fractionation without approximation. As three isotope exponent we adopt λ=0.528 (±0.0015) as measured by Meijer and Li (1998) in a large number of natural waters showing δ18O(H2O) values between −50 and +10‰. This value is very close to λ=0.529 derived by Young et al. (2002) for equilibrium fractionation processes, but larger than λ=0.513 inferred for kinetic fractionation processes. It is not known to date, if kinetic fractionation during the upward transport to the tropopause results in sig-nificantly lower λ values for H2O at the tropopause. As-suming δ18O(H2O)=−128‰ at the tropical tropopause and λ=0.513 (which is also the λ value for O2), Eq. (1) leads to only 2.05‰ lower δ17O(H2O) values. This in an exaggerated upper limit, since λ is certainly not that different for the en-tire condensation history. In any case, such a shift would not alter much our model results.
In conclusion, it can be presumed that tropospheric water vapour entering the stratosphere at the tropical tropopause on average exhibits a δD(H2O)/δ18O(H2O) ratio of 5–6 and is mass-dependently fractionated (MDF). Possible local de-viations from these two assumptions, e.g. assumed to occur in the outflow of a deep convection cells will be negligible for the H2O isotope budget and are not considered here.
In the stratosphere chemical reactions modify this isotope signature imported from the troposphere, as will be pointed out briefly below and explained in more detail later:
(i) The first “chemical” mechanism is the in-situ source of H2O, the oxidation of methane (and H2). Methane is ox-idized in the middle atmosphere by reactions with OH, Cl, and O(1D), and by photolysis (Lary and Toumi, 1997). Each oxidized CH4molecule leads to the net formation of almost two H2O molecules (Evans et al., 1999; Z¨oger et al., 1999; Michelsen et al., 2000). The δD value of the produced H2O molecule δD(H2O) differs from δD(CH4), because the CH4 loss reactions are accompanied by unusually strong kinetic isotope fractionation. For instance, at room temperature the D isotope fractionation factor KIED, that is the ratio of the
2 rate constants k(CH4)/k(CH3D), is KIED(OH)=1.29 for the
reaction of CH4 with OH, KIED(Cl)=1.51 for the reaction with Cl, and KIED(O(1D)=1.11 for the reaction with with O(1D) (Saueressig et al., 1996, 2001; Tyler et al., 2000). Since these KIEs differ considerably, the δD(H2O) distribu-tion in the middle atmosphere is expected to be determined by the partitioning of the different CH4oxidation reactions.
(ii) Re-cycling of oxygen atoms between H2O and the oxy-gen reservoir gases O2and O3via HOxand NOxspecies and oxygen isotope exchange reactions. Besides net H2O for-mation due to CH4 oxidation, continuous loss of H2O and reformation of H2O lead to an extensive turnover of oxygen atoms between oxygen containing trace gases. This process recycles much more H2O molecules than are net produced by the oxidation of CH4 (see Fig. 5). Though a zero-cycle with respect to the H2O mass, it strongly influences the oxy-gen isotope composition of H2O. This process is expected to dominate the MIF oxygen isotope signal from O3to H2O. Further processes to be considered are a few oxygen isotope exchange reactions such as between OH and H2O and NO2 and H2O.
A crucial and exciting point is that more than 99% of all oxygen atoms that end up in H2O in the middle atmosphere stem from the hydroxyl radical OH. Hence, δ17O(H2O) and δ18O(H2O) data provide information about the oxygen iso-tope composition of OH, and by considering 117O(H2O) about the affection of MIF enriched O3 upon OHxand via OHxupon many other oxygen containing trace gases in the middle atmosphere. This MIF transfer from O3to oxygen -containing radicals was first studied by Lyons (2001).
4 Model description
Our 1-D model encompasses 65 boxes from 15 to 80 km, each 1 km high. Temperature and pressure profiles are set according to the U.S. Standard Atmosphere (1976). Verti-cal transport is parameterised by eddy diffusion coefficients Kz, below 29 km using the “National Academy of Science (1976)” profile, from 29 km to 50 km using the “Hunten” profile, both depicted by Massie and Hunten (1981), and above 50 km employing the profile given by Froidevaux and Yung (1982).
4.1 Peculiarities in modelling isotope ratios
The concept of chemical families frequently applied in atmospheric chemistry models mostly fails if isotopo-logues are considered. For instance, the reaction chain of CO+OH→CO2+H followed by H+O2+M→HO2+M converts OH to HO2, which conserves the sum of HOx=OH+HO2. The oxygen atom of the initial OH, how-ever, is incorporated in CO2and thus leaves the HOxfamily. A new OH bond is formed, which has the oxygen isotope composition of O2.
The following peculiarities also have to be taken into ac-count:
(i) Kinetic isotope fractionation factors that account for the mostly slower reaction rate of the isotopically substi-tuted molecule compared to the most abundant isotopo-logue.
(ii) Isotope exchange reactions such as the fast O exchange between O2and O(3P) (Kaye and Strobel, 1983). They modify isotope ratios but not the concentration of the participating compounds.
(iii) When including isotopologues and isotopomers that contain two or more atoms of the same element at non-equivalent positions such as O3or HO2, the individual isotopomers have to be considered separately, e.g. the OQO and OOQ or HQO and HOQ (with Q substituting for17O and18O).
4.2 Trace gas chemistry
Due to negligible cloud formation in the middle atmosphere, our model is restricted to gas phase chemistry. If not cited differently, all reaction rates are taken from JPL (2003). Ini-tially, all reactions involved in H2O chemistry and isotope exchange with other gases were assessed carefully for all al-titudes covered by the model. The reactions finally used (Ta-bles 1 and 2) always account for more than 95% of the local chemical turnover of H2O and its isotopologues at a given altitude.
Water vapour is formed due to H-abstraction by OH, i.e. XHi+OH→XHi−1+H2O, where XHiis CH4(Reaction R1), CH2O (R8), HO2 (R16), HCl (R21), H2 (R26), or HNO3 (R29). The major sinks of middle atmospheric H2O are the reaction with O(1D) (R30) and photolysis at wavelength be-low 200 nm (R31).
Furthermore, all reactions that are necessary to maintain the overall budget of O- and H-atoms balanced are included. To this end a complete methane destruction scheme (LeTex-ier et al., 1988) and all relevant reactions affecting the HOx -family (Burnett and Burnett, 1995) are considered.
The concentrations and the isotopic compositions of H2O, OH, HO2, H, H2, CH4, CH3, CH2O, HCO, HNO3, and HCl are explicitly calculated by the model.
4.3 Isotope chemistry
Integration of isotopologues renders the model complex, as shown for the initial steps of the major methane destruction reactions (Table 3).
Only for a few of the reactions listed in Table 1 the iso-tope fractionation factor KIE=k/ k0 is known, with k0 being the rate constant for the isotopically substituted species. All KIEs that have been measured in the laboratory are imple-mented in the model (Table 5), expressed in the form:
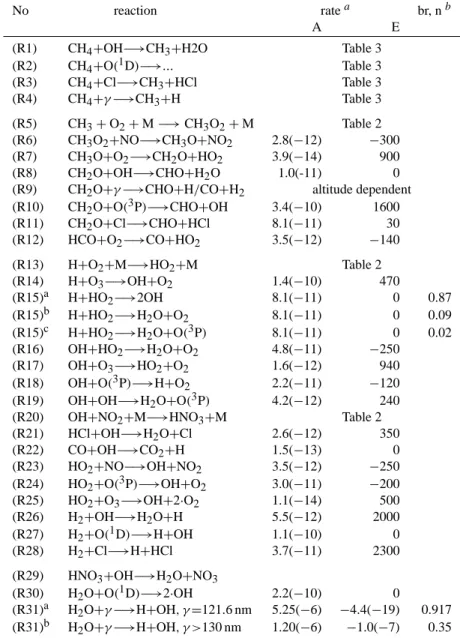
Table 1. Considered gas phase reactions.
No reaction ratea br, nb
A E
(R1) CH4+OH−→CH3+H2O Table 3
(R2) CH4+O(1D)−→... Table 3 (R3) CH4+Cl−→CH3+HCl Table 3 (R4) CH4+γ −→CH3+H Table 3 (R5) CH3+O2+M −→ CH3O2+M Table 2 (R6) CH3O2+NO−→CH3O+NO2 2.8(−12) −300 (R7) CH3O+O2−→CH2O+HO2 3.9(−14) 900 (R8) CH2O+OH−→CHO+H2O 1.0(-11) 0
(R9) CH2O+γ −→CHO+H/CO+H2 altitude dependent (R10) CH2O+O(3P)−→CHO+OH 3.4(−10) 1600
(R11) CH2O+Cl−→CHO+HCl 8.1(−11) 30 (R12) HCO+O2−→CO+HO2 3.5(−12) −140
(R13) H+O2+M−→HO2+M Table 2
(R14) H+O3−→OH+O2 1.4(−10) 470 (R15)a H+HO2−→2OH 8.1(−11) 0 0.87 (R15)b H+HO2−→H2O+O2 8.1(−11) 0 0.09 (R15)c H+HO2−→H2O+O(3P) 8.1(−11) 0 0.02 (R16) OH+HO2−→H2O+O2 4.8(−11) −250 (R17) OH+O3−→HO2+O2 1.6(−12) 940 (R18) OH+O(3P)−→H+O2 2.2(−11) −120 (R19) OH+OH−→H2O+O(3P) 4.2(−12) 240
(R20) OH+NO2+M−→HNO3+M Table 2
(R21) HCl+OH−→H2O+Cl 2.6(−12) 350 (R22) CO+OH−→CO2+H 1.5(−13) 0 (R23) HO2+NO−→OH+NO2 3.5(−12) −250 (R24) HO2+O(3P)−→OH+O2 3.0(−11) −200 (R25) HO2+O3−→OH+2·O2 1.1(−14) 500 (R26) H2+OH−→H2O+H 5.5(−12) 2000 (R27) H2+O(1D)−→H+OH 1.1(−10) 0 (R28) H2+Cl−→H+HCl 3.7(−11) 2300
(R29) HNO3+OH−→H2O+NO3
(R30) H2O+O(1D)−→2·OH 2.2(−10) 0
(R31)a H2O+γ −→H+OH, γ =121.6 nm 5.25(−6) −4.4(−19) 0.917
(R31)b H2O+γ −→H+OH, γ >130 nm 1.20(−6) −1.0(−7) 0.35
a rate constant k(T )=A· exp[−(E·K/T)] in cm3s−1
photolysis rate j (z)=A· exp[E·L(z)n]in s−1, with L(z): number of molecules cm−2above altitude z.
bbr: branching rate, n: exponent in j (z)
For some KIEs no temperature dependence is known and thus is set constant. For the reactions for which the KIE has not been explicitly measured, KIE is set to (µ0/µ)1/2, with
µ=m1·m2/(m1+m2)being the reduced mass of the reactants of mass m1and m2. This accounts for the fact that the rate constant of a certain reaction does not only depend on the re-activity of the reactants, but also on their collision frequency and thus thermal speed.
Additionally, the known oxygen exchange reactions were included (Table 5).
4.4 Trace gas parameter profiles
Fixed, globally, seasonally and diurnally averaged profiles are used for the trace gases O3, O(1D), NO, NO2, and Cl. These were derived from a simulation of the Mainz photo-chemical 2-D model (Grooß, 1996), as an annually and diur-nally averaged profile of the HNO3photolysis frequency.
2
Table 2. Termolecular reactions.
No. Reaction k3000 a n k300∞ b m (5) CH3+O2+M−→CH3O2+M 4.5×10⁻³¹ 3.0 1.8×10⁻¹² 1.7 (13) H+O2+M−→HO2+M 5.7×10⁻³² 1.6 7.5×10⁻¹¹ 0.0 (20) OH+NO2+M−→HNO3+M 2.5×10⁻³⁰ 4.4 1.6×10⁻¹¹ 1.7 ak 0(T )=k0300·(300T )−n bk ∞(T )=k300∞ ·(300T )−m rate constant k(M, T )=(1+(k k0(t )[M] 0(T )[M]/ k∞(T )))·0.6 (1+[log10(k0(t )[M]/ k∞(T ))]2)−1 [M]being the number concentrations of air molecules and T the temperature.
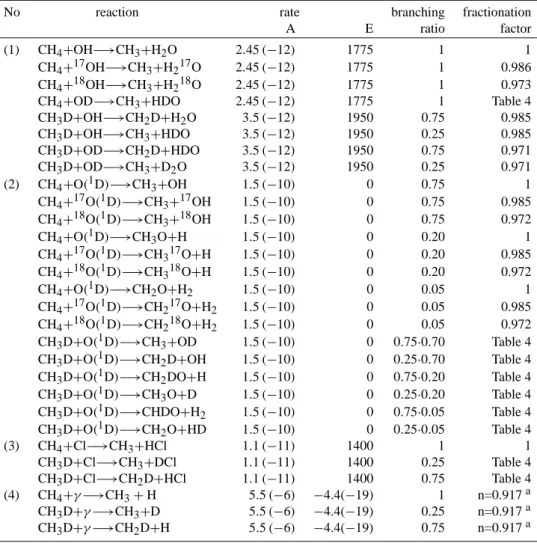
Table 3. Detailed description of the initial methane destruction reactions.
No reaction rate branching fractionation A E ratio factor (1) CH4+OH−→CH3+H2O 2.45 (−12) 1775 1 1
CH4+17OH−→CH3+H217O 2.45 (−12) 1775 1 0.986 CH4+18OH−→CH3+H218O 2.45 (−12) 1775 1 0.973
CH4+OD−→CH3+HDO 2.45 (−12) 1775 1 Table 4 CH3D+OH−→CH2D+H2O 3.5 (−12) 1950 0.75 0.985 CH3D+OH−→CH3+HDO 3.5 (−12) 1950 0.25 0.985 CH3D+OD−→CH2D+HDO 3.5 (−12) 1950 0.75 0.971 CH3D+OD−→CH3+D2O 3.5 (−12) 1950 0.25 0.971 (2) CH4+O(1D)−→CH3+OH 1.5 (−10) 0 0.75 1 CH4+17O(1D)−→CH3+17OH 1.5 (−10) 0 0.75 0.985 CH4+18O(1D)−→CH3+18OH 1.5 (−10) 0 0.75 0.972 CH4+O(1D)−→CH3O+H 1.5 (−10) 0 0.20 1 CH4+17O(1D)−→CH317O+H 1.5 (−10) 0 0.20 0.985 CH4+18O(1D)−→CH318O+H 1.5 (−10) 0 0.20 0.972 CH4+O(1D)−→CH2O+H2 1.5 (−10) 0 0.05 1 CH4+17O(1D)−→CH217O+H2 1.5 (−10) 0 0.05 0.985 CH4+18O(1D)−→CH218O+H2 1.5 (−10) 0 0.05 0.972 CH3D+O(1D)−→CH3+OD 1.5 (−10) 0 0.75·0.70 Table 4
CH3D+O(1D)−→CH2D+OH 1.5 (−10) 0 0.25·0.70 Table 4 CH3D+O(1D)−→CH2DO+H 1.5 (−10) 0 0.75·0.20 Table 4
CH3D+O(1D)−→CH3O+D 1.5 (−10) 0 0.25·0.20 Table 4 CH3D+O(1D)−→CHDO+H2 1.5 (−10) 0 0.75·0.05 Table 4
CH3D+O(1D)−→CH2O+HD 1.5 (−10) 0 0.25·0.05 Table 4
(3) CH4+Cl−→CH3+HCl 1.1 (−11) 1400 1 1 CH3D+Cl−→CH3+DCl 1.1 (−11) 1400 0.25 Table 4 CH3D+Cl−→CH2D+HCl 1.1 (−11) 1400 0.75 Table 4 (4) CH4+γ −→CH3+H 5.5 (−6) −4.4(−19) 1 n=0.917a CH3D+γ −→CH3+D 5.5 (−6) −4.4(−19) 0.25 n=0.917a CH3D+γ −→CH2D+H 5.5 (−6) −4.4(−19) 0.75 n=0.917a
aBrasseur and Solomon (1986), with photolysis rate j (z)=A· exp[E·L(z)n] in s−1, L(z) being the number of molecules per cm2 above
altitude z.
4.5 Isotope parameter profiles of O(3P), O3, O(1D), and NO
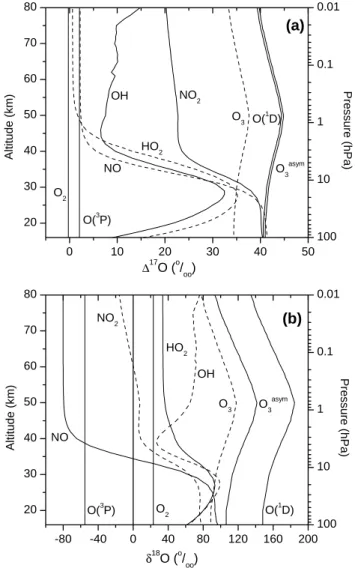
The oxygen isotope compositions assumed for O2, O(3P), O3, and O(1D) are indicated in Fig. 1 together with the calculated isotope profiles for NO, OH, and HO2.
The isotope composition of
(i) O2 is δ17O(O2) = 11.78‰ and δ18O(O2)=22.96‰ (Luz et al., 1999; Coplen et al., 2002),
(ii) O(3P) is controlled by the rapid exchange reaction with O2(Kaye and Strobel, 1983), which shows significant
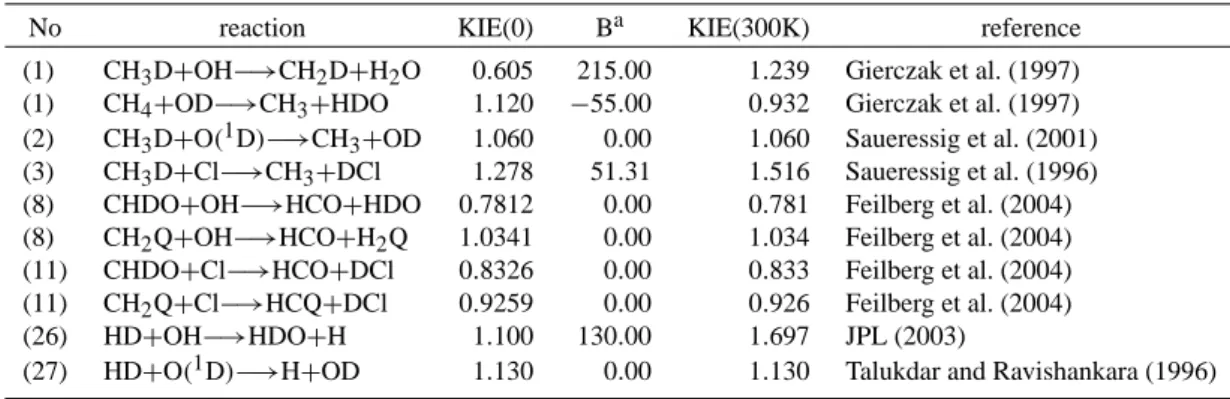
Table 4. Considered fractionation factors, defined as KIE(T)=KIE(0)· exp(B/T).
No reaction KIE(0) Ba KIE(300K) reference (1) CH3D+OH−→CH2D+H2O 0.605 215.00 1.239 Gierczak et al. (1997)
(1) CH4+OD−→CH3+HDO 1.120 −55.00 0.932 Gierczak et al. (1997)
(2) CH3D+O(1D)−→CH3+OD 1.060 0.00 1.060 Saueressig et al. (2001)
(3) CH3D+Cl−→CH3+DCl 1.278 51.31 1.516 Saueressig et al. (1996)
(8) CHDO+OH−→HCO+HDO 0.7812 0.00 0.781 Feilberg et al. (2004) (8) CH2Q+OH−→HCO+H2Q 1.0341 0.00 1.034 Feilberg et al. (2004)
(11) CHDO+Cl−→HCO+DCl 0.8326 0.00 0.833 Feilberg et al. (2004) (11) CH2Q+Cl−→HCQ+DCl 0.9259 0.00 0.926 Feilberg et al. (2004)
(26) HD+OH−→HDO+H 1.100 130.00 1.697 JPL (2003)
(27) HD+O(1D)−→H+OD 1.130 0.00 1.130 Talukdar and Ravishankara (1996)
aif B = 0, no temperature dependency has been measured so far.
Table 5. Considered oxygen isotope exchange reactions.
No reaction Rate reference
A E
(32) QH+NOOH+NQ 1.8(−11) 0 Dubey et al. (1997)
(33) QH+NO2OH+NOQ 1.0(−11) 0 Greenblatt and Howard (1989)
(34) QH+H2OOH+H2Q 1.6(−13) 2100 Greenblatt and Howard (1989)
(35) HOQ+OHHO2+QH 1.7(−11) −400 Dransfeld and Wagner (1987)
(36) Q+O2OQ+O see Sect. 4.5 (37) Q+NOO+NQ see Sect. 4.5
(38) NOQ+H2ONO2+H2Q 2.3(−13) 2100 Jaffe and Klein (1966)
(39) QH+O2OH+OQ <1(−17) 0 Greenblatt and Howard (1989)
(40) HOQ+O2HO2+OQ <3(−17) 0 Sinha et al. (1987)
(41) NOQ+O2NO2+OQ <1(−24) 0 Sharma et al. (1970)
fractionation and leads to δ17O(O(3P))=−27.58‰ and
δ18O(O(3P))=−55.30‰ (Johnston et al., 2000).
(iii) O3 was set to be solely dependent on temperature, because all laboratory data indicate negligible pressure dependence below 100 hPa and because it appears that all reliable atmospheric data agree with the enrichments determined in laboratory studies (Johnson et al., 2000; Mauersberger et al., 2001). The (consistent) laboratory data by Thiemens and Jackson (1988, 1990), Morton et al. (1990), and (G¨unther et al., 1999) are implemented under the assumption that 80% of the isotope enrichment of O3 is carried by the asymmetric QOO (Anderson et al., 1989; Janssen et al., 1999; Mauersberger et al., 1999).
Q(1D) is derived from the isotope enrichment in O3under the following further assumptions: (i) during the photoly-sis of O3 only the terminal oxygen atoms form O(1D), (ii) there is negligible fractionation during the photolysis of O3 (Wen and Thiemens, 1993), and (iii) mass-dependent colli-sion rates during subsequent quenching of O(1D) on N2and O2to the ground state O(3P) lead to additional isotope en-richment of 19‰ for δ17O and 36‰ for δ18O in O(1D) (cal-culated by using the formula given in Sect. 4.3).
The oxygen isotope composition of middle atmospheric NOx is not controlled by its main source, i.e. oxidation of N2O by O(1D), but by O exchange between Oxand NOx:
NO + O3→NO2+O2 (NO-1)
NO2+O(3P) → NO + O2 (NO-2)
and the fast O-exchange reactions:
NO + Q(3P) NQ + O(3P) (NO-3)
NO + QH NQ + OH (NO-4)
Indeed, because of the rapid photochemical cycling less than 0.5% of all O atoms in NO stem from the oxidation of N2O by O(1D) over the entire altitude range considered. Hence, the isotopic composition of N2O that is known to carry a small degree of MIF into the stratosphere (Cliff and Thiemens, 1997; Cliff et al., 1999; R¨ockmann et al., 2001a; R¨ockmann et al., 2001b; Kaiser and R¨ockmann, 2005) does not need to be considered. Using a sub-model, the O isotope (δ17O, δ18O) parameter profile of NO is derived by calcu-lating the source partitioning of the reactions 1 to NO-4. The inferred enrichments in NO and NO2(Fig. 1) in the
2 20 30 40 50 60 70 80 -80 -40 0 40 80 120 160 200 20 30 40 50 60 70 80 0 10 20 30 40 50 100 10 1 0.1 0.01 100 10 1 0.1 0.01 NO O(3P) (b) O(1D) O3asym O3 OH HO2 NO2 O2 δ18 O (o/oo) Al ti tu d e (km) NO2 O(3P) (a) O(1D) O3asym O3 OH HO2 NO O2 ∆17 O (o/oo) Alt it ude (km) Pressure (hPa) Pressure (hPa)
Fig. 1. Vertical profile of 117O (graph a) and δ18O (graph b) assumed for O2, O(3P), O3, asymmetric O3, and O(1D), and
cal-culated for NO, OH and HO2(without considering the isotope
ex-change reactions R39 and R40).
lower stratosphere (which is due to the O exchange with O3, reactions NO-1 and NO-2) is only about half the ones calcu-lated by Lyons (2001), explanation in Sect. 7. Because of the dominance of NO-3, the oxygen isotopic composition of NO in the mesosphere is similar to the one of O(3P).
4.6 Boundary conditions
At the lower model boundary, i.e. the tropopause, fixed trace gas and isotope mixing ratios are set as fol-lows: [H2O]=3.70 µmol/mol. δD(H2O)=−660‰ and δ18O(H2O)=−128‰ (Moyer et al., 1996; Johnson et al., 2001, Kuang et al., 2003, McCarthy et al., 2004).
117O(H2O) is set to 0‰ (as no process is known in the troposphere, which could cause MIF in H2O), so that δ17O(H2O) is –69.76‰ (in agreement with –(84 ± 31)‰ observed by Johnson et al., 2001). [CH4]=1.70 µmol/mol.
20 30 40 50 60 70 80 0 1 2 3 4 5 6 7 8 9 H2tot H2O H2 CH4 H2O, H2, CH4, H2tot[ppmv] Altitude [km] 100 10 1 0.1 0.01 Pres s u re [hPa]
Fig. 2. Calculated vertical profiles of H2O, CH4, H2, and H2tot
compared to measurements of H2O: balloon-borne in situ
Lyman-αhygrometer data at 43◦N (black diamonds) (Z¨oger et al., 1999), ATMOS data (light squares) (Michelsen et al., 2002), and HALOE data (line) (Nedoluha et al., 1998); CH4, H2: cryogenic collection
and subsequent laboratory analysis at 43◦N (Z¨oger et al., 1999), and H2tot: (Z¨oger et al., 1999).
δD(CH4)=−86‰ (Quay et al., 1999). [H2]=0.55 µmol/mol (Z¨oger et al., 1999). δD(H2)=130‰ (Friedman and Scholz, 1974; Rahn et al., 2003; Rhee et al., 2006). The flux of all considered species across the upper boundary (80 km) is set to zero.
5 Model results and comparison with observations The model results presented in this section constitute the “base run” where the badly quantified isotope exchange re-actions (R38) to (R41) (Table 5) are omitted. The influence of these badly quantified reactions is assessed in Sect. 6.5.
5.1 Vertical trace gas profiles
In Fig. 2 calculated vertical profiles for H2O, CH4, H2 and the total hydrogen Htot2 are compared with observations. The agreement is good. The difference above 70 km is due to the known strong seasonal variation in this altitude range. For instance, H2is expected to vary between 1 ppmv in July and nearly 3 ppmv in January at 70 km altitude (LeTexier et al., 1988).
The destruction of methane in the stratosphere leads to a relevant increase in water vapour. Maximum mixing ratios of 6.5 ppmv are observed at the stratopause. Above 50 km, increasing loss of H2O due to reaction with OH and above 65 km due to photolysis overcompensates H2O formation and causes a decline in H2O and an increase in H2. The total hydrogen Htot2 stays constant in the middle atmosphere. The weak decrease in the mesosphere comes along with increas-ing concentrations of atomic hydrogen H.
5.2 Vertical profiles of δD(H2O), δD(CH4), and δD(H2) The calculated profiles of δD in H2O, CH4, and H2likewise compare well with observations and the model results ob-tained by Ridal (2002) for δD(H2O) (Fig. 3).
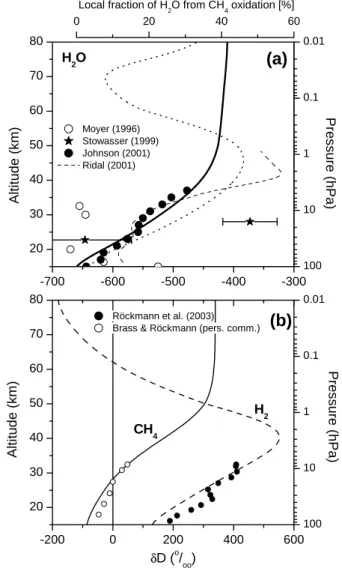
Apart from the Arctic profile retrieved by (Stowasser et al., 1999), all available δD(H2O) observations (Sect. 2) (al-though somewhat differing in absolute concentrations) show a vertical increase by ∼(150–200)‰ between 20 and 40 km. This vertical δD(H2O) increase is due to the increasing frac-tion of H2O that originates from the oxidation of CH4(see Sect. 3). The δD(H2O) value in the mesosphere, which is higher than the tropopause value by ∼250‰, suggests that ∼60% of the mesospheric H2O originate from the tro-posphere and ∼40% stem from the oxidation of CH4 (see Sect. 6.3).
The δD profiles of CH4 and H2 agree well with in-situ sampling and subsequent mass-spectrometric labora-tory measurements by R¨ockmann et al. (2003) and Brass et al. (MPI-K Heidelberg, personal communication).
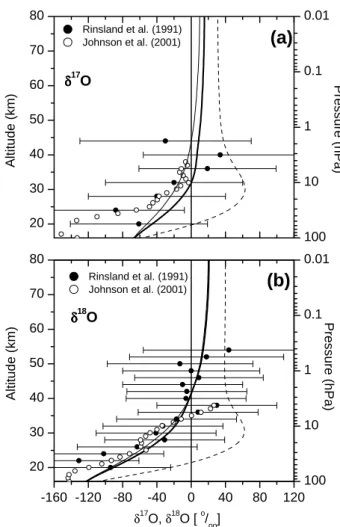
5.3 Vertical Profiles of δ17O(H2O) and δ18O(H2O) The oxygen isotope ratios in H2O (Fig. 4) exhibit a vertical profile that is qualitatively similar to that of δD(H2O). How-ever, for the O isotopologues in addition to new H2O for-mation photochemical recycling, that is exchange of oxygen isotopes with O2and O3via HOx- and NOx-species, causes additional intensive turnover of δ17O(H2O) and δ18O(H2O). As a consequence, the relative enrichments are even stronger than for δD, and positive values for δ17O and δ18O are reached. Note that both recycled H2O and newly formed H2O have the same O isotope signature since both are pro-duced mainly via HOx(see Sect. 6.4).
The measurements by Dinelli et al. (1991), Guo et al. (1989), Rinsland et al. (1991), and Johnson et al. (2001) are in reasonable agreement with our model results. Con-sider however the large measurement errors of ±(50–120)‰ which is in the same magnitude as the calculated total vertical increase by 85‰ for δ17O(H2O) and 150‰ for δ18O(H2O).
6 Discussion
6.1 The budget of middle atmospheric water vapour
Figure 5 exhibits the turnover rates of water vapour in the middle atmosphere. The annual flux of tropospheric water into the stratosphere is set to 788 Mt (Yang and Tung, 1996). In the stratosphere further 63.9 Mt H2O (and 0.31 Mt H2) is net produced due to the oxidation of CH4. The calculated an-nual CH4destruction rate is 30 Mt yr−1. This value is slightly lower than the (40±10) Mt yr−1 often reported (Crutzen, 1995; Lelieveld et al., 1998), but agrees with Gettelmann et al. (1998) and exceeds earlier values given by Crutzen (1991) and Khalil et al. (1993). The calculated ratios between H2O
20 30 40 50 60 70 80 -700 -600 -500 -400 -300 0 20 40 60 100 10 1 0.1 0.01 20 30 40 50 60 70 80 -200 0 200 400 600 100 10 1 0.1 0.01 Local fraction of H 2O from CH4oxidation [%] Moyer (1996) Stowasser (1999) Johnson (2001) Ridal (2001) Altitude (km) Pressure (hPa)
(a)
Röckmann et al. (2003) Brass & Röckmann (pers. comm.)CH4 H2 H2O
(b)
δD (o/oo) Altitude (km) Pressure (hPa)Fig. 3. Calculated vertical profile of δD in H2O (graph a, thick
line), and CH4and H2(graph b) compared to measurements. (a)
Dotted line: δD of freshly produced H2O. Open circles: ATMOS FTIR data of near-global latitudinal coverage (Moyer et al., 1996). Full circles: Smithsonian Astrophysical Observatory’s far-infrared data by Johnson et al. (2001a). Stars: Balloon-borne MIPAS data inside the Arctic vortex at 68◦N (Stowasser et al., 1999). Dashed line: 1-D model result by Ridal et al. (2001). Upper x-axis indicates the approximate fraction of H2O from the CH4oxidation inferred
from the δD(H2O) value (explanation, see Sect. 6.3). (b) Full and
open circles: Laboratory mass-spectrometer data of in-situ samples.
and H2production and CH4loss for the entire middle atmo-sphere are: P(H2O) L(CH4) =1.90 and P(H2) L(CH4) =0.10 (5)
Using a coupled chemistry/dynamical model (LeTexier et al., 1988) derived P(H2O)/L(CH4)=1.6 which is in agreement with satellite observations by Hanson and Robinson (1989). More recent in situ measurements indicated higher values of 1.94±0.27 (Dessler et al., 1994), 1.82±0.21 (Engel et al.,
2 20 30 40 50 60 70 80 -160 -120 -80 -40 0 40 80 120 20 30 40 50 60 70 80 100 10 1 0.1 0.01
(b)
δδδδ17 O δδδδ18 O Rinsland et al. (1991) Johnson et al. (2001) Pressure (hPa) δ17 O,δ18O [o/oo] Alt it ude (km) 100 10 1 0.1 0.01(a)
Rinsland et al. (1991) Johnson et al. (2001) Al ti tu d e (km) Pressure (hPa)Fig. 4. Calculated vertical profiles of δ17O(H2O) (graph a)
and δ18O(H2O) (graph b) compared to ATMOS Spacelab 3
in-frared solar spectra near 30◦N (Rinsland et al., 1991) and FTIR balloon-borne data at 33◦and 68◦N (Johnson et al., 2001). Thick straight lines: base run. Dashed lines: Oxygen exchange reaction (R38) (NOQ+H2ONO2+H2Q) is considered at its estimated up-per limit. Thin straight lines: Oxygen exchange reactions (R39) (QH+O2OH+OQ) and (R40) (HOQ+O2HO2+OQ) are con-sidered at their estimated upper limits.
1996), 1.973±0.003 (Hurst et al., 1999), and 1.975±0.030 (Z¨oger et al., 1999), which are in reasonable agreement with our model results.
Interestingly, although each CH4molecule finally results in the formation of almost two H2O molecules (Eq. 5), most hydrogen atoms in CH4make the detour via other gases to H2O, as demonstrated in Fig. 6. Only ∼15% of all H2O molecules are formed directly from one of the four H atoms of CH4or intermediate products in the CH4destruction chain (such as formaldehyde, CH2O), i.e., are produced via reac-tions: CH4+OH → CH3+H2O (R1) CH2O + OH → CHO + H2O (R8) tropo sphere strato sphere meso sphere OHx H2O 788 (87.6) H2O 30.0 (3.8) CH4 838 (93.1) H2O gross 263 (29.2) H2O 0.31 H2 63.9 (7.1) H2O
Fig. 5. Middle atmospheric budget of H2O. Numbers are mass
fluxes in Mt yr−1. Numbers in parenthesis are fluxes of H2 in
Mt yr−1. The H2O flux into the stratosphere is adopted from Yang
and Tung (1996), other numbers are model results.
20 30 40 50 60 70 80 0 20 40 60 80 100 H OH HCl H 2 HO 2 H 2O fraction (%) Al ti tu d e (km) 100 10 1 0.1 0.01 Pressure (hPa)
Fig. 6. Calculated percentage fraction of hydrogen atoms that are transferred during the initial oxidation reaction of CH4either to
H2O, OH, OH2, H, H2, or HCl.
The other ∼85% of the H atoms in CH4are incorporated first in OH, HO2, H2, H, or HCl, before ending up in H2O. This detour the H atoms take from CH4to H2O certainly affects not only the isotope composition of the final product H2O, but also that of the intermediate species (OH, HO2, HCO, H2, H, HCl etc.).
Figure 7 presents the vertical profile of H2O produc-tion P(H2O) and loss L(H2O). Both P(H2O) (dominated by the reaction OH+HO2→H2O+O2 – Kaye, 1990) and L(H2O) (more than 99% of which are due to the reaction of H2O+O(1D)→2 OH) peak at ∼38 km altitude. The net rate, P(H2O) – L(H2O), amounts to ∼27% of P(H2O) only. It shows a wide maximum centred at 35–40 km, that is ∼5 km above the maximum of the CH4loss rate (for better compar-ison 2×L(CH4)is shown, dotted line). This again empha-sises that during the oxidation of CH4most H atoms are first
incorporated in intermediate species (where the longer lived ones H2, HCl, and HNO3 experience spatial redistribution) before ending up in H2O, and that a considerable turnover of H2O molecules occurs in the middle atmosphere which significantly exceeds the net production of H2O.
6.2 The chemical lifetimes of H2O, δD(H2O), δ17O(H2O), and δ18O(H2O)
Division of the local H2O concentration by the local H2O loss rate L(H2O) yields the chemical lifetime of H2O, τ (H2O), at a certain altitude (Fig. 7b). As the same reactions control the loss of HDO molecules, the chemical lifetime of HDO, τ (HDO), is identical with τ (H2O). In the entire middle atmosphere τ (H2O) or τ (HDO), respectively, (like τ (CH4)) exceeds the vertical transport time scale H2/Kz(H being the local scale height and Kzthe vertical eddy diffusion coefficient). That is, neither H2O nor HDO is in photochem-ical equilibrium in the middle atmosphere. Only between 35 and 50 km altitude, the transport time scale almost com-pares with the photochemical lifetime of H2O (and HDO), in agreement with (LeTexier et al., 1988). Below 35 km,
τ (H2O) and τ (HDO) exceeds ∼5 years.
Consider moreover, that the influence of in-situ H2O pro-duction due to CH4 oxidation on δD(H2O) is small below ∼30 km, too. This can be seen in Fig. 7a, when the net H2O production (black line) displayed in molecules cm−3s−1 is divided by the pressure, which gives the H2O production in ppmv s−1. This number peaks at 45 km and is small below
∼30 km.
The latter conclusion and the long chemical lifetime im-plies that below 30–35 km the H2O mixing ratio as well as its δD value is largely dominated by transport, i.e. by verti-cal transport for the present 1-D model. Thus, between the tropopause and 30-35 km the H2O mixing ratio and its δD value is determined by (vertical) mixing of two reservoirs, the one at the tropopause which is controlled by (physical) fractionation processes in the troposphere, and the second above 30–35 km which is determined by the dominant H2O loss reaction (R30).
For the oxygen isotopologues δ17O(H2O) and δ18O(H2O), additional oxygen exchange of H2O with other gases (Reac-tions R34 and R38) causes somewhat shorter lifetimes of the
δ17O and δ18O signature of the stratospheric water vapour. Moreover, the vital recycling of water (via HOxspecies) only weakly affects the δD(H2O) value, because H2O is the major hydrogen reservoir in the mesosphere. This is not the case for δ17O(H2O) and δ18O(H2O), where the many intermedi-ate species involved in the H2O recycling process exchange oxygen atoms with the other major oxygen “reservoirs” O2 and O3. 20 30 40 50 60 70 80 -20 -15 -10 -5 0 5 10 15 20 25 20 30 40 50 60 70 80 0.01 0.1 1 10 100 1000
(
a
)
H2O loss 2 CH4loss H2O net production production/loss (1000 cm-3s-1) Altitude (km) H2O gross production CH4 h2/kz Altitude (km) lifetime (yr) H2O(
b
)
Fig. 7. (a) calculated vertical profiles of H2O production and loss
rates in the middle atmosphere. For comparison, the double CH4
loss rate is shown (as almost two H2O molecules are net produced
for each oxidised CH4 molecule, see Eq. 5). (b) comparison of
the photochemical lifetime of H2O and CH4with the transport time
scale (h2/ kz, with h: atmospheric scale height and kz: vertical eddy
diffusion coefficient).
6.3 δD(H2O) as tracer for CH4oxidation
Tropospheric H2O is imported into the stratosphere with δD(H2O)≈−660‰ (Moyer et al., 1996; Johnson et al., 2001; Kuang et al., 2003; McCarthy et al., 2004). Tropospheric CH4carries much higher δD values of roughly −86‰ (Quay et al., 1999) into the stratosphere. The vertically increasing contribution of H2O produced by the oxidation of CH4is de-scribed by the upper x-axis of Fig. 3. It shows the local frac-tion of H2O from CH4oxidation F , that is the ratio between the difference of the local δD(H2O) value to the tropopause value (–660‰) and the difference of the δD(H2O) from the
2 CH4 oxidation (set to –86‰) and the δD(H2O) tropopause
value, i.e.,
F = δD(H2O) − (−660‰)
−86‰ − (−660‰) (6)
Figure 3 indicates that ∼40% of the water vapour present above 40 km originate from the oxidation of CH4. For sim-plicity, we have set δD(CH4) constant, although in reality it varies with altitude (Fig. 3b). The influence of this simplifi-cation is surprisingly weak. This has two reasons. First, the contributions of the three main CH4loss reactions (R1–R3) are comparable throughout the middle and upper stratosphere (where the major CH4loss occurs). Second, due to the long chemical lifetime of H2O (and HDO), spatial redistribution smears out the anyway weak vertically changing δD(H2O) source signature.
Unfortunately, this fact also documents that the δD(H2O) value does not constitute a sensitive measure for quantify-ing the partitionquantify-ing of the different CH4loss reaction chains, contrary to its initial assumption.
Another surprising feature is that both, the δD value of the source molecule CH4 and the one of the end product H2O increase with altitude (Fig. 3), although mass conservation for δD at a first glance suggests the opposite behaviour. In all methane oxidation reactions the most abundant CH4 re-acts faster than the isotopically substituted CH3D (Sect. 3). Hence, the remaining CH4 is continuously enriched in D/H with altitude. The D/H ratio of the freshly formed H2O is cer-tainly much lower (dotted line) but is still higher than the D/H ratio of the H2O lofted from below. Thus, both the δD value of CH4and of freshly produced H2O increases with altitude. Note that for an isotope mass balance the δ values must be multiplied with the concentrations. Here, the concentration of the “D-richer” source CH4 decreases and the concentra-tion of the D-depleted product H2O increases. Thus, mass balance is achieved although both δ values increase.
6.4 δ17O(H2O) and δ18O(H2O) as tracer for transport and chemistry
As outlined in Sect. 3, the oxygen isotope signature of mid-dle atmospheric water vapour is determined by the partition-ing of four oxygen isotope sources: (1) mass-dependently fractionated (MDF) H2O imported from the troposphere, (2) mass-independently fractionated (MIF) H2O formed as a fi-nal product of the oxidation of CH4, (3) MIF carrying H2O from the recycling of H2O via the HOxfamily and (4) oxy-gen atom exchange between H2O and other gases.
The δ17O and δ18O values of source (1), i.e. of H2O im-ported from the troposphere, are about –67‰ and –128‰, respectively (see Sect. 4.6). The δO values of water pro-duced by the isotope sources (2) to (4) are controlled by the respective educt molecules and the kinetic isotope fractiona-tion factor KIE of the relevant reacfractiona-tion. As outlined by Kaye (1990) and confirmed by our calculations, more than 99% of
all H2O molecules generated in the middle atmosphere are due to hydrogen abstraction reactions by OH. Thus, the iso-tope sources (2) and (3) will show the O isoiso-tope signature of OH at the respective altitude. H2O itself undergoes oxygen isotope exchange (i.e. isotope source 4) with OH (R34) and NO2 (R41, Table 5). Reaction (R34) is too slow to signifi-cantly affect the isotope composition of H2O. The rate con-stant of Reaction (R38) was not quantified yet; its potentially considerable impact is addressed in Sect. 6.5.
In conclusion, the modification of the oxygen isotope com-position of middle atmospheric H2O is controlled by the oxy-gen isotope composition of OH. For this reason, the oxyoxy-gen isotope signature of the different OH sources is studied next. Reaction chains where OH is converted into HO2and back into OH without breaking the initial OH bond constitute a zero cycle with respect to the oxygen isotopic composition. Thus, only reactions forming new OH bonds need to be con-sidered.
6.4.1 The formation of new OH bonds
The influence of the most important reactions forming new OH bonds are displayed in Fig. 8a. Four classes of reactions, distinguished by the O isotope signal transferred, form new OHxbonds:
(i) HOx that receives the oxygen isotope signature from molecular oxygen via
CH3O + O2→HO2+CH2O (R7)
HCO + O2→HO2+CO (R12)
H + O2+M → HO2+M (R13)
Reactions (R7) and (R12) are part of the CH4 oxidation chain and only play a role below 40 km. Reaction (R13) clearly dominates the formation of new OH bonds in the mesosphere. In addition, oxygen isotope exchange between OHx and O2 may occur (Reactions R39 and R40) the influence of which are discussed in Sect. 6.5.
(ii) HOx that receives the oxygen isotope signature from MIF carrying ozone via
H + O3→OH + O2 (R14)
which is important above 40 km only. Although O3 also influences the isotope composition of HO2 via OH+O3→HO2+O2, new OH bonds are not formed. The reason is that the oxygen atom that OH receives from O3is lost again, simply because HO2is an asymmetric molecule (H–O–O).
(iii) HOx that receives the oxygen signature from MIF carrying O(1D) and, in the case of Reaction (R30), from H2O:
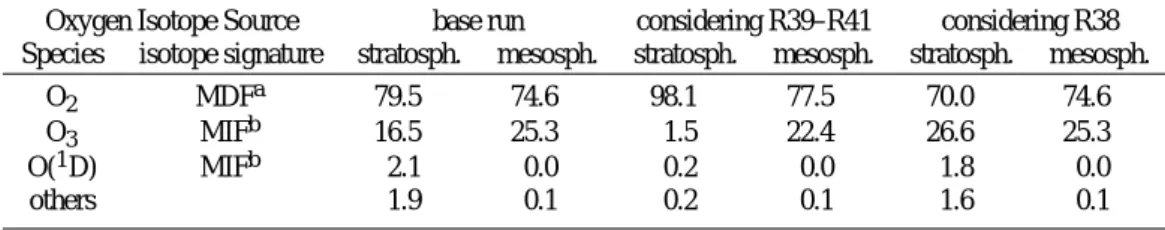
Table 6. Percentage origin of oxygen isotopes of freshly produced H2O averaged over stratosphere and mesosphere.
Oxygen Isotope Source base run considering R39–R41 considering R38 Species isotope signature stratosph. mesosph. stratosph. mesosph. stratosph. mesosph.
O2 MDFa 79.5 74.6 98.1 77.5 70.0 74.6
O3 MIFb 16.5 25.3 1.5 22.4 26.6 25.3
O(1D) MIFb 2.1 0.0 0.2 0.0 1.8 0.0
others 1.9 0.1 0.2 0.1 1.6 0.1
aMDF = mass-dependently fractionated bMIF = mass-independently fractionated
H2+O(1D) → OH + H (R27)
H2O + O(1D) → 2 OH (R30)
while the most important of them, Reaction (R30), plays only a modest role between 30 and 45 km.
(iv) HOx that receives the oxygen isotope signature from NOx:
QH + NO OH + NQ (R32)
QH + NO2 OH + NOQ (R33)
while the oxygen isotope composition of NOxis controlled by reactions with the O2and O3reservoirs (Sect. 4.4). 6.4.2 The origin of oxygen atoms incorporated in H2O On the basis of Sect. 6.4.1, the influence of each oxy-gen source (O2, O3, O(1D), and NOx) for the oxygen iso-tope composition of freshly produced H2O is assessed. As demonstrated in Fig. 8 and listed in Table 6, molecular oxy-gen clearly dominates as source of oxyoxy-gen atoms transferred to water vapour in the entire middle atmosphere. In the model base run (R38 to R41 are omitted), of all oxygen iso-topes incorporated in H2O in stratosphere and mesosphere, respectively, ∼78% and ∼70% stem from O2, ∼17% and ∼30% from O3, ∼2% and ∼0% from O(1D), and ∼2% and ∼0% from other gases such as HNO3or H2O itself (Fig. 8). Another interesting feature is that in the stratosphere ∼50% of the overall oxygen isotope transfer to H2O proceeds in two steps, that is from O2and O3to NOxand then from NOxvia HOxto H2O.
This oxygen isotope source partitioning (Fig. 8, Ta-ble 6) is reflected in the strongly structured vertical pro-files of δ17O(H2O) and δ18O(H2O) of freshly produced H2O (Fig. 9). Two maxima occur, both due to oxygen atom trans-fer from O3 to H2O. In the stratosphere, it is the oxygen transfer chain O3 O → NOx O → HOx O → H2O. In the meso-sphere with the high concentrations of atomic hydrogen, it is caused by H+O3→OH+O2(Reaction R14) and subsequent O transfer from OH to H2O. 20 30 40 50 60 70 80 1000 10000 100000 1000000 100 10 1 0.1 0.01 20 30 40 50 60 70 80 0 10 20 30 40 50 60 70 80 90 100 R30: H2O + O(1D) -> 2 OH R32: QH + NO <-> OH + NQ R14: H + O 3 -> OH + O2 R13: H + O2 + M -> HO2 + M OH production (cm-3 s-1) Altitude (km) sum
(a)
Pressure (hPa) others NO <-> O2(b)
O(1D) O3 O2 NO <-> O3 Percentage (%) Altitude (km)Fig. 8. (a) Four most important reactions that lead to the formation
of new OH bonds. (b) Percentage fraction of oxygen atoms origi-nating from the “reservoirs” O2, O3, and O(1D) in freshly produced
H2O. Thick straight lines separate the three different reservoirs. In
the stratosphere, considerable oxygen transfer from O2and O3to H2O occurs via the NOxfamily (grey areas).
2 20 30 40 50 60 70 80 0 10 20 30 40 50 60 70 80 100 10 1 0.1 0.01 δδδδ17 O δδδδ18 O δ17 O(H2O) andδ18 O(H2O) Alt it ude (km) Pressure (hPa)
Fig. 9. Vertical profiles of δ17O(H2O) and δ18O(H2O) of freshly produced H2O.
6.4.3 117O(H2O) as a tracer of MIF transfer from O3 to H2O
The last Sect. 6.4.2 revealed that the pathway of MIF from O3to H2O is different compared to the one from O3to CO2. CO2 is assumed to receive the MIF signal exclusively from O(1D) (produced by the photolysis of O3) via the short-lived intermediate CO03(Yung et al., 1991, 1997; Barth and Zahn, 1997). In the case of H2O, O(1D) is only weakly involved in the oxygen isotope transfer (Table 6). In the stratosphere wa-ter vapour receives only ∼15% of its MIF signal from O(1D). In the mesosphere O(1D) does not play any role at all.
As indicated in Fig. 8, in the stratosphere MIF trans-fer from O3 to H2O basically proceeds in three steps, first MIF transfer from O3 to NOx species (via reaction NO-1: NO+O3−→NO2+O2, Sect. 4.5), then from NOx to OHx and finally transfer to H2O due to H-abstraction by OH. This quite efficient oxygen transfer chain leads to peak-ing 117O(H2O) values of ∼10‰ around ∼32 km altitude (Fig. 10). In the mesosphere, NOx species are not in-volved. There, the entire MIF transfer from O3 to HOx (and from there to H2O) proceeds via Reaction (R14): H+O3−→OH+O2.
6.5 Sensitivity study: Influence of additional oxygen iso-tope exchange reactions
The results discussed so far constitutes the “base run” in which the already quantified (oxygen) isotope exchange re-actions (R32) to (R37) (Table 5) were considered. The last Sect. 6.4 actually revealed the importance of the oxygen tope exchange reaction (R32) (see Fig. 8) for the oxygen iso-tope composition of OH and thus freshly produced H2O.
If the three further, still unquantified exchange reactions with the O2reservoir (R39) to (R41) are considered at their estimated upper limit (Table 5), δ17O and δ18O of water
20 30 40 50 60 70 80 0 5 10 15 20 25 30 R39 - R41 are considered R38 is considered Pressure (hPa) ∆17 O (o/oo) Alt it ude (km) base run 100 10 1 0.1 0.01
Fig. 10. Calculated vertical profile of 117O(H2O). Thick
straight line: base run. Dashed line: Oxygen exchange reaction (R38) (NOQ+H2ONO2+H2Q) is considered at its estimated
up-per limit. Thin straight line: Oxygen exchange reactions (R39) (QH+O2OH+OQ) and (R40) (HOQ+O2HO2+OQ) are
con-sidered at their estimated upper limits.
vapour (and OH) are slightly lower (thin lines in Fig. 4), but the MIF signal is completely washed out (Fig. 10).
On the contrary, if the isotope exchange reaction (R38) (NOQ+H2ONO2+H2Q) is considered at the rate mea-sured forty years ago by Jaffe and Klein (1966), the enrich-ment in δ17O and δ18O (Fig. 4) as well as the MIF signal (Fig. 10) strongly increases in the stratosphere and reaches values of 117O(H2O)≈30‰ at ∼29 km altitude.
This strong sensitivity to isotope exchange reactions doc-uments the urgent need for better quantified rate constants of the relevant reactions.
7 Conclusions
Application of a simple 1-D isotope chemistry box model demonstrates that a significant number of chemical reac-tions with diverse gases cause considerable fractionation of all three stable isotope ratios D/H,17O/16O, and18O/16O in middle atmospheric water vapour relative to values at the tropopause. This makes a description much more compli-cated compared to other trace gases such as CO2, CH4, and N2O.
δD(H2O) was modelled to increase from –660‰ at the tropopause to –410‰ above 40 km, which is in excellent agreement with the observations. This increase by ∼250‰ corresponds to a fraction of ∼40% of H2O produced as end product of the oxidation of CH4. Although the D frac-tionation factors of the individual CH4 oxidation reactions with OH, O(1D), and Cl differ strongly, the δD(H2O) value turned out to be no sensitive tracer to distinguish between
the different CH4 oxidation chains. This has two reasons. First, the major CH4 loss occurs in the middle and upper stratosphere where the reactions with O(1D) which comes along with weak isotope fractionation dominates. Second, the chemical lifetime of H2O is long in the middle atmo-sphere. This allows for significant redistribution and thus weakening of spatial gradients of δD(H2O).
The results for the oxygen isotope ratios 17O/16O, and 18O/16O are less robust, because of the many reactions in-volved in the oxygen isotope transfer from the reservoirs to H2O and the many badly or not quantified isotope frac-tionation factors and oxygen isotope exchange reactions. In the base run, where the Reactions (R38), (R39) and (R40) are not considered, δ17O(H2O) and δ18O(H2O) are calcu-lated to increase relative to the tropopause by up to ∼85‰ and ∼145‰, respectively, which is also in agreement with the observations. Fractionation of the oxygen isotope ratios in H2O was demonstrated to be determined almost exclu-sively by the isotope signature of OH. The oxygen isotopic composition of OH, in turn, is mainly controlled by the one of O2 that is mass-dependently fractionated (MDF). In the stratosphere and mesosphere, respectively, ∼78 and ∼70% of all oxygen atoms transferred to H2O stem from O2, while ∼17 and ∼30% originate from O3that is mass-independently fractionated (MIF). As a result, the calculated MIF signal of H2O is only modest and reaches values of 117O(H2O)=10‰ at 30–35 km altitude.
However, if beyond the base run, further badly quantified oxygen isotope exchange reactions with O2(R39 and R40) are considered at their estimated upper limit, the MIF sig-nature completely vanishes in middle atmospheric H2O. In contrast, if the isotope exchange reaction of H2O with NO2 (Reaction R38) is considered, the MIF signal reaches high values of 117O(H2O)=30‰ around 29 km. Indeed and in any case, the transfer of the MIF signature in O3to OH and H2O proceeds primarily via NOxspecies in the stratosphere and directly via the reaction of H+O3→OH+O2in the meso-sphere. That is, the MIF transfer from O3 to H2O is quite different from the one from O3to CO2where it proceeds via O(1D) and the intermediate complex CO∗3.
The largest unknowns in our calculations are the unquan-tified reaction rates of a few oxygen isotope exchange reac-tions, in particular of OHxand NOxwith O2, and the many unquantified isotope fractionation factors of the reactions in-volved in the isotope transfer to H2O. In this respect, the most urgent need in this research field is the development of more precise techniques to measure the isotope composition of wa-ter vapour both in the laboratory and atmosphere.
Finally, the calculated MIF signal transferred to HOx and thus to H2O is only half as large as the one deter-mined by Lyons (2001). This discrepancy arises from the different 117O signatures assumed for the asymmet-ric O3 molecule and O(1D). Lyons (2001) used (i) the branching ratios of 0.43 and 0.57 for δ18O in the reac-tion of O+QO−→OQO and QOO as measured by Janssen
et al. (1999) for δ17O, too, and (ii) the isotope fractiona-tion factors for this reacfractiona-tion measured by Mauersberger et al. (1999). This assumption led to 117O values of asym-metric O3 of 117O(QOO)=∼85‰, and together with the mean 117O values of O3 of 117O(O3)=∼38‰, to 117O values of symmetric O3of 117O(OQO))=−50‰ only (be-cause 117O(O3)=2/3 117O(QOO)+1/3 117O(OQO)). Such a strong difference in 117O between asymmetric and sym-metric ozone is unlikely (C. Janssen, personal communica-tion). In contrast, we assumed identical ratios of the enrich-ments of δ17O and δ18O in QOO and OQO. That is, in the stratosphere we apply mean 117O values of 34‰ for O3, which is in agreement with Lyons (2001), but 117O values of 39‰ for QOO and 25‰ for OQO.
Acknowledgements. We thank U. Platt for his scientific assistance
during the early preparation phase. Edited by: U. P¨oschl
References
Anderson, S. M., Morton, J., and Mauersberger, K.: Laboratory measurements of ozone isotopomeres by tunable diode laser ab-sorption spectroscopy, Chem. Phys. Lett., 156, 175–180, 1989. Baertschi, P.: Absolute18O content of standard mean ocean water,
Earth and Plan. Sci. Lett., 31, 341–344, 1976.
Barth, V. and Zahn, A.: Oxygen isotope composition of carbon dioxide in the middle atmosphere, J. Geophys. Res., 102, 12 995– 10 007, 1997.
Brasseur, G. P. and Solomon, S.: Aeronomy of the mid-dle atmosphere, D. Reidel Publishing Company, Dor-drecht/Boston/Lancaster/Tokyo, 1986.
Cliff, S. S. and Thiemens, M. H.: The18O/16O and17O/16O ra-tios in atmospheric nitrous oxide: A mass-independent anomaly, Science, 278, 1774–1775, 1997.
Cliff, S. S., Brenninkmeijer, C. A. M., and Thiemens, M. H.: First measurement of the18O/16O and17O/16O ratios in stratospheric nitrous oxide: A mass-independent anomaly, J. Geophys. Res., 104, 16 171–16 175, 1999.
Coplen, T. B., Bohlke, J. K., De Bievre, P., Ding, T., Holden, N. E., Hopple, J. A., Krouse, H. R., Lamberty, A., Peiser, H. S., Revesz, K., Rieder, S. E., Rosman, K. J. R., Roth, E., Taylor, P. D. P., Vocke, R. D., and Xiao, Y. K.: Isotope-abundance variations of selected elements (IUPAC Technical Report), Pure Appl. Chem., 74, 10, 1987–2017, 2002.
Craig, H.: Standard for reporting concentrations of deuterium and oxygen-18 in natural waters, Science, 133, 1833–1834, 1961. Crutzen, P. J.: Methane’s sinks and sources, Nature, 350, 380–381,
1991.
Crutzen, P. J.: On the role of CH4 in atmospheric chemistry:
sources, sinks and possible reductions in anthropogenic sources, Ambio, 24, 52–55, 1995.
DeMore, W. B., Howard, C. J., Sander, S. P., Ravishankara, A. R., Golden, D. M., Kolb, C. E., Hampson, R. F., Molina, M. J., and Kurylo, M. J.: Chemical kinetics and photochemical data for use in stratospheric modeling, Pasadena, CA: JPL Publication 97-4, 1997.
2
Dessler, A. E., Weinstock, E. M., Anderson, J. G., and Chan, K. R.: Mechanisms controlling water vapor in the lower stratosphere: A tale of two stratospheres, J. Geophys. Res., 100, 23 167–23 172, 1995.
Dessler, A. E. and Sherwood, S. C.: A model of HDO in the tropi-cal tropopause layer, Atmos. Chem. Phys., 3, 2173–2181, 2003, mboxhttp://www.atmos-chem-phys.net/3/2173/2003/.
DeWit J. C., Van der Straaten, C. M., and Mook, W. G.: Determina-tion of the absolute D/H ratio of V-SMOW and SLAP, Geostand. Newslett., 4, 33–36, 1980.
Dinelli, B. M., Lepri, G., Carlotti, M., Carli, B., Mencaraglia, F., Ridolfi, M., Nolt, I. G., and Ade, P. A. R.: Measurements of the isotope ratio distribution of HD16O and H182 O in the 20–38 km altitude range from far-infrared spectra, Geophys. Res. Lett., 24, 2003–2006, 1997.
Dinelli, B. M., Carli, B., and Carlotti, M.: Measurement of strato-spheric distribution of H162 O, H182 O, H172 O and HD16O from far infrared spectra, J. Geophys. Res., 96, 7509–7514, 1991. Dubey, K., Mohrschladt, R., Donahue, N. M., and Anderson, J.
G.: Isotope specific kinetics of hydroxyl radical (OH) with water (H2O): Testing models of reactivity and atmospheric
fractiona-tion, J. Phys. Chem., 101, 1494–1500, 1997.
Engel, A., Schiller, C., Schmidt, U., Borchers, R., Ovarlez, H., and Ovarlez, J.: The total hydrogen budget in the Arctic winter strato-sphere during EASOE, J. Geophys. Res., 101, 14 495–14 503, 1996.
Feilberg, K. L., Johnson, M. S., and Nielsen, C. J.: Relative reaction rates of HCHO, HCDO, DCDO, H13CHO, and HCH18O with OH, Cl, Br, and NO3radicals, J. Phys. Chem., 108, 7393-7398,
2004.
Forster, P. M. de F. and Shine, K. P.: Stratospheric water vapour changes as a possible contributor to observed stratospheric cool-ing, Geophys. Res. Lett., 26, 3309–3312, 1999.
Forster, P. M. de F. and Shine, K. P.: Assessing the climate impacts of trends in stratospheric water vapor, Geophys. Res. Lett., 29, doi:10.1029/2001GL013909, 2002.
Franz, P. and R¨ockmann, T.: High-precision isotope measure-ments of H162 O, H172 O, H182 O, and the 17O-anomaly of wa-ter vapor in the southern lowermost stratosphere, Atmos. Chem. Phys., 5, 2949–2959, 2005, mboxhttp://www.atmos-chem-phys.net/5/2949/2005/.
Friedmann, I. and Scholz, T. G.: Isotopic composition of atmo-spheric hydrogen, 1967–1969, J. Geophys. Res., 79, 785–788, 1974.
Froidevaux, L. and Yung, Y. L.: Radiation and chemistry in the stratosphere: Sensitivity to O2-absorption cross sections in the
Herzberg continuum, Geophys. Res. Lett., 9, 854–857, 1982. Gettelman, A., Holton, J. R., and Rosenlof, K. H.: Mass fluxes of
O3, CH4, N2O and CF2Cl2in the lower stratosphere calculated
from observational data, J. Geophys. Res., 102, 19 149–19 159, 1997.
Gierczak, T., Talukdar, R. K., Herdon, S., Vaghjiani, G. L., and Rav-ishankara, A. R.: Rate coefficients for the reactions of hydroxyl radicals with methane and deuterated methanes, J. Phys. Chem., 101, 3125–3134, 1997.
Greenblatt, G. D. and Howard, C. J.: Oxygen Atom Exchange in the Interaction of18O with Several Small Molecules, J. Phys. Chem., 93, 1035–1042, 1989.
Groo, J.-U.: Modelling of stratospheric chemistry based on
HALOE/UARS satellite data, PhD thesis, University of Mainz, Verlag Shaker, Aachen, 1996.
G¨unther, J., Erbacher, B., Krankowsky, D., and Mauersberger, K.: Pressure dependence of two relative ozone formation rate coeffi-cients, Chem. Phys. Lett., 306, 209–213, 1999.
Guo, J., Abbas, M. M., and Nolt, I. G.: Stratospheric H218O
dis-tribution from infrared observations, Geophys. Res. Lett., 16, 1277–1280, 1989.
Hagemann, R., Nier, G., and Roth, E.: Absolute isotopic scale for deuterium analysis of natural waters. Absolute D/H ratio for SMOW, Tellus, 22, 712–715, 1970.
Holdsworth, G., Fogarasi, S., and Krouse, H. R.: Variation of stable isotopes of water with altitude in the Saint Elias Mountains of Canada, J. Geophys. Res., 96, 7483–7494, 1991.
Holton, J. R., Haynes, P. H., McIntyre, M. E., Douglass, A. R., Rodd, R. B., and Pfister, L.: Stratosphere-troposphere exchange, Rev. Geophys., 33, 403–439, 1995.
Hurst, D. F., Dutton, G. S., Romashkin, P. A., Wamsley, P. R., Moore, F. L., Elkins, J. W., Hintsa, E. J., Weinstock, E. M., Her-man, R. L., Moyer, E. J., Scott, D. C., May, R. D., and Webster, C. R.: Closure of the total hydrogen budget of the northern ex-tratropical lower stratosphere, J. Geophys. Res., 104, 8191–8200, 1999.
IPCC, Climate Change 2001: The Scientific Basis, Contribution of Working Group I to the Third Assessment Report of the In-tergovernmental Panel on Climate Change (IPCC), edited by: Houghton, J. T., Ding, Y., Griggs, D. J., Noguer, M., van der Linden, P. J., and Xiaosu, D., Cambridge University Press, UK, pp. 944, 2001.
Janssen, C., Guenther, J., Krankowsky, D., and Mauersberger, K.: Relative formation rates of50O3, and52O3 in16O–18O
mix-tures, J. Chim. Phys., 111, 7179–7182, 1999.
Johnson, D. G., Jucks, K. W., Traub, W. A., and Chance, K. V.: Isotopic composition of stratospheric ozone, J. Geophys. Res., 105, 9025–9031, 2000.
Johnson, D. G., Jucks, K. W., Traub, W. A., and Chance, K. V.: Isotopic composition of stratospheric water vapor: Mea-surements and photochemistry, J. Geophys. Res., 106, 12 211– 12 218, 2001a.
Johnson, D. G., Jucks, K. W., Traub, W. A., and Chance, K. V.: Isotopic composition of stratospheric water vapor: Implications for transport J. Geophys. Res., 106, 12 219–12 226, 2001b. JPL (Ed.): Chemical Kinetics and Photochemical Data for Use in
Atmospheric Studies, JPL, 2003.
Kaiser, J. and R¨ockmann, T.: Absence of isotope exchange in the reaction of N2O+O(1D) and the global 17O
bud-get of nitrous oxide, Geophys. Res. Lett.,, 32, L15808, doi:10.1029/2005GL023199, 2005.
Kaye, J. A. and Strobel, D. F.: Enhancement of heavy ozone in the Earth’s atmosphere?, J. Geophys. Res., 88, 8447–8452, 1983 Kaye, J. A.: Analysis of the origins and implications of the18O
content of stratospheric water vapour, J. Atmos. Chem., 10, 39– 51, 1990.
Keith, D. W.: Stratospheric-tropospheric exchange: Inferences from the isotopic composition of water vapour, J. Geophys. Res., 105, 15 167–15 173, 2000.
Khalil, M. A. K., Khalil, M. A. K., Shearer, M. J., and Rasmussen, R. A.: Methane sinks and distribution, in: Atmospheric Methane: Sources, Sinks, and Role in Global Change, edited by: Khalil, M.